Free Republic
Browse · Search
Bloggers & Personal
Topics · Post Article

Skip to comments.

2024 Post-Election Survey: Racial Analysis of 2024 Election Results
Navigator Research ^ | 12/11/2024 | Maryann Cousens

Posted on 12/16/2024 5:43:54 PM PST by SeekAndFind

Exit Poll: Racial Demographics

This Navigator Research report is the fifth in a series of releases of findings from our post-election survey among 5,000 self-reported 2024 general election voters. This release focuses on how racial groups voted in the 2024 election, including what issues mattered most when deciding who to vote for, and how vote shares compared to that of the 2020 election.

Trump overperformed with voters across racial demographics, particularly among men of color.


Donald Trump improved his standing with voters across racial demographics, including white voters (from net +13 in 2020 to net +16; 40 percent Harris – 56 percent Trump), Hispanic voters (from net +38 in 2020 to net +11; 53 percent Harris – 42 percent Trump), Asian-American and Pacific Islanders (from net +31 in 2020 to net +20; 58 percent Harris – 38 percent Trump), and Black Americans (from net +84 in 2020 to net +67; 81 percent Harris – 14 percent Trump).

Bar graph of polling data from Navigator Research. Title: Harris Struggled Relative to Biden in 2020 Among Men, Younger Voters, and Non-College Voters Who Are Black and Hispanic

Disapproval of the direction of the country, the state of the economy, and President Biden’s handling of the presidency was widespread among white and Hispanic voters.


By a 36-point margin, the overall electorate indicated the country was off on the wrong track (27 percent right direction – 63 percent off on the wrong track), including white voters by a 40-point margin (26 percent right direction – 66 percent off on the wrong track) and Hispanic voters by a 29-point margin (30 percent right direction – 59 percent off on the wrong track). The same groups were overwhelmingly pessimistic about the state of the economy, with white voters having negative attitudes towards the economy by 46-points (26 percent positive – 72 percent negative) and Hispanic voters by 42-points (28 percent positive – 70 percent negative). Black voters, while still negative about the economy (net -18; 39 percent positive – 57 percent negative), approved of Biden’s handling of the economy by 29-points (62 percent approve – 33 percent disapprove), compared to white and Hispanic voters who disapproved of Biden’s handling of the economy (net -34 and net -18, respectively).

  • Retrospective views of Trump’s handling of the presidency were mixed, with 59 percent of white voters, 48 percent of Hispanic voters, 35 percent of AAPI voters, and 25 percent of Black voters approving of his job as president.

Bar graph of polling data from Navigator Research. Title: Voters Across the Board Were Pessimistic About the State of the Economy and the Country, Particularly White and Hispanic

Bar graph of polling data from Navigator Research. Title: Disapproval of Biden’s Handling of the Presidency and the Economy Was Most Felt By White, Hispanic, and AAPI Voters

Bar graph of polling data from Navigator Research. Title: Across Race and Ethnicity, Voters Gave Trump Lower Ratings on Popularity and Higher Ratings on Actual Job Approval

Across racial demographics, inflation and the cost of living was the most important issue in deciding who to vote for.


46 percent of white voters, 42 percent of Hispanic and Asian-American and Pacific Islander voters, and 31 percent of Black voters indicated inflation and the cost of living was a top three issue for them in deciding who to vote for in the 2024 election. Immigration and the border was the second most popular issue among the overall electorate (31 percent indicated as a top three issue), particularly among white voters (35 percent) and Hispanic voters (27 percent). 23 percent of voters indicated abortion as an important issue in deciding who they would vote for, including 26 percent of Black voters and 24 percent of Hispanic voters.

Bar graph of polling data from Navigator Research. Title: Inflation Was a Top Issue Across Race and Ethnicity; White and Hispanic Voters Prioritized Immigration, Black Voters Abortion

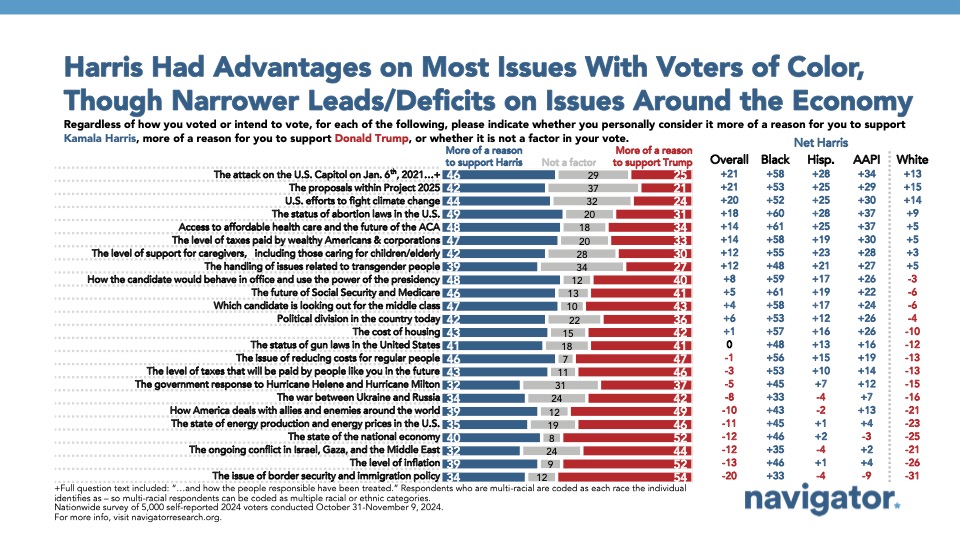
Harris held advantages on most issues among voters of color, but was underwater among white and Hispanic men on economic issues.


Harris held large advantages on handling abortion (net +18; 49 percent trust Harris – 31 percent trust Trump), making health care more affordable (net +14; 48 percent trust Harris – 34 percent trust Trump), and safeguarding the future of Social Security and Medicare (net +5; 46 percent trust Harris – 41 percent trust Trump). On economic issues, Trump held an advantage among the overall electorate on issues like inflation (net +13; 52 percent trust Trump – 39 percent trust Harris), the state of the national economy (net +12; 52 percent trust Trump – 40 percent trust Harris), and reducing costs for regular people (net +1; 47 percent trust Trump – 46 percent trust Harris). White voters were the most likely to trust Trump on economic issues, trusting Trump by double-digit margins on reducing costs (net +13), handling the state of the national economy (net +25), and handling inflation (net +26). Hispanic men also indicated trusting Trump more to handle inflation (net +11), and the economy (net +10), but trusted Harris more when it came to reducing costs for normal people (+2).

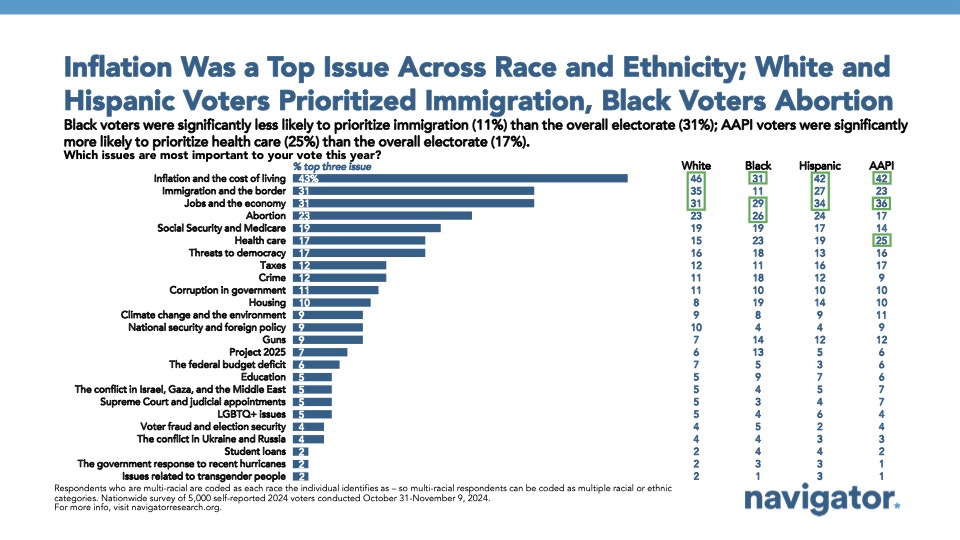
  • Trump’s greatest trust advantage among the overall electorate was in handling immigration and border security, including among white voters by 31-points, Asian-American and Pacific Islander voters by 9-points, and Hispanic voters by 4-points.

Young men of color did not vote for the Democratic candidate the same way they did in 2020, an effect of deep pessimism about the country and their focus on reducing costs.


Black and Hispanic men between the ages of 18-44 were pessimistic about the economy by double-digit margins going into election day (net -11 and net -29, respectively), as both groups also cited inflation and the economy as top three issues in deciding their vote (young Black men; 39 percent jobs and the economy, 27 percent inflation – young Hispanic men; 39 percent inflation, 37 percent jobs and the economy). Young Black and Hispanic men also retrospectively approved of Trump’s handling of the presidency (net +2 and net +16, respectively). Trump’s retrospective approval plus pessimism about the economy led to a much lower vote share for the Democratic candidate in 2024 than in 2020 among these groups, with young Hispanic men splitting their vote between Harris and Trump (49 percent Harris – 49 percent Trump), and Black men voting for Harris by 34-points (64 percent Harris – 30 percent Trump), a much smaller margin than their vote for Biden in 2020 (net +73; 86 percent Biden – 13 percent Trump).


TOPICS:
KEYWORDS: 2024; election; ethnicity; race

1 posted on 12/16/2024 5:43:54 PM PST by SeekAndFind
[ Post Reply | Private Reply | View Replies]

To: SeekAndFind

These graphs are from the view of Intersectionalism and identity politics. I submit that the election was more about the policies of the Dems.


2 posted on 12/16/2024 5:45:57 PM PST by taxcontrol (You are entitled to your opinion, no matter how wrong it is.)
[ Post Reply | Private Reply | To 1 | View Replies]

To: SeekAndFind

WAKE UP BLACK WOMAN!!!


3 posted on 12/16/2024 5:48:17 PM PST by God luvs America (6young 3.5 million pay no income tax and vote for DemoKrats...)
[ Post Reply | Private Reply | To 1 | View Replies]

To: SeekAndFind

Interesting that both black and Hispanic men shifted to TRUMP by identical 35 point margins.


4 posted on 12/16/2024 5:53:25 PM PST by nwrep
[ Post Reply | Private Reply | To 1 | View Replies]

To: SeekAndFind

Notice that censorship (whether on the Internet or on college campuses or in the workplace) is not one of the policy choices.

Imho that is a critical issue for all Americans.


5 posted on 12/16/2024 5:56:30 PM PST by cgbg (It is time to pull the Deep State out of the mass media--like ticks from a dog.)
[ Post Reply | Private Reply | To 1 | View Replies]

To: SeekAndFind; Liz; Red Badger; SJackson

No results for “Conservative Jewish voters” vs “Liberal/Secular-Socialist Jewish Voters”?


6 posted on 12/16/2024 6:05:23 PM PST by Robert A Cook PE (Method, motive, and opportunity: No morals, shear madness and hatred by those who cheat.)
[ Post Reply | Private Reply | To 1 | View Replies]

Disclaimer: Opinions posted on Free Republic are those of the individual posters and do not necessarily represent the opinion of Free Republic or its management. All materials posted herein are protected by copyright law and the exemption for fair use of copyrighted works.

Free Republic
Browse · Search
Bloggers & Personal
Topics · Post Article

FreeRepublic, LLC, PO BOX 9771, FRESNO, CA 93794
FreeRepublic.com is powered by software copyright 2000-2008 John Robinson