http://calculatedrisk.blogspot.com/2006/11/lazear-still-misunderstands-housing.html
The first graph shows Starts vs. Completions. Starts have fallen "off a cliff", but completions have just started to fall. 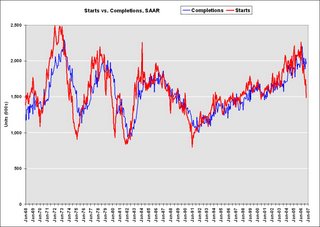
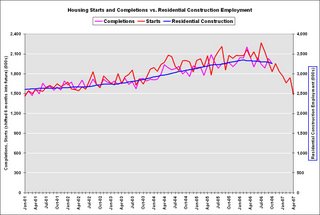
This graph shows starts, completions and residential construction employment. (starts are shifted 6 months into the future). Completions and residential construction employment are highly correlated, and Completions lag Starts by about 6 months. Based on historical correlations, it is reasonable to expect Completions and residential construction employment to follow Starts "off the cliff".