A compartment model of vertebrate phototransduction
Abstract
A compartment model has been developed to explain the different sensitivities and adaptation properties of vertebrate rods and cones. For the cones, the natural compartment is a single fold of the plasma membrane; for the rods, the size of the compartment had to be defined empirically. In this model, the number of compartments controls the amplitude of the single photon response; the size of the compartment sets the position of intensity response curve on the intensity axis. Using the Ergodicity theorem, the adaptation properties are predicted from the number of compartments and the decay time constant of the single photon response.
Introduction
 I am a biophysicist currently interested in finding out why rods and cones in the vertebrate retina have different sensitivities to light and why their adaptation properties under non-bleaching light conditions are also so different when the biochemistry, well reviewed in [1], seems very similar in these two types of receptors.
 As a starting point, I use the well known anatomical difference between the structure of the outer segment of these photoreceptors, and to illustrate this I use the beautiful illustrations from Alfieri, R. et al. [2] (permission requested).
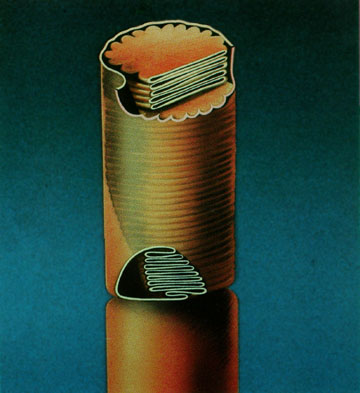
Figure 1: Rod illustration showing
the stack of disks in a cylindrical shell.
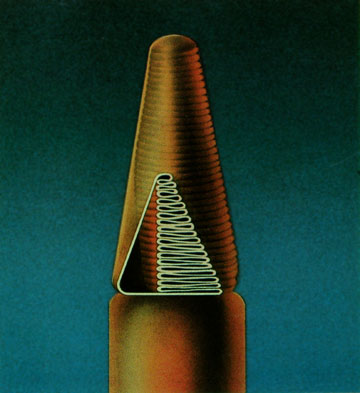 The main difference being that, while the cone disks or folds hang out in space, the rod disks are internalized in a cylindrical shell.
Furthermore, a three dimensional study shows that the cone fold is connected to the ciliary part of the ultrastructure through an minute opening which spans less that 20 degrees of the circumference[3].
Figure 2: Cone illustration showing
the folds as being part of the plasma membrane.
The next consideration involves the existence of compartments in these structures which limit in volume the extent of the biochemical reactions following the capture of one photon. In the case of the cone, I will try to show that membranes limit the size of the compartment; when , for the rod, we are facing a "operational compartment", which I will define later. Two factors and one hypothesis are important for the following discussion:
- Time to peak of the single photon response.
- Diffusion coefficient of the molecules involved in the biochemical cascade.
- The action of one photon is maximal in a given compartment.
Intensity-Response
 The biochemistry underlying the phototransduction has been the focus of studies over the past fifteen years; the current view is well illustrated by a scheme of Nakatani. The idea that the outer segment is compartmentalized is not new. Back in 1981, in order to explain the shape of the intensity-response data curve, Lamb et al. [4] had developed the total occlusion model. This curve also called the "Exponential Saturation" curve can be used to fit experimental data and replace the "Michaelis-Menten" curve; its mathematical expression is : R/Rmax = 1 - Exp[-kI], where I is the flash intensity and k , a curve fitting parameter. In this model, I try to obtain an estimate for the number of compartments and their size in both rods and cones. From the results, I have an estimate of the single photon response and a value for "k" .
Figure 3: Shape of the Intensity-Response
Curve in the "Total Occlusion Model".
Weber-Fechner Adaptation
Under non-bleaching light conditions, the reduction in sensitivity of photoreceptors as the background light increases in intensity follows a law, described more than a century ago, the Weber-Fechner law. It shows that the normalized sensitivity falls as the background intensity "I" increases according to the simple relation " Io/(I + Io) ", Io being the intensity required to reduce the sensitivity by one half.It is interesting to note that one century before Weber and Fechner, the frenchman Pierre Bouguer was the first to measure the effect of ambient light on threshold in the photopic state. His measure of increment threshold was 1/64 of the background intensity, a value still accepted today.
The adaptation properties of a compartment model had never been analyzed before. My approach is a so called "black box" approach and follows the following lines. After an isomerization which produced a maximal effect, the compartment is perturbed and the reactions controlling the response are being restored to their equilibrium dark adapted values. Of the many reactions going through this process, one of them is rate limiting and I have made the hypothesis that the shape of the single photon response reflects this rate limiting reaction which controls the sensitivity. It is therefore important to define a shape for the single photon response and I have chosen the simple exponential. That is, following an isomerization, the photocurrent has a sharp rise followed by an exponential decay, characterized by a time constant. This is not a bad approximation, since dark adapted rods and cones show this behavior [5].
To analyse a compartment system, I make use of a theorem in Statistical Mechanics called "The Ergodic hypothesis" or " The theorem of Ergodicity" which states : For a stationary random process, a large number of observations made on a single system at N arbitrary instants of time have the same statistical properties as observing N arbitrary chosen systems at the same time from an ensemble of similar systems. If I equate compartment to system, I can analyse the behavior of single compartment over time, under a given background condition and predict the behavior the whole photoreceptor made of a given number of compartments.
After an isomerization which produces a maximal response (normalized here to 1) decaying exponentially with a time constant "T", the amplitude of the response to a following photon will depend on the time since the preceding isomerization and will be equal to " 1 - Exp[-t/T] ". Since the intervals between isomerizations are Poisson distributed, one can simulate a given background intensity and find out the mean response in the compartment. This was done using Mathematica, and the dots in Fig.4 are the results of such a simulation. It can be seen that the dots lie exactly over the curve Io/(Io + I). The conclusion being that such a system adapts exactly as the Weber-Fechner law predicts. This is a major contribution of this analysis.
Figure 4: Sensitivity as a function of background
The Weber-Fechner curve.
The single parameter Io, which up to now, was simply adjusted to fit the experimental data, is now linked to the structure of the outer segment , that is the number of compartments, and the decay time constant of the single photon response. The relationship being that Io is equal to N/T, where N is the number of compartments and T, the time constant of the decay.
The results are that, from the knowledge of size of the compartments, their number and the decay time constant of the single photon response, one can localize in an absolute fashion the position of both the intensity and the adaptation curves on their intensity axis.
Results and Discussion
The cone case
The small flash response of a mammalian cones peaks at about 50 msec.; the cascade proteins iodopsin, transducin and phosphodiesterase have diffusion coefficient ranging from 0.5 to 2 microns square per sec. Diffusing in two dimensions, very few of these excited molecules can leave a fold having a diameter of 1.5 to 2 microns in this short amount of time. Cyclic GMP, which diffuses faster, in order to be hydrolysed in the active fold, has first to find the exit in its own fold and then find the entrance to active fold. My hypothesis is that this is a rare event. Inside the active fold, it can be shown by simple calculus that the number of active phosphodiesterase molecules can exceed the number of free cGMP molecules present. Therefore, the possibility exists that all the fold cationic channels are closed following a single isomerization.The first result of this analysis is that, if in the cones, the fold represents a compartment and the response within that compartment is maximal, then the single photon response is 1/N, where N is the number of folds. From electron microscope pictures, one knows that the number of folds per micron is about 33. Thus from the total length of the cone in microns multiplied by 33 gives the number of folds. For the turtle cone, the number of folds is close to 800 yielding a prediction for the single photon response of 0.125 % change, this is in agreement with experimentally observed values of 0.16% [6]. It also indicates why cones are in general short; if adding a fold to the cone outer segment increases the photon catching probability, it reduces at the same time the response from 1/N to 1/(N+1). Nature had to make a compromise between catching photons and giving a response of adequate size.
From the dimensions of the compartment, that is the cone fold, it is possible to calculate a value for the factor " k "is the exponential saturation formula [7]. Knowledge of the optical density per unit length and the quantum efficiency are required to derive that for cones " k " is equal to : 0.00059 times the square of the diameter of the cone outer segment expressed in microns. This formula was derived for cones stimulated transversely; this corresponds to the experimental situation when recording from the outer segment. It is also valid for axial stimulation, which corresponds to the physiological situation, as long as the outer segments are not too long. For Macaque cones which have a diameter in the order of 1.5 microns, the value for " k " calculated with the above formula is equal to 0.001 square microns close to the experimentally obtained value of 0.0004 [8].
To obtain an estimate of the background intensity (measured in isomerizations per sec.) which will reduce the sensitivity by 50 %, one simply divides the number of compartment ( 800 in the case of the turtle cone) by the the decay time constant of the small flash cone response measured from experimental data. This gives an isomerization rate of 7300 per sec. for Io , when the experimental ones are from 2000-16000 per sec [9].
The rod case
For the rods, the compartment is not defined by membranes as it was the case for the cone, it is rather a combination of the facts that the proteins involved in the phototransduction cascade have all a limited lifetime and that the cGMP molecule controlling the opening of the cationic channels has a much reduced coefficient of diffusion in the environment of the rod outer segment. Time to peak for the mammalian rod response is about 100 msec., this allows more transducin and more phosphodiesterase to be activated by a single rhodopsin . The action of the biochemistry can spread beyond the interdisk space and extend longitudinally. The geometry of the rod stack of disks is also important in the sense that the cGMP molecules located between the disks must be hydrolysed first if the reduction in concentration is to proceed longitudinally. This limits the action of the biochemistry, we are in the presence of what I call an "operational compartment".The exact solution for the longitudinal cGMP concentration close to the plasma membrane,after an isomerization in a given disk, would require complex calculations in fluid dynamics. Therefore, an empirical formula has been obtained from the analysis of the single photon response in many species. It says that the closed channels cover an area of plasma membrane equal to that contained in a disk (two leaflets) of the outer segment. Simple math yields for the "occlusion length" a length of outer segment equal to half the diameter. For the frog and mammalian rods this gives a current reduction close to 5% resulting from a single isomerization, the value obtained experimentally. A set of calculations similar to those done for the cone gives a value of "k" for rods equal to 0.01 times the cube of the diameter expressed in microns. This allows the absolute location of the intensity-response curve on the intensity axis. For mammalian rods, the calculated value for k is 0.08 microns square, while experimentally obtained values are in the range of 0.006-0.07. [7,10]
The number of compartments "N" in rods is obtained by dividing the length of the outer segment by d/2, and yields a number close to 20. Io in the Weber-Fechner relation is obtained by dividing 20 by the time constant of the exponential fitted to the decay of the single photon response. For monkey and human rods, the predictions of the model are that Io should be in the range of 110-113 isomerizations per sec. when experimental values are in the range of 100-120 per sec. [7,10]
Conclusion
Analysis of the geometrical structure of the vertebrate outer segment has yielded interesting dividends.- First, it has allowed a prediction of the single photon response in both rods and cones and a value for the parameter "k" in the exponential saturation formula, permitting an absolute localization on the curve on the intensity axis.
- Second, with the help of the "Ergodicity theorem", I have been able to predict the adaptation behavior of a compartment system. If the decay of the response can be approximated to a decaying exponential, the result is the "Weber-Fechner" law. Again, this curve can be located on the intensity axis in an absolute fashion.
Finally, the model can be tested in the sense that, in cold blooded vertebrate, the time constant of the decay of the single photon response changes with the temperature[11] . One can test if the adaptation properties (Io) vary accordingly.