Something like that. But the curve in recent years is off. The problem is (1) what measures the value of a $1, year by year, and (2) the value of a $1 spent out of pocket is considerably different than the value a $1 among of a few million aggregated in some big transaction. That is, the value of a single dollar of money in circulation is non-linear by size of aggregate in use.
We see the same kind of thing in chemistry. A solid of millions of of atoms only has a few atoms at the active chemical surface. Every single molecule in a gas is chemically active. In an economy parts are solid-like — solids of differing sizes, and parts are gases, and I guess parts are liquids, although analogies strain by over-extension or can easily be misunderstood by those not willing or not able to use them well.
Economies have a fractal nature wrt monies. The fractal characteristic of our economy has radically changed from the days of the gold standard.
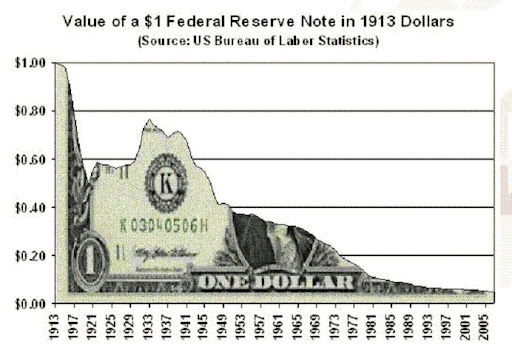
Yeah, so what? Nearly 100 years of mild inflation does that.
Do you know what the currency looked like prior from 1800 to 1913? It was like a yoyo. We had deflationary depressions every 20 years. In fact if you put $100 into a basket of goods, that same basket of goods would only sell for about $58, because of the deflation that had occurred. That's not good either. In fact, deflation is thought to cause depressions.
Mild inflation however, is good for the economy. It encourages people to invest their money, rather than just hoard it under their mattress.
Do you happen to have another chart showing real income growth over the same time period? Have our incomes grown faster than the rate of inflation since 1913?