Posted on 06/15/2012 12:36:44 PM PDT by Ernest_at_the_Beach
From their Die kalte Sonne website, Professor Fritz Vahrenholt and Dr. Sebastian Lüning put up this guest Post by Prof. Jan-Erik Solheim (Oslo) on Hansen’s 1988 forecast, and show that Hansen was and is, way off the mark. h/t to Pierre Gosselin of No Tricks Zone and WUWT reader tips.

One of the most important publications on the “dangerous anthropogenic climate change” is that of James Hansen and colleagues from the year 1988, in the Journal of Geophysical Research published. The title of the work is (in German translation) “Global climate change, according to the prediction of the Goddard Institute for Space Studies.”
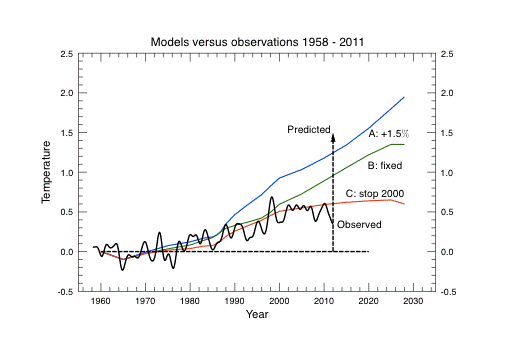
In this publication, Hansen and colleagues present the GISS Model II, with which they simulate climate change as a result of concentration changes of atmospheric trace gases and particulate matter (aerosols). The scientists here are three scenarios: A: increase in CO 2 emissions by 1.5% per year
B: constant increase in CO 2 emissions after 2000
C: No increase in CO 2 emissions after 2000
The CO 2 emissions since 2000 to about 2.5 percent per year has increased, so that we would expect according to the Hansen paper a temperature rise, which should be stronger than in model A. Figure 1 shows the three Hansen scenarios and the real measured global temperature curve are shown. The protruding beyond Scenario A arrow represents the temperature value that the Hansen team would have predicted on the basis of a CO 2 increase of 2.5%. Be increased according to the Hansen’s forecast, the temperature would have compared to the same level in the 1970s by 1.5 ° C. In truth, however, the temperature has increased by only 0.6 ° C.
It is apparent that the next to it by the Hansen group in 1988 modeled temperature prediction by about 150%. It is extremely regrettable that precisely this type of modeling of our politicians is still regarded as a reliable climate prediction.
fyi
From the comments:
**********************************************EXCERPT************************************
chicagoblack says:
Irrelevant. The Farmer’s Almanac predicted last year would be colder but it wasn’t. Modeling accuracy changes over time and improvements are obviously made just like with other measurement techniques, climate or otherwise.
****************************************************************
And
***********************************************************
RobRoy says:
chicagoblack says:
“Modelling accuracy changes over time”
Modelling inaccuracies become apparent over time. Nothing could be more relevant than showing the “Team”, then and now, cannot predict climate and have over-estimated the warming from CO2 by 150 percent.
Irrelevant? Give us a break, Dude.
*******************************************EXCERPT*****************************************
Alvin says:
@Chicagoblack
The problem is that, as with the IPCC executive summary, the findings are political in nature. We are already told that catestrophic global warming was emminent based on their finding. Now we see how far off their models were, and continue to be. Yet the finding does not change. The political is driving the scientific. Your comment “Modeling accuracy changes over time and improvements are obviously made just like with other measurement techniques, climate or otherwise.” is irrelevant. Even if the models were re-made to show 100% accuracy in hindcast and observed it would not change the political intent to fundimentally change social progress. Capitalism and the western way of life is the target.
IMHO.
More:
*********************************************EXCERPT*************************************
Reg Nelson says:
The graph is mislabeled. The blue line represents the projected increase in carbon taxes, green subsidies and climate science funding and should be labeled in dollars. Hansen was spot on with this model.
*************************************EXCERPT*************************************
kim2ooo says:
Question: Does it really mean 150% ?
OR
“Temperatures are lower than Hansen forecast they would be if humans disappeared off the planet twelve years ago.”
http://stevengoddard.wordpress.com/2012/06/15/clarifying-hansens-scenarios-worse-than-it-seems/
“Modelling accuracy changes over time”
And it improves as the data recedes into the past.
I believe the responder Reg Nelson, hit it on the nail regarding the blue plot.
But the graph appears to show a ~0.3 degree increase (the "observed" line) 0.6 C = 1.08 F so that can't be it. Also have CO2 emissions increased by 2.5% per year? If so then Hansen was far more than 150% wrong. It appears that he said that if CO2 emissions were frozen at 2000 levels, there would be a 0.6 C increase (it appears the reporter got this prediction line confused with actual results), and that a 1.5% increase would lead to a ~1.2 C increase. I'm not sure what he meant by "constant increase," but I would guess he meant something between 0% and 1.5%. I would conservatively estimate the Hansen model would predict a 2.0 C increase in temperature for a 2.5% per year increase in CO2. But that would make him around 666% wrong, not 150%.
Hmmm....150% of 0.6 is 1.5. So maybe Hansen’s model predicts a 1.5 C rise for an increase of 2.5% per year? If so that’s only 500% wrong.
btt

Global Warming on Free Republic
Disclaimer: Opinions posted on Free Republic are those of the individual posters and do not necessarily represent the opinion of Free Republic or its management. All materials posted herein are protected by copyright law and the exemption for fair use of copyrighted works.