Posted on 10/16/2014 7:00:43 AM PDT by SeekAndFind
Most people that discuss the "economic collapse" focus on what is coming in the future. And without a doubt, we are on the verge of some incredibly hard times. But what often gets neglected is the immense permanent damage that has been done to the U.S. economy by the long-term economic collapse that we are already experiencing. In this article I am going to share with you 12 economic charts that show that we are in much, much worse shape than we were five or ten years ago. The long-term problems that are eating away at the foundations of our economy like cancer have not been fixed. In fact, many of them continue to get even worse year after year. But because unprecedented levels of government debt and reckless money printing by the Federal Reserve have bought us a very short window of relative stability, most Americans don't seem too concerned about our long-term problems. They seem to have faith that our "leaders" will be able to find a way to muddle through whatever challenges are ahead. Hopefully this article will be a wake up call. The last major wave of the economic collapse did a colossal amount of damage to our economic foundations, and now the next major wave of the economic collapse is rapidly approaching.
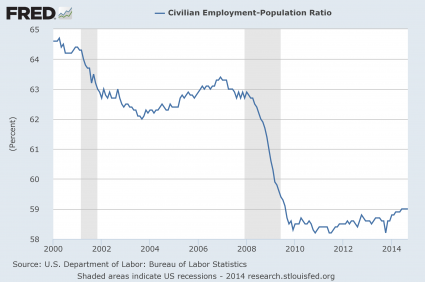
#1 Employment
The mainstream media is constantly telling us about the "employment recovery" that is happening in the United States, but the truth is that it is just an illusion. As the chart below demonstrates, just prior to the last recession about 63 percent of all working age Americans had a job. During the last wave of the economic collapse, that number dropped to below 59 percent and stayed there for a very long time. In the past few months we have finally seen the employment-population ratio tick back up to 59 percent, but we are still far, far below where we used to be. To call the tiny little bump at the end of this chart a "recovery" is really an insult to our intelligence...
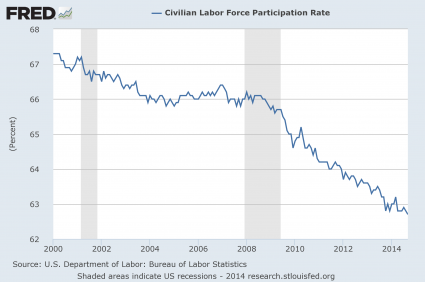
#2 The Labor Force Participation Rate
The percentage of Americans that are either employed or currently looking for a job started to fall during the last recession and it has not stopped falling since then. The labor force participation rate has now fallen to a 36 year low, and this is a sign of a very, very sick economy...
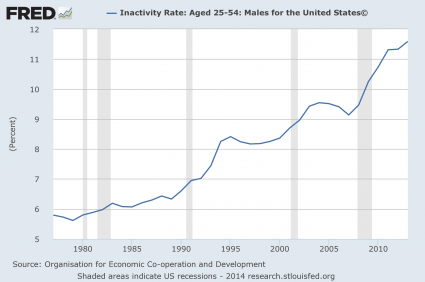
#3 The Inactivity Rate For Men In Their Prime Years
Some blame the decline in the labor force participation rate on the aging of our population. But it isn't just elderly people that are dropping out of the labor force. In fact, the inactivity rate for men in their prime working years (25 to 54) continues to rise and is now at the highest level that has ever been recorded...
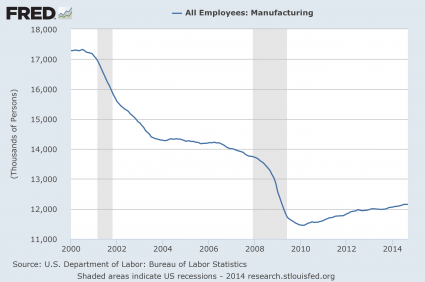
#4 Manufacturing Employees
Once upon a time in America, anyone that was reliable and willing to work hard could easily find a manufacturing job somewhere. But we have stood by and allowed millions upon millions of good paying manufacturing jobs to be shipped out of the country, and now many of our formerly great manufacturing cities have been transformed into ghost towns. Over the past few years, there has been a slight "recovery", but we are still well below where we were at just previous to the last recession...
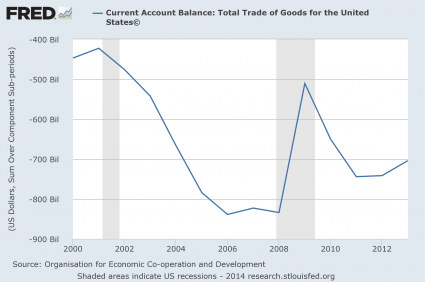
#5 Our Current Account Balance
As a nation, we buy far more from the rest of the world than they buy from us. In other words, we perpetually consume far more wealth than we produce. This is a recipe for national economic suicide. Our current account balance soared to obscene levels just prior to the last recession, and now we have almost gotten back to those levels...
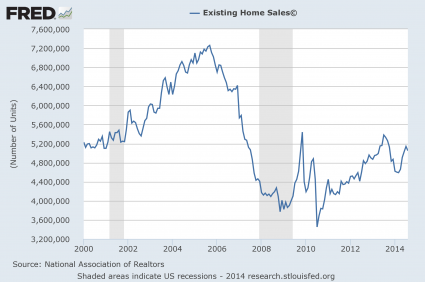
#6 Existing Home Sales
Our economy has never fully recovered from the housing crash of 2007-2008. As you can see from the chart below, the number of existing home sales is still far below the level that we hit back in 2006. At this point we are just getting back to the level we were at in 2000, but our population today is far larger than it was back then...
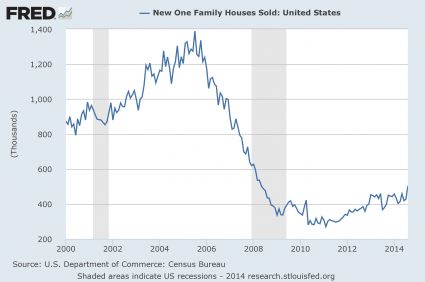
#7 New Home Sales
Things are even more dramatic when you look at new home sales. This is an industry that have been absolutely emasculated. The number of new home sales in the United States is just a little more than half of what it was back in 2000, and it isn't even worth comparing to what we experienced during the peak of 2006.
#8 The Monetary Base
In a desperate attempt to get the economy going again, the Federal Reserve has been wildly printing money. It has been so reckless that it is hard to put it into words. When I look at this chart, the phrase "Weimar Republic" comes to mind...

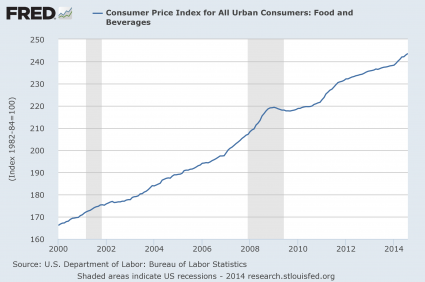
#9 Food Inflation
Thankfully, much of the money that the Federal Reserve has been injecting into the system has not made it into the real economy. But enough of it has gotten into the system to force food prices significantly higher. For example, my wife went to the store today and paid just a shade under 10 bucks for just four pieces of chicken. And as you can see from the chart below, food prices have been steadily going up in America for a very long time...
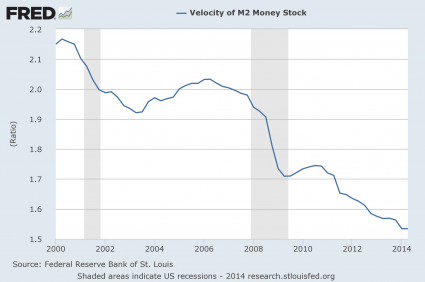
#10 The Velocity Of Money
One of the reasons why we have not seen even more inflation is because the velocity of money is extraordinarily low. In general, when an economy is healthy money tends to flow through the system rapidly. People are buying and selling and money changes hands frequently. But when an economy is sick, money tends to stagnate. And that is exactly what is happening in the United States right now. In fact, at this point the velocity of the M2 money stock has dropped to the lowest level ever recorded...
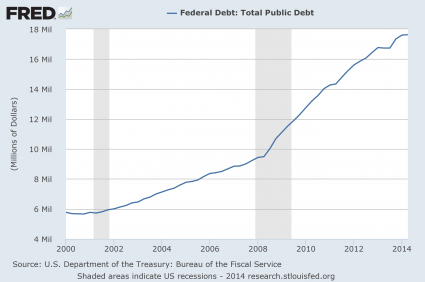
#11 The National Debt
As our economic fundamentals have deteriorated, our politicians have attempted to prop up our standard of living by borrowing from the future. The U.S. national debt is on pace to approximately double during the Obama years, and it increased by more than a trillion dollars in fiscal year 2014 alone. Despite assurances that "the deficit is under control", the federal government borrows about a trillion dollars a year to fund new spending in addition to borrowing about 7 trillion dollars to pay off old debt that is coming due. What we are doing to future generations of Americans is absolutely criminal, and it is just a matter of time before this Ponzi scheme totally collapses...
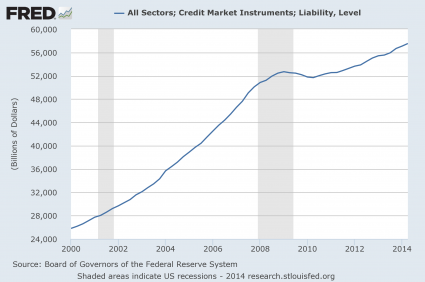
#12 Total Debt
Of course it is not just the federal government that is gorging on debt. When you add up all forms of debt in our society (government, business, consumer, etc.) it comes to a grand total of more than 57 trillion dollars. This total has more than doubled since the year 2000...
If you know anyone that believes that we are in good economic shape, just show them these charts.
The numbers do not lie. Our economy is sick and it is getting sicker by the day.
And of course the next major financial crisis could strike at any time. U.S. stocks just experienced their worst week in three years, and if cases of Ebola start popping up around the country the fear that would cause could collapse our economy all by itself.
The debt-fueled prosperity that we are enjoying today is not real. We are living on the fumes of our past, and every single day our long-term problems get even worse.
Anyone with half a brain should be able to see what is coming.
Sadly, most Americans will continue to deny the truth until it is far too late.
Could be worse. If the US is operating off of fumes, then China is operating off of not even fumes, but promises of fumes.
The real source of prosperity in the end isn’t even people; it’s God. The worldly system can get all tangled up by debts. God has a foolproof method of cutting that Gordian knot. But it has to be called upon. We can’t just sit here and celebrate ourselves and think it will send us anywhere but to hell in a handcart.
And Congress will act "surprised."
These statistics are obviously racist. Or Homophobic, or sumpin’...
They are racist because many show how steeply things declined after Dems took over Congress in 2006.
The US government still operates on a kind of suffrage. If people put more vigor into clamoring for folly than for wisdom, then folly they will get.
Yes, with 10 Year US Treasuries at 2.1% and oil dropping to $80 a barrel, we're exactly like the Weimar Republic.
The ultimate fate of the US transcends the secular (either to the evil or to the good).
Weimar was weak and very vulnerable to the first strong charm that came its way. We know what that was.
Excellent research and data. Good job.
Looks like “something” happened around 2009,
but I just couldn’t possibly think what.
First, note that none of those charts have a vertical scale that starts at zero. A truncated scale like that magnifies the slope of the graph, and can mislead the viewer. If the scale had started at zero, the declines would not appear to be so drastic. However, the fact that the charts can be misleading doesn't take away from the fact that they portray a real problem.
Second, back in the 1980s, before I retired, I did a lot of studying of economic and technological trends. One of the things that really stuck out, to me, was the long-term effects of the Great Depression. It did permanent damage to the economy. Yes, after 1945 the trends started up at about the same slope they had prior to 1930, but they never caught up to a projection of the trends prior to 1930. We were always "behind" by about the amount we dropped during the Depression. It's not true that World War II cured the Depression. We never did get back on track.
Apparently the "great recession" is going to leave us with the same permanent gap between what we could have achieved had we stayed on the previous trend and what we actually achieve, even if the trends continue at the same slope. That's not surprising, given previous history, but it's still a disaster for those who lost jobs, lost homes, couldn't get jobs, had to delay marriage, etc.
An economist from the Austrian school would argue that both the Great Depression and the Great Recession had the same cause: creating too much money caused malinvestment that eventually had to be liquidated.
Thanks for posting. I will comment on the charts for home sales. These charts are deceiving because they are short term. If you look at a longer picture of homes sales, starts and permits we are slowly getting back to where we should be for a country with a population of 300 million.
What has changed is our demographics. People have chosen not to live in single family homes. This is because either they can not afford them or they do not want to maintain one because of their age. What we are building more now is multifamily homes(condos and apartments). More people are choosing to rent as opposed to buy. There are many huge apartment projects being built in Texas. Not so many in New York or Michigan.
What we had between 2003-2006 was an anomaly. We overbuilt for the population of the country. We did not NEED 2.2 million home starts to be constructed. In 2009 we hit a low of 465,000. Starts went down 75% from their peak. What most economists state is we need about 1.3-1.4 million housing starts/year in the US to keep up with population growth. This year we will probably end up at 1 million starts. Starts have more than DOUBLED from their low in 2009. The projection for 2015-2016 is 1.3 million. Keep in mind houses on average only last 75 years. They burn down, flooded, earthquakes, hurricanes, etc.
The other major change you do not see in these charts is the increase in remodeling and additions to existing homes. Over the last ten years. Many homeowners could not sell their existing home because of the price they own it at relative to the current market. Therefore, they chose to add on instead of moving to a bigger home. This is why Home Depot and Lowes continue to do well.
So, I call BS on these charts to some extent in regards to the hosing trends. Housing is SLOWLY growing out of the worst contraction since the Great Depression. Slow growth is a good thing. That means you actually have to put 20% down and have an income that supports a mortgage and the real estate taxes. Remember, that is what got us into the housing bubble mess in the first place.
The Lumber Broker
Here is how the greater depression affects individuals from 2008 to 2013.
Almost 50% inflation on the essentials such as food, gas, toiletries, etc.
And yet, income declined by 10%.
US Census showed median income went from $56,000 to $51,000.
With real unemployment U6 well somewhere around 12-14% and shadowstats at about 24%, the economy sucks.
And also people are not spending money. There are now articles on how people are "hoarding" money. Well yes, people are not doing well in this Greater Depression, and as a result, they are tightening their belts, holding onto what little they have left, because they don't know what is around the corner, or in other words, how Obama and the democrats are going to screw them again.
PING
That depends on your alternatives.
And how does the dropping price of oil make it worse?
The dropping price of oil makes it better.
And proves that the Weimar comparison is silly.
Steve,
Unfortunately, going forward there will be people in our country that may never own a home. They will not be able to afford one. This is not a good thing. It is reality. It is no different than the fact on average we are getting older.
As we get older we tend to move south. That is why long term, AZ and FL real estate was such a good buy a few years back as opposed to NY or Ohio. This is why foreign investors were buying up luxury houses in the south.
The change in demographics is also the reason why large investors were buying up full subdivisions in the Phoenix valley. They knew that the same people who were being foreclosed on were going to need to rent for the next 7-10 years. If they filed for foreclosure, they would not be able to get a loan to buy another house. They had to rent.
The lending practices today will not let some of these people back into the market until they actually can make a down payment. This is the way it should be.
Nobody said life is fair. Not everybody should be able to buy a house. The 1950’s are over. Ozzy and Harriet are dead.
Disclaimer: Opinions posted on Free Republic are those of the individual posters and do not necessarily represent the opinion of Free Republic or its management. All materials posted herein are protected by copyright law and the exemption for fair use of copyrighted works.