
Posted on 12/04/2012 7:51:16 AM PST by raptor22
Fiscal Policy: Talk of Clinton-era tax rates ignores the fact that the former president, working with a GOP Congress, cut spending as a share of GDP and produced four balanced budgets by focusing on growth, not spending.
Even as he pushes $150 billion in new "stimulus" spending, President Obama argues that to avoid the fiscal cliff we must return to Clinton-era tax rates for wealthy households, with a top marginal rate of 39.6% vs. the Bush-era 35%. Clinton's was an age of balanced budgets and economic growth.
But it was also an era of budgetary restraint in which both parties, not just the GOP, still produced budgets.
It was one, too, in which a Republican Congress led by House Speaker Newt Gingrich produced welfare reform, killed the precursor to cap and trade — Bill Clinton's BTU tax — and stopped ObamaCare's predecessor, HillaryCare, dead in its tracks.
As the Cato Institute's Steve H. Hanke points out, when President Clinton took office in 1993, government expenditures were 22.1% of GDP. When he departed in 2000, the federal government's share of the economy had been squeezed to a low of 18.2%, a decline of 3.9 percentage points. No other modern president has even come close (see table).
Under Clinton, federal spending averaged 19.8% of GDP. In contrast, spending under Obama over the past four years has averaged 24.4% of GDP.
Revenues from Clinton-era tax rates were actually used to pay down the national debt and produce four successive budget surpluses. Obama's tax increases will simply fund new spending.
(Excerpt) Read more at tcotblog.ning.com ...
Revenues from Clinton-era tax rates were actually used to pay down the national debt and produce four successive budget surpluses.
During the impeached former president's administration, the national debt NEVER went down LINK . . .
09/30/2001 5,807,463,412,200.06
09/30/2000 5,674,178,209,886.86
09/30/1999 5,656,270,901,615.43
09/30/1998 5,526,193,008,897.62
09/30/1997 5,413,146,011,397.34
09/30/1996 5,224,810,939,135.73
09/29/1995 4,973,982,900,709.39
09/30/1994 4,692,749,910,013.32
09/30/1993 4,411,488,883,139.38
09/30/1992 4,064,620,655,521.66
09/30/1991 3,665,303,351,697.03
09/28/1990 3,233,313,451,777.25
That table you have posted does not indicate the debt level declined. The title even states it is depicting the level of government expenditures as a percentage of the GDP. That means that the total economy grew at a faster pace than the level of spending, nothing more.
That’s a curious contrast. I wonder what treasurydirect.gov includes that CBO omits.
Does anyone know what the difference is between:
(1) the link you posted, http://www.treasurydirect.gov/govt/reports/pd/histdebt/histdebt_histo4.htm, at the Treasury Department, which shows the national debt as never declining during the Clinton years,
and
(2) the CBO page at http://www.cbo.gov/sites/default/files/cbofiles/ftpdocs/108xx/doc10871/historicaltables.pdf, which shows the national debt as declining and the budget balanced during Clinton's tenure.
Overall, the figures are not at all alike in the two tables, so they must be reporting something different. Does anybody know what the two different statistics are that they're reporting here?
The first link shows the "gross federal debt" and the second linkshows the "debt held by the public". These debts are related in that the gross federal debt is equal to the debt held by the public plus "intragovernmental holdings". This intragovernmental debt is chiefly held by trust funds with a bit more than half of it being held by the Social Security trust fund. A list of these trust funds, along with the actual numbers and sources for the graph above can be found at http://www.econdataus.com/debt09.html. I blogged about this difference a few years ago at this link. Following is an updated graph showing the debt:
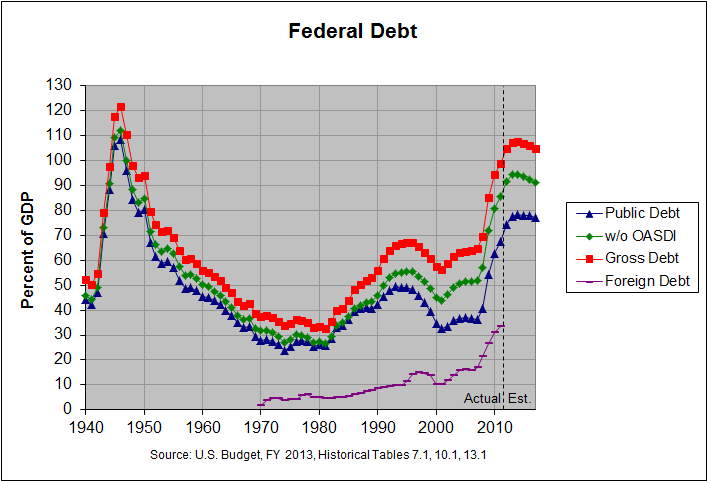
The red line is the gross federal debt and the blue line is the public debt or "debt held by the public". You can find the actual numbers and sources at this link.
Why continue to propagate a fantasy? Revenues from Clinton-era tax rates were actually used to pay down the national debt and produce four successive budget surpluses.
During the impeached former president's administration, the national debt NEVER went down LINK . . .
It depends on what you mean by "national debt". As the table at this link shows, the "gross federal debt" never did decline but the "debt held by the public" did decline in 1998, 1999, 2000, and 2001. It can be seen most clearly in the following graph:
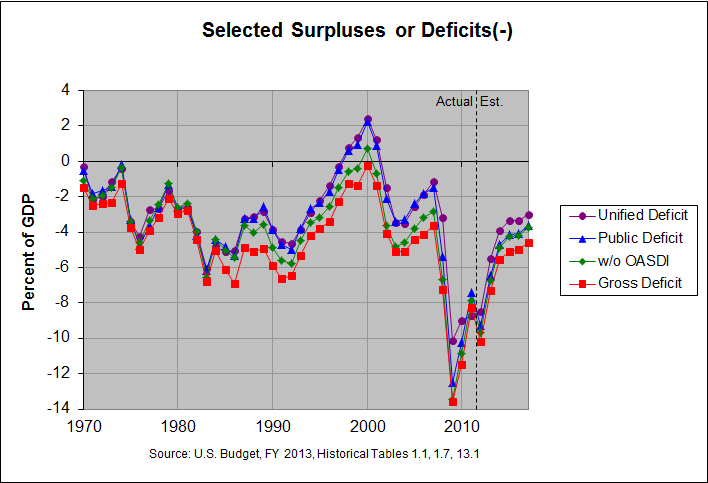
The red line is the "gross federal deficit" and never did reach a surplus though it came close in 2000. However, the purple line is the "unified deficit" and it did reach surplus in 1998 through 2001. You can find the actual numbers and sources for the above graph at this link.
Your chart depicts the accumulated debt measured against the GDP. A lessened level does not indicate a lower debt, it depicts a growing economy. My original link to treasurydirect.gov is the accurate official chronicle of accumulated US debt over time. If the government extracts money from trust funds like highways or social security to spend on general operations, it places a promissory note which will have to be redeemed in the future. When the funds are due for distribution, the government will have to sell general revenue bonds to redeem the intergovernmental bonds - effectively making the original borrowing an official part of the accumulated debt. Or it will have to raise taxes to obtain the funds. Or it will have to sell assets like land or buildings to raise the revenue. Or it will have to cut overall spending to redirect available monies. The $16 trillion of the admitted debt is a drop in the bucket relative to the actual amount of money that has been spent through borrowing.
Your chart depicts the accumulated debt measured against the GDP. A lessened level does not indicate a lower debt, it depicts a growing economy. My original link to treasurydirect.gov is the accurate official chronicle of accumulated US debt over time. If the government extracts money from trust funds like highways or social security to spend on general operations, it places a promissory note which will have to be redeemed in the future. When the funds are due for distribution, the government will have to sell general revenue bonds to redeem the intergovernmental bonds - effectively making the original borrowing an official part of the accumulated debt. Or it will have to raise taxes to obtain the funds. Or it will have to sell assets like land or buildings to raise the revenue. Or it will have to cut overall spending to redirect available monies. The $16 trillion of the admitted debt is a drop in the bucket relative to the actual amount of money that has been spent through borrowing.
Once again, there is more than one measure of the debt. My chart does show some of these debts as a percentage of GDP. However, you can look at the first table at this link to see the actual numbers in current dollars. Following is an excerpt of that table:
                 FEDERAL DEBT AT THE END OF FISCAL YEAR: 1940-2017
                               (billions of dollars)
                                                                              Foreign
                                 Federal   Social            Public deficit   as % of
        Gross   Public  Foreign    Gov't Security Medicare  ----------------   Public
Year     Debt     Debt     Debt Accounts     Debt     Debt    Total  Foreign     Debt
----  -------  -------  ------- -------- -------- --------  -------  -------  -------
1990   3206.3   2411.6    487.1    794.7    214.9    110.2   -220.8    -61.0     20.2
1991   3598.2   2689.0    520.9    909.2    268.4    125.6   -277.4    -33.8     19.4
1992   4001.8   2999.7    576.7   1002.1    319.2    139.2   -310.7    -55.8     19.2
1993   4351.0   3248.4    650.3   1102.6    365.9    149.4   -248.7    -73.6     20.0
1994   4643.3   3433.1    667.3   1210.2    422.7    150.5   -184.7    -17.0     19.4
1995   4920.6   3604.4    835.2   1316.2    483.2    143.4   -171.3   -167.9     23.2
1996   5181.5   3734.1   1102.1   1447.4    549.6    152.3   -129.7   -266.9     29.5
1997   5369.2   3772.3   1241.6   1596.9    630.9    151.2    -38.3   -139.5     32.9
1998   5478.2   3721.1^  1278.7   1757.1    730.3    157.8     51.2    -37.1     34.4
1999   5605.5   3632.4^  1268.7   1973.2    855.0    184.1     88.7     10.0     34.9
2000   5628.7   3409.8^  1015.2   2218.9   1006.9    214.0    222.6    253.5     29.8
2001   5769.9   3319.6^  1040.1   2450.3   1169.8    239.2     90.2    -24.9     31.3
2002   6198.4   3540.4   1235.6   2658.0   1328.9    267.8   -220.8   -195.5     34.9
2003   6760.0   3913.4   1523.1   2846.6   1484.5    275.9   -373.0   -287.5     38.9
2004   7354.7   4295.5   1849.3   3059.1   1635.4    282.0   -382.1   -326.2     43.1
2005   7905.3   4592.2   2033.9   3313.1   1809.0    294.6   -296.7   -184.6     44.3
2006   8451.4   4829.0   2103.1   3622.4   1994.2    336.4   -236.8    -69.2     43.6
2007   8950.7   5035.1   2353.2   3915.6   2180.8    358.5   -206.2   -250.1     46.7
2008   9986.1   5803.1   3077.2   4183.0   2366.4    378.1   -767.9   -724.0     53.0
2009  11875.9   7544.7   3685.1   4331.1   2503.8    371.2  -1741.7   -607.9     48.8
2010  13528.8   9018.9   4435.6   4509.9   2585.5    350.8  -1474.2   -750.5     49.2
2011  14764.2  10128.2   5001.8   4636.0   2653.5    318.5  -1109.3   -566.2     49.4
2012* 16350.9  11578.1            4772.8   2715.4    293.7  -1449.9

* estimated
^ decreasing public debt
As you can see, the gross federal debt is the one that's now close to $16 trillion and it hasn't decreased in any year since 1990 though it came close in 2000, going up just $23.2 billion. However, the debt held by the public (labeled "public debt" above) did go down in 1998 through 2001 (the years marked with ^). There are other measures of the debt. Following is a the last part of a discussion of them from a blog posting titled What is the Real National Debt?:
As far as which of these measures of debt is the "real debt", it seems to me that they all provide some information about our financial state. The smallest one, the debt held by the public, gives a very narrow but concrete view of the effect of the current debt on the credit markets and the largest one, the $53 trillion figure, gives an indication of the future debts we face if we continue to follow current law. Each successive debt from the smallest to the largest generally gives a less concrete but a more inclusive view of the debt. Hence, it seems that we have to consider them all. We need to deal with our current debt at the same time that we lay the framework, as much as possible, to deal with our other rapidly approaching debts.
Thanks for your reply — it’s very informative.
It seems to me that total debt would theoretically be the best figure to use, but only if future liabilities (social security, etc.) were included in the government’s basic accounting.
Disclaimer: Opinions posted on Free Republic are those of the individual posters and do not necessarily represent the opinion of Free Republic or its management. All materials posted herein are protected by copyright law and the exemption for fair use of copyrighted works.