Does anyone know what the difference is between:
(1) the link you posted, http://www.treasurydirect.gov/govt/reports/pd/histdebt/histdebt_histo4.htm, at the Treasury Department, which shows the national debt as never declining during the Clinton years,
and
(2) the CBO page at http://www.cbo.gov/sites/default/files/cbofiles/ftpdocs/108xx/doc10871/historicaltables.pdf, which shows the national debt as declining and the budget balanced during Clinton's tenure.
Overall, the figures are not at all alike in the two tables, so they must be reporting something different. Does anybody know what the two different statistics are that they're reporting here?
The first link shows the "gross federal debt" and the second linkshows the "debt held by the public". These debts are related in that the gross federal debt is equal to the debt held by the public plus "intragovernmental holdings". This intragovernmental debt is chiefly held by trust funds with a bit more than half of it being held by the Social Security trust fund. A list of these trust funds, along with the actual numbers and sources for the graph above can be found at http://www.econdataus.com/debt09.html. I blogged about this difference a few years ago at this link. Following is an updated graph showing the debt:
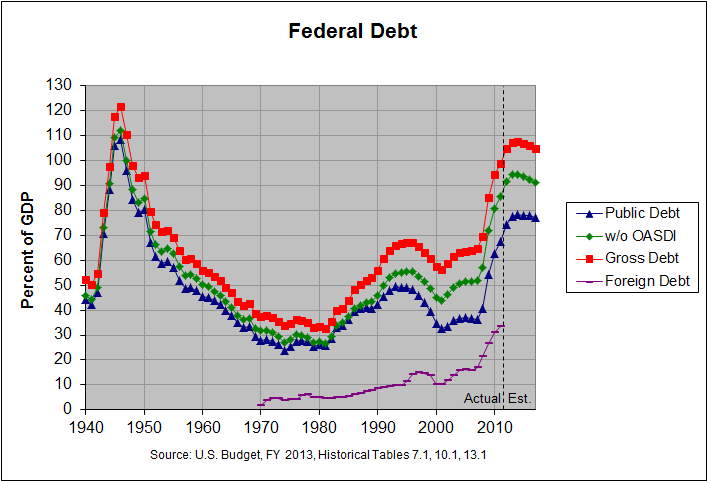
The red line is the gross federal debt and the blue line is the public debt or "debt held by the public". You can find the actual numbers and sources at this link.