Free Republic
Browse · Search
Bloggers & Personal
Topics · Post Article

To: raptor22
Why continue to propagate a fantasy?

Revenues from Clinton-era tax rates were actually used to pay down the national debt and produce four successive budget surpluses.

During the impeached former president's administration, the national debt NEVER went down LINK . . .

09/30/2001 5,807,463,412,200.06
09/30/2000 5,674,178,209,886.86
09/30/1999 5,656,270,901,615.43
09/30/1998 5,526,193,008,897.62
09/30/1997 5,413,146,011,397.34
09/30/1996 5,224,810,939,135.73
09/29/1995 4,973,982,900,709.39
09/30/1994 4,692,749,910,013.32
09/30/1993 4,411,488,883,139.38
09/30/1992 4,064,620,655,521.66
09/30/1991 3,665,303,351,697.03
09/28/1990 3,233,313,451,777.25

2 posted on 12/04/2012 8:18:44 AM PST by Sgt_Schultze (A half-truth is a complete lie)
[ Post Reply | Private Reply | To 1 | View Replies ]


To: Sgt_Schultze

3 posted on 12/04/2012 8:33:53 AM PST by raptor22 (Visit my blog at True Conservatives on Twitter: http://t.co/IKpP3cwq)
[ Post Reply | Private Reply | To 2 | View Replies ]

To: Sgt_Schultze
Does anyone know what the difference is between:

(1) the link you posted, http://www.treasurydirect.gov/govt/reports/pd/histdebt/histdebt_histo4.htm, at the Treasury Department, which shows the national debt as never declining during the Clinton years,

and

(2) the CBO page at http://www.cbo.gov/sites/default/files/cbofiles/ftpdocs/108xx/doc10871/historicaltables.pdf, which shows the national debt as declining and the budget balanced during Clinton's tenure.

Overall, the figures are not at all alike in the two tables, so they must be reporting something different. Does anybody know what the two different statistics are that they're reporting here?
4 posted on 12/04/2012 9:46:48 AM PST by Mitchell
[ Post Reply | Private Reply | To 2 | View Replies ]

To: Sgt_Schultze
Sgt_Schultze wrote:

Why continue to propagate a fantasy? Revenues from Clinton-era tax rates were actually used to pay down the national debt and produce four successive budget surpluses.

During the impeached former president's administration, the national debt NEVER went down LINK . . .

It depends on what you mean by "national debt". As the table at this link shows, the "gross federal debt" never did decline but the "debt held by the public" did decline in 1998, 1999, 2000, and 2001. It can be seen most clearly in the following graph:

Unified, Public, and Gross Budget Deficit: 1970-2017

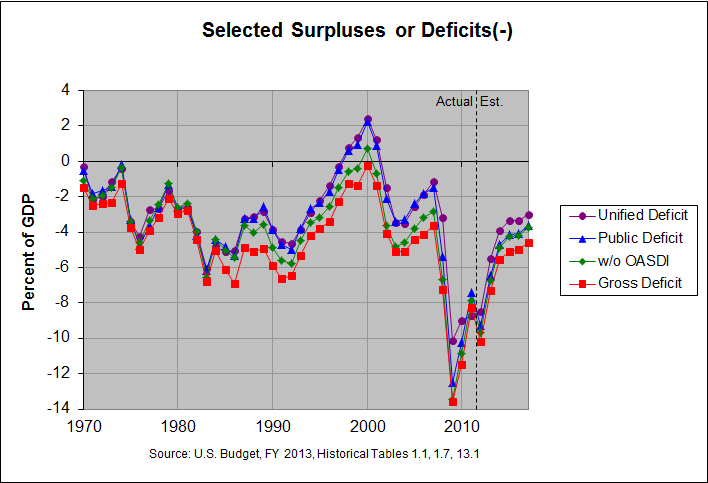
The red line is the "gross federal deficit" and never did reach a surplus though it came close in 2000. However, the purple line is the "unified deficit" and it did reach surplus in 1998 through 2001. You can find the actual numbers and sources for the above graph at this link.

8 posted on 12/04/2012 11:51:09 PM PST by remember
[ Post Reply | Private Reply | To 2 | View Replies ]

Free Republic
Browse · Search
Bloggers & Personal
Topics · Post Article


FreeRepublic, LLC, PO BOX 9771, FRESNO, CA 93794
FreeRepublic.com is powered by software copyright 2000-2008 John Robinson