Skip to comments.
8 Best Universe Atlas/Planetary Exploration Tools
Posted on 01/18/2014 5:36:37 PM PST by lbryce
click here to read article
Navigation: use the links below to view more comments.
first previous 1-20, 21-26 last
To: SunkenCiv
To: lbryce
Cool (Free!) Astronomy-related Software: Please FReepmail other suggestions |
|
- Celestia (MAC/Win/Linux): (GET THIS ONE! -- m_f) A real-time space simulation that lets you experience our universe in three dimensions. Unlike most planetarium software, Celestia doesn't confine you to the surface of the Earth. You can travel throughout the solar system, to any of over 100,000 stars, or even beyond the galaxy. All travel in Celestia is seamless; the exponential zoom feature lets you explore space across a huge range of scales, from galaxy clusters down to spacecraft only a few meters across. A 'point-and-goto' interface makes it simple to navigate through the universe to the object you want to visit.
|
|
- Sky Screen Saver: Shows the sky above any location on Earth, including stars (from the Yale Bright Star Catalogue of more than 9000 stars to the 7th magnitude), the Moon in its correct phase and position in the sky, and the position of the Sun and all the planets in the sky.
Outlines, boundaries, and names of constellations can be displayed, as well as names and Bayer/Flamsteed designations of stars brighter than a given threshold. A database of more than 500 deep-sky objects, including all the Messier objects and bright NGC objects can be plotted to a given magnitude. The ecliptic and celestial equator can be plotted, complete with co-ordinates.
|
|
- Home Planet: A comprehensive astronomy / space / satellite-tracking package for Microsoft Windows 95/98/Me and Windows NT 4.0/2000/XP and above. Selected features:
- An earth map, showing day and night regions, location of the Moon and current phase, and position of a selected earth satellite. Earth maps can be customised and extended.Hposition and phase data for the Sun and Moon.
- Panel showing positions of planets and a selected asteroid or comet, both geocentric and from the observer's location.
- A sky map, based on either the Yale Bright Star Catalogue or the 256,000 star SAO catalogue, including rendering of spectral types, planets, earth satellites, asteroids and comets.
- Databases of the orbital elements of 5632 asteroids and principal periodic comets are included, allowing selection of any for tracking.
- A telescope window which can be aimed by clicking in the sky map or telescope itself, by entering coordinates, or by selecting an object in the Object Catalogue.
- A horizon window which shows the view toward the horizon at any given azimuth.
- Object Catalogue allows archiving images, sounds, and tabular data about celestial objects.
- Orrery allows viewing the solar system, including a selected asteroid or comet, from any vantage point in space, in a variety of projections.
- Satellite tracking panel. Select an Earth satellite from a database of two-line elements, and see its current position and altitude.
- View Earth From panel allows you to view a texture-mapped image of the Earth as seen from the Sun, Moon, a selected Earth satellite, above the observing location, or the antisolar point.
- Satellite database selection allows maintenance of multiple lists of satellites, for example TV broadcast, ham radio, low orbit, etc.
|
|
- Cartes du Ciel Sky Charts: Enables you to draw sky charts, making use of the data in 16 catalogs of stars and nebulae. In addition the position of planets, asteroids and comets are shown.
|
|
- SETI@Home: A scientific experiment that uses Internet-connected computers in the Search for Extraterrestrial Intelligence (SETI). You can participate by running a free program that downloads and analyzes radio telescope data.
|
To: martin_fierro; All
I still like my paper charts.
Skalnate Pleso (I have 4 copies that I have collected over the years), Sky Atlas 2000 and the Tri Atlas Projects printout charts”
http://www.uv.es/jrtorres/triatlas.html
I would highly advise checking his pages out. You can get a lot of detailed charts here, many are much easier to read than the electronic stuff.
I also keep a copy of Burnham’s in my astro box, and an e-copy. The science has moved on, but, the reading is great.
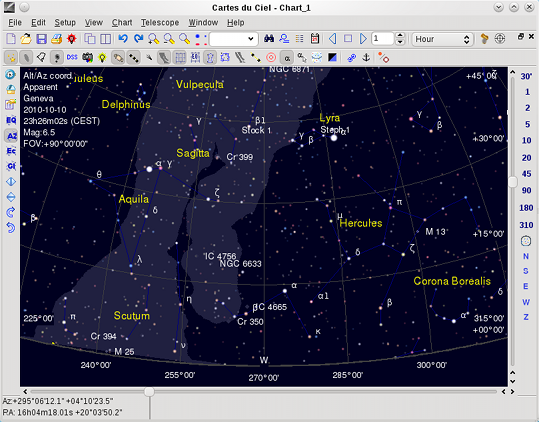
Electronically, I have Cartes du Ceil, Google Sky, Microsoft’s World Wide Telescope, and a an app on my androids called Sky Safari.
http://www.southernstars.com/products/skysafari/
It is by far the best product I have ever seen for astronomy. The added information about most of the brighter objects help a lot.
23
posted on
01/19/2014 7:01:31 PM PST
by
Conan the Librarian
(The Best in Life is to crush my enemies, see them driven before me, and the Dewey Decimal System)
To: lbryce
Ya done good.
Real good.
24
posted on
01/20/2014 10:53:44 AM PST
by
ComputerGuy
(HM2/USN M/3/3 Marines RVN '66-'67)
To: lbryce
Wikisky, Google sky, Google moon, etc are all second hand sources of the data they provide. They tend to contain errors as a result of the processing they undergo to create all-sky or full-planet mosaics, and the image quality suffers greatly due to heavy compression to make it possible to stream the images in realtime. This has lead to countless videos on youtube of people claiming to find “anomalies,” “UFOs,” and even entire “planets” because of these problems. To avoid this you need to download the raw data straight from the primary sources. For Google Sky, Microsoft WWT, Wikisky, and others, this is primarily the Palomar Sky Survey. The scanned plates are collectively referred to as the digitized sky survey. The raw data is available here:
http://archive.stsci.edu/cgi-bin/dss_form
http://archive.stsci.edu/cgi-bin/dss_plate_finder
Other similar resources in other wavelengths of light include the following sites:
http://www.ipac.caltech.edu/2mass/releases/allsky/
http://irsa.ipac.caltech.edu/Missions/iras.html
http://irsa.ipac.caltech.edu/applications/wise/
Here’s a site that provides sort of a 1 stop shop for quick image downloads from just about any all-sky survey in existence. It’s not really quite as good as going to the individual survey and downloading the raw data, it’s more like preview quality in some cases, but if that’s all you need it can sometimes suffice:
http://skyview.gsfc.nasa.gov/current/cgi/query.pl
For planetary mapping there are a wide variety of sources, but again the best principle is to go straight to the source of the data whether it’s NASA, ESA, or JAXA. NASA’s PDS system stores much of the raw data that NASA’s planetary probes collect:
http://pds.nasa.gov/
With regard to the moon, a couple of resources stand out as the best, namely Japan’s Kaguya probe whose data is available here:
https://l2db.selene.darts.isas.jaxa.jp/
And NASA’s LRO whose data is available here:
http://wms.lroc.asu.edu/lroc/
On this last one, the full moon mosaic acts like a preview allowing you to verify the location of the coordinates you have specified before finding any and all narrow angle and wide angle camera images of that area.
Hope this helps. Raw data will generally require specialized programs to view, they’re not just jpegs you can open in photoshop. Much of it will be in FITS format, which is the standard format of most astronomical image data. For FITS images I primarily use PixInsight for handling the images and converting them to standard 8 bit images. You can get that software here:
http://pixinsight.com/
To: lbryce
Google Moon sucks.
The Lunar Reconnaissance Orbiter team have an interactive mapping tool that allows you to zoom in from infinity to look at objects as small as 1 meter across. Use the LROC Quick Map tool here:
LROC QuickMap
26
posted on
01/30/2014 7:45:14 AM PST
by
Cincinatus
(Omnia relinquit servare Rempublicam)
Navigation: use the links below to view more comments.
first previous 1-20, 21-26 last
Disclaimer:
Opinions posted on Free Republic are those of the individual
posters and do not necessarily represent the opinion of Free Republic or its
management. All materials posted herein are protected by copyright law and the
exemption for fair use of copyrighted works.
FreeRepublic.com is powered by software copyright 2000-2008 John Robinson