Skip to comments.
Stock Run-up 3 Weeks Old, Experts Confused-- Investor Thread March 1, 2015
Weekly investment & finance thread ^
| Mar. 1, 2015
| Freeper Investors
Posted on 03/01/2015 5:34:21 AM PST by expat_panama
 [excerpt from Stock-market crash of 2016: The countdown begins] [excerpt from Stock-market crash of 2016: The countdown begins]Dow will drop 50% as market replays 2008, 2000 and 1929. That will translate into the DJIA crashing from today’s 18,117 down 50% to about 9,000. Ouch, the Dow crashing all the way below 10,000. Unimaginable. Bulls will hate it. No wonder our brains tune out, turn off. Instead, we prefer the happy talk that will just keep coming out of Wall Street and Washington till the 2016 collapse. We’ll just keep denying reality ... till it’s too late, and we suffer another $10 trillion loss is on the books.
Deja vu 2000: irrational exuberance, dot-com technologies
Remember 1999. Just 16 years ago. Roaring hot “irrational exuberance.” Renewed stock market mania. Wall Street was hot. Stocks roaring. Back then investors demanded insane annual returns during the worldwide millennium celebrations: the top 19 mutual funds had 179% to 323% annual returns.
Yes, dot-com stockholders expected 100% plus returns on zero revenues...
[snip]
...Deja vu the Crash of 1929: and the long Great Depression...
[snip]
...Yikes, it took 13 long years to break even from Wall Street’s losses of 2000 and 2008. And now investors are being warned that the Crash of 2016 will be even worse, with new losses of 50%. In short, the market really is bad news.
But still, here we are again, panicking: Fearing that 2016 will repeat 1929, fearing that Wall Street and Main Street, tens of millions of Americans, plus the Fed, the SEC, Washington politicians in both parties will refuse to prepare for the Crash of 2016. Will deny hearing the warnings ... of the Crash of 2016, one that promises in the end to become bigger and badder and far more dangerous than 2008, 1999 and 1929 combined. Listen closely, the countdown to the Crash of 2016 has started. |
|
 [excerpt from Barron's rebuttal Considering the ‘Stock Market Crash of 2016’] [excerpt from Barron's rebuttal Considering the ‘Stock Market Crash of 2016’]DI’ll give veteran MarketWatch columnist Paul B. Farrell his due: The man knows how to draw clicks.
It’s hard to avoid an article with the headline: “Stock Market Crash of 2016: The Countdown Begins.”
While many seasoned consumers of financial journalism might be inclined to dismiss an article with such a bombastic headline right off the bat, I’m always willing to at least consider the arguments behind such a claim.
If such a crash is a year off, it’s important to start preparing. A 50% decline in stock-market value is a sharper drop than we endured in 2008.
Fortunately for long investors everywhere, there is little about the article that should send anyone cashing out of stocks...
[snip]
...The bigger issue on trial here is the idea that investors should make big asset bets based on bold market forecasts, whether by professional money managers or journalists....
[snip]
...“Sure, they suffered steep losses (and likely lost some serious sleep) as stocks cratered during the financial crisis,” Egan writes. “Yet they also enjoyed a dramatic rebound in U.S. stocks as the system stabilized. The S&P 500 is up over 200% since the bottoming out in March 2009.”
He adds that it may be tempting to stay on the sidelines. However, holding too much cash for fear of a market crash will almost certainly cause you to miss extended periods when markets perform well.
|
 More precision confusion from experienced professionals:
* * * * * * * * * * * * * * * * * *
TOPICS: Business/Economy; Government; News/Current Events
KEYWORDS: economy; financial; stockmarket; wallstreet
Navigation: use the links below to view more comments.
first previous 1-20, 21-40, 41-60, 61-80, 81-86 next last
To: abb
"...looks to him like it’s going up higher."
To: 1010RD; A Cyrenian; abb; Abigail Adams; abigail2; AK_47_7.62x39; Aliska; aposiopetic; Aquamarine; ..

Good Morning (--or maybe early afternoon) a late start with this already--
| Date |
Time (ET) |
Statistic |
Actual |
Briefing Forecast |
Market Expects |
Prior |
Revised From |
| 5-Mar |
7:30 AM |
Challenger Job Cuts |
20.90% |
NA |
NA |
17.60% |
- |
| 5-Mar |
8:30 AM |
Initial Claims |
320K |
300K |
295K |
313K |
- |
| 5-Mar |
8:30 AM |
Continuing Claims |
2421K |
2400K |
2404K |
2404K |
2401K |
| 5-Mar |
8:30 AM |
Productivity-Rev. |
-2.20% |
-1.60% |
-2.30% |
-1.80% |
- |
| 5-Mar |
8:30 AM |
Unit Labor Costs -Rev |
4.10% |
|
|
|
|
--and later we get Factory Orders and Natural Gas Inventories. Stock futures are up and climbing seeing indexes +0.26 and metals +0.21% although those are right now trading off a bit w/ gold $1,200.65 and silver $16.25. Yesterday's stocks were an S&P500 distribution day but the thinking is that we still got a lot of momentum left....
To: Wyatt's Torch; abb; Lurkina.n.Learnin; All
Noticed that productivity's been falling a couple months now so I checked:
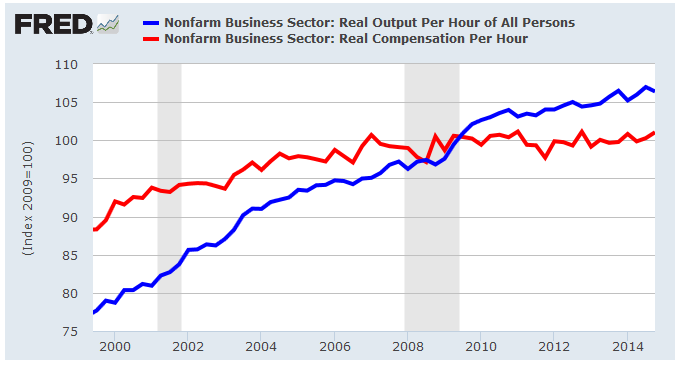
Nobody's talking about it but before '07 when the U.S. got taken over by the professional victims we had climbing real wages along with climbing output. Since then we've seen output stalling and the beginnings of a wage crunch. My bet is in further wage cuts.
To: expat_panama; Wyatt's Torch; Lurkina.n.Learnin
http://www.wsj.com/articles/oil-glut-sparks-latest-dilemma-where-to-put-it-all-1425577673?mod=WSJ_hpp_MIDDLENexttoWhatsNewsThird
Oil Glut Sparks Latest Dilemma: Where to Put It All
As storage tanks near capacity, some predict spillover will send crude prices even lower
By Nicole Friedman
Updated March 5, 2015 3:17 p.m. ET
In a world awash in crude, oil producers and traders are facing a billion-barrel conundrum: where to put it all.
U.S. crude-oil supplies are at their highest level in more 80 years, according to data from the Energy Information Administration, equal to nearly 70% of the nation’s storage capacity. A key U.S. storage hub in Cushing, Okla., is expected to hit maximum capacity this spring. While estimates are rough, Citigroup Inc. believes European commercial crude storage could be more than 90% full, and inventories in South Korea, South Africa and Japan could be at more than 80% of capacity.
The danger of running out of places to stash crude: Some analysts predict prices, already down 50% since June, could spiral even lower as producers sell oil at a discount to the few remaining buyers with room to store it. Consumers, though, would continue to be big winners as refineries convert an ocean of crude into gasoline and other fuels.
snip
64
posted on
03/05/2015 1:25:29 PM PST
by
abb
("News reporting is too important to be left to the journalists." Walter Abbott (1950 -))
To: abb
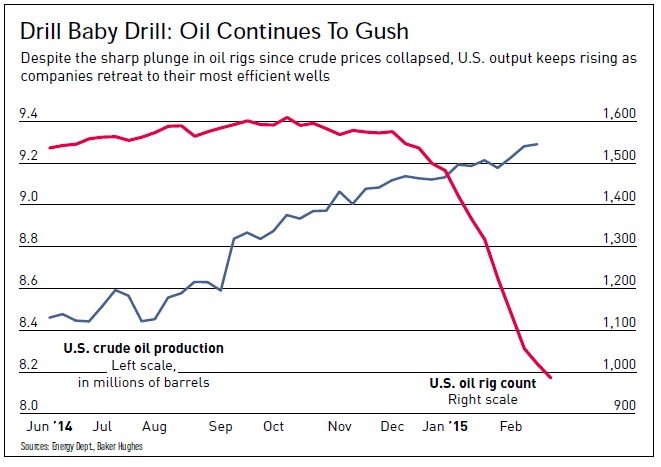
Here’s what I don’t get. The production level hasn’t grown that much in the last 6 months when the price started to fall. Why isn’t it being absorbed through demand particularly at lower energy costs?
To: Wyatt's Torch
I think this is the formula that applies. You’re probably more up to speed on this, than am I. Been a while since Econ 301.
http://www.tutor2u.net/economics/content/topics/elasticity/elastic.htm
If the PED is less than one, the good is inelastic. Demand is not very responsive to changes in price. If for example a 20% increase in price leads to a 5% fall in quantity demanded, the price elasticity = 0.25
Factors that determine the value of price elasticity of demand
1. Number of close substitutes within the market - The more (and closer) substitutes available in the market the more elastic demand will be in response to a change in price. In this case, the substitution effect will be quite strong.
2. Luxuries and necessities - Necessities tend to have a more inelastic demand curve, whereas luxury goods and services tend to be more elastic. For example, the demand for opera tickets is more elastic than the demand for urban rail travel. The demand for vacation air travel is more elastic than the demand for business air travel.
3. Percentage of income spent on a good - It may be the case that the smaller the proportion of income spent taken up with purchasing the good or service the more inelastic demand will be.
4. Habit forming goods - Goods such as cigarettes and drugs tend to be inelastic in demand. Preferences are such that habitual consumers of certain products become de-sensitised to price changes.
5. Time period under consideration - Demand tends to be more elastic in the long run rather than in the short run. For example, after the two world oil price shocks of the 1970s - the “response” to higher oil prices was modest in the immediate period after price increases, but as time passed, people found ways to consume less petroleum and other oil products. This included measures to get better mileage from their cars; higher spending on insulation in homes and car pooling for commuters. The demand for oil became more elastic in the long-run.
66
posted on
03/05/2015 1:59:19 PM PST
by
abb
("News reporting is too important to be left to the journalists." Walter Abbott (1950 -))
To: Wyatt's Torch; abb
production level hasn’t grown that much in the last 6 months According to IBD's data mining with the Energy Dept. production's been continuously increasing:
To: Lurkina.n.Learnin
Nice find. Imagine what our rating would be if Obama’s people weren’t in charge.
68
posted on
03/05/2015 8:49:03 PM PST
by
1010RD
(First, Do No Harm)
To: 1010RD; A Cyrenian; abb; Abigail Adams; abigail2; AK_47_7.62x39; Aliska; aposiopetic; Aquamarine; ..
Happy Friday! Futures traders have metals dropping 0.39% (long-standing base is failing) and stocks flat/off at -0.06%. Ending the week with a big report stack this morning:
Nonfarm Payrolls
Nonfarm Private Payrolls
Unemployment Rate
Hourly Earnings
Average Workweek
Trade Balance
Consumer Credit
To: expat_panama
To: expat_panama
Back that up a bit (or change the scale). 8.4 million barrels per day to 9.2 million is a 10%ish increase. Not enough to drive a 50% decrease in WTI and a 35% decrease in rig counts. I still wonder why now. Best answer I have is bubbles pop they don’t deflate...
To: expat_panama
Here’s my prediction for NFP - “Weather”
:-)
To: expat_panama
To: expat_panama
To: expat_panama
Labor Force fell 178K driving the U3 downward
To: expat_panama
To: Wyatt's Torch
Janet Yellen was spotted in a mad rush to raise rates. ;^)
77
posted on
03/06/2015 5:37:47 AM PST
by
Lurkina.n.Learnin
(It's a shame nobama truly doesn't care about any of this. Our country, our future, he doesn't care)
To: expat_panama
Apple to replace AT%T in the DOW.
78
posted on
03/06/2015 6:00:44 AM PST
by
Lurkina.n.Learnin
(It's a shame nobama truly doesn't care about any of this. Our country, our future, he doesn't care)
To: Lurkina.n.Learnin
To: Wyatt's Torch
a 10%ish increase. Not enough to drive a 50% decrease in WTI and a 35% decrease in rig counts.Maybe it was. Oil markets are notoriously inelastic both in supply and demand so a 10% unneeded increase will go right into very expensive storage. That expense will force the dumping of the stock pile even below cost as dealers cut their losses. What raised my eyebrow was the extreme differences in rig production that could permit so many shutdowns. We're also seeing an accelerated increase in the efficiency of the remaining wells that account for production boosts.
We're agreeing that the price is falling, that production is up, and rigs are being shut down. That's the "what" that we agree on. The "whys" I'm offering here are conjecture. OK, so they're learned, expert, and brilliant but I'll confess they're still just conjecture.
Navigation: use the links below to view more comments.
first previous 1-20, 21-40, 41-60, 61-80, 81-86 next last
Disclaimer:
Opinions posted on Free Republic are those of the individual
posters and do not necessarily represent the opinion of Free Republic or its
management. All materials posted herein are protected by copyright law and the
exemption for fair use of copyrighted works.
FreeRepublic.com is powered by software copyright 2000-2008 John Robinson