Posted on 10/25/2014 10:11:11 AM PDT by 2ndDivisionVet
A string of leaks to the media protecting Darren Wilson are part of a very big problem. Here's the sordid history.
On those rare occasions when it makes a real effort to grapple with the raw brutality of Jim Crow, the American mainstream media usually returns to a particular set of images that, by their very nature, are jarring and extraordinary: the burning cross, the hangman’s knot, the Klansman on horseback. This isn’t a bad thing; you can’t understand Jim Crow without understanding the significance of the Klan, for example. But it’s not an entirely good one, either.
The problem with focusing so much on these potent symbols is that it can lead us to a mistaken conclusion: namely, that the only evil of Jim Crow (and U.S. white supremacy in general) was manifested in these menacing, otherworldly forms, rather than in the system’s more humdrum and everyday modes of dehumanization. The problem with the former is easily solved. Today, the burning cross, the noose and the Klansman are all enemies of polite society. But those subtler manifestations of apartheid — the interlocking social networks and political institutions that together worked to disempower black citizens and deny them their rightful place as full members of the community — have proven more difficult to shake.
The proof is all around us, but if you want a more tangible example, the news out of Ferguson, Missouri, is happy to oblige....
![]()
The author
(Excerpt) Read more at salon.com ...

I remember seeing that idiot(forgot his name) in the beard on a video. He was saying “how he HATES every iota of a cracker”
I wish I were there I tell him then he hates Obama cause he’s half a cracker!
He'd look more like Frank Sinatra ...
there is no apartheid in America. America is a caucasian country, founded by europeans, not a majority-black African state with colonialists.
Tom-May-To, Tom-Mah-To to these people, as I’m sure you know.
| I am not trying to make this a racial thing.. |
|
Police Behavior during Traffic and Street Stops, 2011
Traffic stops
About 71% of persons involved in streets stops thought the police behaved properly, compared to 88% of drivers pulled over in traffic stopsIn 2011, less than 1% of the 241.4 million U.S. residents age 16 or older were involved in a street stop during their most recent contact with police (table 1; appendix table 2). A greater percentage of males (1%) than females (less than 1%) were involved in street stops during 2011. Persons ages 16 to 24 were more likely than persons age 35 or older to be involved in street stops. While no differences were observed in the percentage of non-Hispanic white, non-Hispanic black, and Hispanic populations age 16 or older involved in a street stop, among those who were stopped, a smaller percentage of blacks (38%) than Hispanics (63%) or whites (78%) felt the police behaved properly during the stop.
Traffic stops were a more common form of police contact than street stops in 2011. About 10% of the 212.3 million U.S. drivers age 16 or older were stopped while operating a motor vehicle during their most recent contact with police.1 As with street stops, a greater percentage of male drivers (12%) than female drivers (8%) were pulled over in traffic stops. Across age groups, the highest percentage of stopped drivers was among drivers ages 18 to 24 (18%). A higher percentage of black drivers (13%) than white (10%) and Hispanic (10%) drivers age 16 or older were pulled over in a traffic stop during their most recent contact with police.
A higher percentage of drivers in traffic stops (88%) than persons involved in street stops (71%) believed the police behaved properly during the stop. White drivers pulled over by police (89%) were more likely than black drivers (83%) to think that the police behaved properly, while no difference was observed between the percentages of stopped white drivers and Hispanic drivers who thought that the police behaved properly. There was also no statistical difference in the percentages of black and Hispanic stopped drivers who believed the police behaved properly.
| Street stopsa | Traffic stopsb | |||||||||
|---|---|---|---|---|---|---|---|---|---|---|
| Percent of stopped persons |
Percent of stopped drivers |
|||||||||
| Demographic characteristics |
Percent of all persons |
Total | Police behaved properlyd |
Percent of all driversc |
Total | Police behaved properlyd |
||||
| Total | 0.6% | 100% | 70.7% | 10.2% | 100% | 88.2% | ||||
| Sex | ||||||||||
| Male | 0.8% | 67.5% | 69.8% | 11.9% | 58.8% | 86.9% | ||||
| Female | 0.4 | 32.5 | 72.7 | 8.4 | 41.2 | 89.9 | ||||
| Race/Hispanic origin | ||||||||||
| Whitee | 0.6% | 65.2% | 77.6% | 9.8% | 69.3% | 89.4% | ||||
| Black/African Americane | 0.6 | 12.4 | 37.7 ! | 12.8 | 12.6 | 82.7 | ||||
| Hispanic/Latino | 0.7 | 15.3 | 62.9 | 10.4 | 12.2 | 86.5 | ||||
| American Indian/Alaska Nativee | 0.5 ! | 0.6 ! | 100 ! | 15.0 | 0.6 | 74.2 | ||||
| Asian/Native Hawaiian/other Pacific Islandere | 0.4 ! | 3.6 ! | 85.0 ! | 9.4 | 4.0 | 89.5 | ||||
| Two or more racese | 1.8 ! | 3.1 ! | 76.6 ! | 13.4 | 1.3 | 94.8 | ||||
| Age | ||||||||||
| 16–17 | 1.5% | 8.5% | 67.4% | 9.0% | 1.8% | 92.3% | ||||
| 18–24 | 1.6 | 31.7 | 72.1 | 17.8 | 19.5 | 85.1 | ||||
| 25–34 | 0.9 | 27.1 | 64.4 | 12.7 | 22.4 | 88.1 | ||||
| 35–44 | 0.4 | 10.6 | 81.6 | 11.3 | 19.8 | 87.9 | ||||
| 45–54 | 0.4 | 10.9 | 79.7 | 9.4 | 17.9 | 88.7 | ||||
| 55–64 | 0.2 | 5.5 | 62.2 ! | 7.1 | 11.4 | 89.7 | ||||
| 65 or older | 0.2 | 5.7 | 68.8 ! | 4.8 | 7.2 | 92.3 | ||||
Note: See appendix table 2 for estimates of the U.S. population and driving population age 16 or older and appendix table 3 for standard errors.
Source: Bureau of Justice Statistics, National Crime Victimization Survey, Police-Public Contact Survey, 2011.
The FBI and other sources of homicide by law enforcement figures below include the majority of all police departments.
The point of this reply is to point out that whites are the most likely to die while being arrested.
The Obama-Holder U.S. Dept. Just Us and the race-grievance industry will of course exploit all shootings to the max vis-a-vis race more than any concern for the poor victim.
The ARD data show that whites are more likely to die while being arrested and IMO there is no doubt that some of those deaths were the intention of the police.
But the main point is I bet that policemen don't care about race compared to protecting themselves from being killed or maimed.
And what about Ms Carey the unarmed, young black woman chased, surrounded and gunned down by federal agents in D.C.? Where's the Obama-Holder U.S. Dept. Just Us and the race-grievance industry caring about her and her baby?
Arrest-Related Deaths, 2003-2009 - Statistical Tables
"From 2003 through 2009, a total of 4,813 deaths were reported to the Bureau of Justice Statistics’ (BJS) Arrest-Related Deaths (ARD) program."
Of these, about 6 in 10 deaths (2,931) were classified as homicide by law enforcement personnel, and 4 in 10 (1,882) were attributed to other manners of death.
Table 1 Number of reported arrest-related deaths, by manner of death, 2003-2009
| Manner of death | 2003-2009 | 2003 | 2004 | 2005 | 2006 | 2007 | 2008 | 2009 |
|---|---|---|---|---|---|---|---|---|
| All manners | 4,813 | 627 | 673 | 689 | 721 | 745 | 629 | 729 |
| Homicide —by law enforcement | 2,931 | 376 | 375 | 377 | 447 | 455 | 404 | 497 |
| by other persons | 27 | 3 | 4 | 4 | 2 | 7 | 3 | 4 |
| Suicide | 541 | 60 | 84 | 82 | 67 | 78 | 76 | 94 |
| Intoxication | 525 | 83 | 83 | 90 | 76 | 89 | 54 | 50 |
| Accidental injury | 272 | 53 | 41 | 47 | 39 | 35 | 28 | 29 |
| Natural causes | 244 | 26 | 46 | 32 | 34 | 42 | 33 | 31 |
| Unknown | 273 | 26 | 40 | 57 | 56 | 39 | 31 | 24 |
Note: Due to variation in reporting, caution should be used in comparing counts from year to year. See Methodology for information on missing data by state for each year. Counts may differ from previous publication due to additional information.
Table 5 Number of reported arrest-related deaths, by manner of death and demographic characteristics, 2003-2009
| Demographic characteristics |
All manners | Homicide | Suicide | Intoxication | Accident | Natural causes | Unknown |
|---|---|---|---|---|---|---|---|
| Total | 4,813 | 2,958 | 541 | 525 | 272 | 244 | 273 |
| Sex | |||||||
| Male | 4,594 | 2,851 | 517 | 490 | 259 | 218 | 259 |
| Female | 218 | 107 | 24 | 35 | 13 | 26 | 13 |
| Unknown | 1 | 0 | 0 | 0 | 0 | 0 | 1 |
| Race/Hispanic origin | |||||||
| White, non-Hispanic | 2,026 | 1,233 | 327 | 178 | 95 | 110 | 83 |
| Black, non-Hispanic | 1,529 | 937 | 80 | 217 | 111 | 85 | 99 |
| Hispanic | 949 | 599 | 110 | 109 | 55 | 29 | 47 |
| Other* | 150 | 107 | 12 | 17 | 4 | 4 | 6 |
| Unknown | 159 | 82 | 12 | 4 | 7 | 16 | 38 |
| Age | |||||||
| 17 or younger | 127 | 99 | 6 | 5 | 13 | 0 | 4 |
| 18-24 | 909 | 685 | 80 | 53 | 54 | 10 | 27 |
| 25-34 | 1,391 | 893 | 140 | 177 | 65 | 41 | 75 |
| 35-44 | 1,238 | 658 | 159 | 190 | 78 | 66 | 87 |
| 45-54 | 752 | 390 | 105 | 84 | 45 | 75 | 53 |
| 55 or older | 317 | 188 | 44 | 11 | 12 | 52 | 10 |
| Unknown | 79 | 45 | 7 | 5 | 5 | 0 | 17 |
To me this shows that it is not a racial thing. It happens to all races. These figures however do not show those thought "murdered" by police. I have not yet located data for recent years. Why can't I find data for recent years? I do not know.. maybe the Dept of Just Us and Race-Grievance Industry don't want it known that whites are the most likely to die being arrested.
| 2003 | 2004 | 2005 | 2006 | 2007 | ||||||||
|---|---|---|---|---|---|---|---|---|---|---|---|---|
| Time | Total | Percent distribution | Total | Percent distribution | Total | Percent distribution | Total | Percent distribution | Total | Percent distribution | Total | Percent distribution |
| Number of victim officers | 581,239 | 100.0 | 58,600 | 100.0 | 59,692 | 100.0 | 57,820 | 100.0 | 59,396 | 100.0 | 61,257 | 100.0 |
| Total A.M. hours | 235,253 | 40.5 | 24,018 | 41.0 | 24,355 | 40.8 | 23,070 | 39.9 | 23,964 | 40.3 | 24,488 | 40.0 |
| 12:01 a.m.–2 a.m. | 88,637 | 15.2 | 8,924 | 15.2 | 8,932 | 15.0 | 8,325 | 14.4 | 8,823 | 14.9 | 9,318 | 15.2 |
| 2:01 a.m.–4 a.m. | 55,521 | 9.6 | 5,604 | 9.6 | 5,781 | 9.7 | 5,438 | 9.4 | 5,505 | 9.3 | 5,862 | 9.6 |
| 4:01 a.m.–6 a.m. | 21,074 | 3.6 | 2,288 | 3.9 | 2,183 | 3.7 | 2,048 | 3.5 | 2,169 | 3.7 | 2,157 | 3.5 |
| 6:01 a.m.–8 a.m. | 14,846 | 2.6 | 1,569 | 2.7 | 1,626 | 2.7 | 1,549 | 2.7 | 1,548 | 2.6 | 1,476 | 2.4 |
| 8:01 a.m.–10 a.m. | 23,947 | 4.1 | 2,434 | 4.2 | 2,589 | 4.3 | 2,518 | 4.4 | 2,621 | 4.4 | 2,489 | 4.1 |
| 10:01 a.m.–Noon | 31,228 | 5.4 | 3,199 | 5.5 | 3,244 | 5.4 | 3,192 | 5.5 | 3,298 | 5.6 | 3,186 | 5.2 |
| Total P.M. hours | 345,986 | 59.5 | 34,582 | 59.0 | 35,337 | 59.2 | 34,750 | 60.1 | 35,432 | 59.7 | 36,769 | 60.0 |
| 12:01 p.m.–2 p.m. | 34,909 | 6.0 | 3,567 | 6.1 | 3,627 | 6.1 | 3,532 | 6.1 | 3,599 | 6.1 | 3,659 | 6.0 |
| 2:01 p.m.–4 p.m. | 43,148 | 7.4 | 4,368 | 7.5 | 4,500 | 7.5 | 4,268 | 7.4 | 4,508 | 7.6 | 4,464 | 7.3 |
| 4:01 p.m.–6 p.m. | 51,962 | 8.9 | 5,197 | 8.9 | 5,305 | 8.9 | 5,366 | 9.3 | 5,307 | 8.9 | 5,573 | 9.1 |
| 6:01 p.m.–8 p.m. | 61,826 | 10.6 | 6,408 | 10.9 | 6,067 | 10.2 | 6,160 | 10.7 | 6,309 | 10.6 | 6,372 | 10.4 |
| 8:01 p.m.–10 p.m. | 73,304 | 12.6 | 7,397 | 12.6 | 7,570 | 12.7 | 7,276 | 12.6 | 7,487 | 12.6 | 7,825 | 12.8 |
| 10:01 p.m.–Midnight | 80,837 | 13.9 | 7,645 | 13.0 | 8,268 | 13.9 | 8,148 | 14.1 | 8,222 | 13.8 | 8,876 | 14.5 |
| 2008 | 2009 | 2010 | 2011 | 2012 | ||||||
|---|---|---|---|---|---|---|---|---|---|---|
| Time | Total | Percent distribution | Total | Percent distribution | Total | Percent distribution | Total | Percent distribution | Total | Percent distribution |
| Number of victim officers | 61,087 | 100.0 | 58,364 | 100.0 | 56,491 | 100.0 | 55,631 | 100.0 | 52,901 | 100.0 |
| Total A.M. hours | 24,637 | 40.3 | 23,586 | 40.4 | 22,807 | 40.4 | 22,703 | 40.8 | 21,625 | 40.9 |
| 12:01 a.m.–2 a.m. | 9,585 | 15.7 | 9,323 | 16.0 | 8,829 | 15.6 | 8,555 | 15.4 | 8,023 | 15.2 |
| 2:01 a.m.–4 a.m. | 5,879 | 9.6 | 5,653 | 9.7 | 5,390 | 9.5 | 5,293 | 9.5 | 5,116 | 9.7 |
| 4:01 a.m.–6 a.m. | 2,114 | 3.5 | 2,082 | 3.6 | 1,987 | 3.5 | 2,126 | 3.8 | 1,920 | 3.6 |
| 6:01 a.m.–8 a.m. | 1,480 | 2.4 | 1,389 | 2.4 | 1,428 | 2.5 | 1,438 | 2.6 | 1,343 | 2.5 |
| 8:01 a.m.–10 a.m. | 2,376 | 3.9 | 2,192 | 3.8 | 2,291 | 4.1 | 2,213 | 4.0 | 2,224 | 4.2 |
| 10:01 a.m.–Noon | 3,203 | 5.2 | 2,947 | 5.0 | 2,882 | 5.1 | 3,078 | 5.5 | 2,999 | 5.7 |
| Total P.M. hours | 36,450 | 59.7 | 34,778 | 59.6 | 33,684 | 59.6 | 32,928 | 59.2 | 31,276 | 59.1 |
| 12:01 p.m.–2 p.m. | 3,558 | 5.8 | 3,414 | 5.8 | 3,307 | 5.9 | 3,297 | 5.9 | 3,349 | 6.3 |
| 2:01 p.m.–4 p.m. | 4,286 | 7.0 | 4,232 | 7.3 | 4,361 | 7.7 | 4,145 | 7.5 | 4,016 | 7.6 |
| 4:01 p.m.–6 p.m. | 5,274 | 8.6 | 5,315 | 9.1 | 5,045 | 8.9 | 4,826 | 8.7 | 4,754 | 9.0 |
| 6:01 p.m.–8 p.m. | 6,611 | 10.8 | 6,269 | 10.7 | 6,088 | 10.8 | 6,032 | 10.8 | 5,510 | 10.4 |
| 8:01 p.m.–10 p.m. | 7,853 | 12.9 | 7,337 | 12.6 | 7,195 | 12.7 | 6,808 | 12.2 | 6,556 | 12.4 |
| 10:01 p.m.–Midnight | 8,868 | 14.5 | 8,211 | 14.1 | 7,688 | 13.6 | 7,820 | 14.1 | 7,091 | 13.4 |
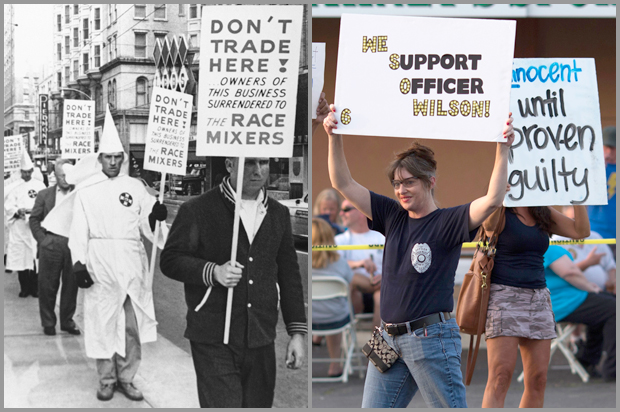
YELLOW JOURNALISMIn the photo with the article the Ku Klux Klan is juxtaposed with the white, peaceful, pro-Officer Wilson demonstrators.
Have you see a similar photo of the Black Panthers juxtaposed with the black pro-Michael Willson demonstrators?
The answer is a resounding NO!
That is Billy Bob Thornton, same movie but he wasn’t the faggot, I think it was Scott Ritter?
Disclaimer: Opinions posted on Free Republic are those of the individual posters and do not necessarily represent the opinion of Free Republic or its management. All materials posted herein are protected by copyright law and the exemption for fair use of copyrighted works.