2 years of hard facts is not the same as 30 years of hard facts.
And of course nobody can dispute the possibility that the last 2 years is the beginning of a new 30 year trend that results in 2040 having the same amount of ice as there was in 1980
2 years of hard facts is not the same as 30 years of hard facts.
And of course nobody can dispute the possibility that the last 2 years is the beginning of a new 30 year trend that results in 2040 having the same amount of ice as there was in 1980
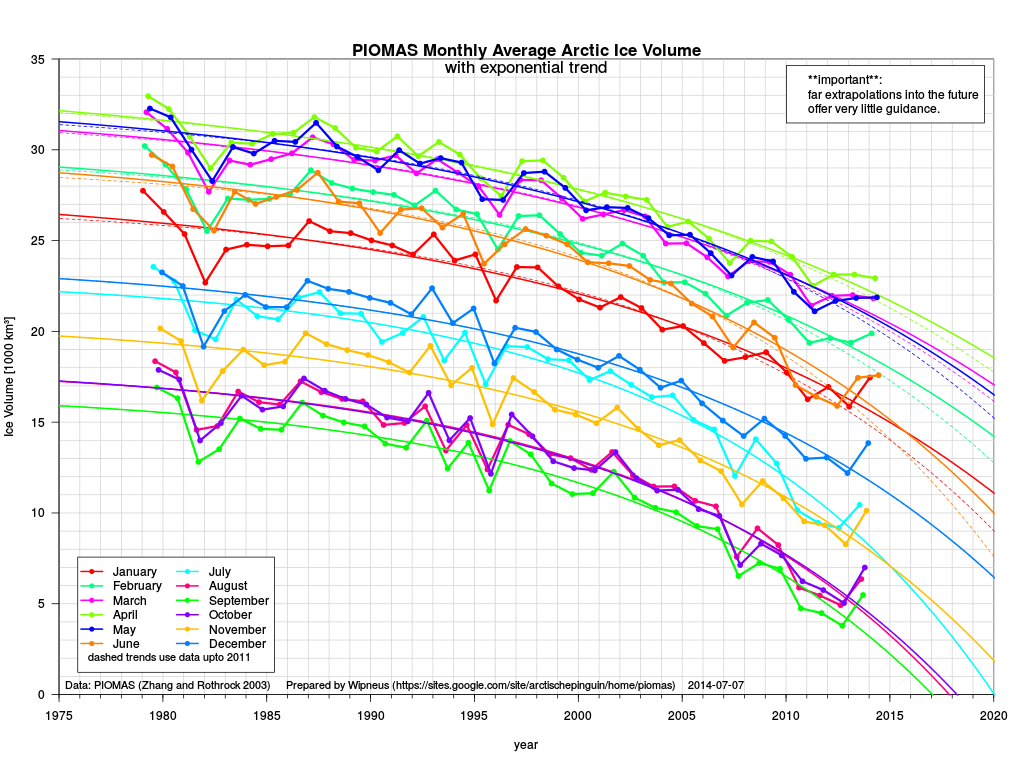
PIOMAS is an inaccurate model, not a direct relation to physical data.
Your graph still doesn’t change the point I am making. That Obama says he is going to take unilateral action on the scam of global warming with the UN (changed to climate change when the public caught on to the hoax—so now any change in the weather fits into the narrative) whose affects are alleged to occur 50-100 years out into the future before he has a strategy to address the current threat of Islamic terrorists wanting to carry out imminent attacks in the US is just mind-boggling.
He vacations, golfs, attends fund-raisers and lefty weddings instead of using that time to do his job. If issues like immigration reform are so important, why isn’t he up on Capitol Hill working with the Congress and on the phone with legislative leaders hammering out bills to address this and other issues? Why is it that he claims Congress is do dysfunctional and yet he is a no-show in trying to get them to do his bidding? He doesn’t even try. Even many democRATS in Congress say he hasn’t talked to them for over a year. He takes every opportunity publicly to discredit Republicans and call them names, and yet expects them to step up and take care of his wish list.
The point is that Obama is not a leader. He dithers in the accouterments and benefits of being president, but doesn’t actually put forth serious efforts to do his real job as the chief executive. When he does engage in policies, it is to unilaterally deal with issues, like this unlawful climate change deal with the UN, that are not important or pressing to the safety and security of the nation and its people, the single responsibility he has under the US Constitution to take care of.
What evidence do we have that a 30 year trend is significant? Climate trends can be FAR longer in nature.
An ice-ocean model, like PIOMAS, is much more accurate at hindcasts, when the atmospheric conditions are simply reconstructed from observations, than for forecasts, when atmospheric conditions must be estimated. That is not to say that PIOMAS can’t be used for predictions, it can (Zhang et al. 2008, Lindsay et al. 2008 , Zhang et al. 2010) but it is important to recognize that performance at hindcasts does not necessarily say much about performance at forecasts. This point often gets confused. - See more at: http://www.realclimate.org/index.php/archives/2012/04/arctic-sea-ice-volume-piomas-prediction-and-the-perils-of-extrapolation/#sthash.PgQOWJul.dpufn ice-ocean model, like PIOMAS, is much more accurate at hindcasts, when the atmospheric conditions are simply reconstructed from observations, than for forecasts, when atmospheric conditions must be estimated. That is not to say that PIOMAS can’t be used for predictions, it can (Zhang et al. 2008, Lindsay et al. 2008 , Zhang et al. 2010) but it is important to recognize that performance at hindcasts does not necessarily say much about performance at forecasts. This point often gets confused. - See more at: http://www.realclimate.org/index.php/archives/2012/04/arctic-sea-ice-volume-piomas-prediction-and-the-perils-of-extrapolation/#sthash.PgQOWJul.dpuf
2 years of hard facts is not the same as 30 years of hard facts.
And of course nobody can dispute the possibility that the last 2 years is the beginning of a new 30 year trend that results in 2040 having the same amount of ice as there was in 1980
And it can all be in how you draw the data presented. The same 30 years
Your curved line chart looks far scarier than the actual data from the Danish Ice tracking folks -

And you could almost interpret the last few years an an uptick, not and exponential decline...:^)
http://arctic-roos.org/