Skip to comments.
400 PPM: Carbon Dioxide in the Atmosphere Reaches Prehistoric Levels
Scientific American ^
| May 9, 2013
| David Biello
Posted on 03/19/2014 6:15:30 AM PDT by Mrs. Don-o
400 PPM: What’s Next for a Warming Planet Concentrations of greenhouse gases in the atmosphere have reached this level for the first time in millions of years. What does this portend? »
On May 2, after nightfall shut down photosynthesis for the day in Hawaii, carbon dioxide levels in the atmosphere touched 400 parts-per-million there for the first time in at least 800,000 years. Near the summit of volcanic Mauna Loa—where a member of the Keeling family has kept watch since 1958—sensors measured this record through sunrise the following day. Levels have continued to dance near that benchmark in recent days, registering above 400 ppm for the first time in eons after midnight on May 7. When the measurements started the daily average could be as low as 315 ppm, already up from a pre-industrial average of around 280 ppm.
This measurement is just the hourly average of CO2 levels high in the Hawaiian sky, but this family’s figures carry more weight than those made at other stations in the world as they have faithfully kept the longest record of atmospheric CO2. Arctic weather stations also hit the hourly 400 ppm mark last spring and this one. Regardless, the hourly levels at Mauna Loa will soon drop as spring kicks in across the northern hemisphere, trees budding forth an army of leaves hungrily sucking CO2 out of the sky. 5-2-5-7-2013-mauna-loa
Courtesy of Scripps Institution of Oceanography
It may be next year before the monthly average level reaches 400 ppm—and yet longer still until the annual average reaches that number.
But there is no question that the world continues to inexorably climb toward higher levels of greenhouse gas concentrations. Barring economic recessions, the world may be lucky to stop at 450, 500 or even beyond. Last year, humanity spewed some 36 billion metric tons of greenhouse gases, up from 35 billion the year before.
In the coming year, Scientific American will run an occasional series, “400 ppm,” to examine what this invisible line in the sky means for the global climate, the planet and all the living things on it, including human civilization. Some scientists argue we passed the safe level for greenhouse gas concentrations long ago, pointing to the accelerating impacts, from extreme weather to the meltdown of Arctic sea ice. Others argue that we have yet more room to burn fossil fuels, clear forests and the like—but not much—before catastrophic climate change becomes inescapable. And the international community of nations has agreed that 450 ppm—linked to a rise of 2 degrees Celsius in global average temperatures—should not be exceeded. We are not on track to avoid that limit, whether you prefer the economic analysis of experts like the International Energy Agency or the steady monitoring of mechanical sensors.
The last time CO2 levels at Mauna Loa were this high, Homo sapiens did not live there. In fact, the last time CO2 levels are thought to have been this high was more than 2.5 million years ago, an era known as the Pliocene, when the Canadian Arctic boasted forests instead of icy wastes. The land bridge connecting North America and South America had recently formed. The globe’s temperature averaged about 3 degrees C warmer, and sea level lapped coasts 5 meters or more higher. co2-levels-over-800000-years
Courtesy of Scripps Institution of Oceanography
The world will change again due to human activity and associated emissions of CO2, perhaps causing another set of coral reef extinctions like those found during the Pliocene, among other impacts. When Charles D. Keeling first started his measurements, CO2 made up some 317 ppm of the air we breathe and climate change was already a concern thanks to the work of John Tyndall, Svante Arrhenius and Guy Callendar. Every year since 1958 the sawtoothed line depicting Keeling’s measurements—readings kept up by his son Ralph—has climbed up, capturing the rise in greenhouse gas concentrations as well as the world’s breath. keeling-curve
Courtesy of Scripps Institution of Oceanography
What can be done? In the short term, more potent but shorter-lasting greenhouse gas emissions could be curbed or a concerted effort to develop CO2 capture and storage technology could be undertaken. Whether we do that or not, given CO2′s long lifetime in the atmosphere, the world will continue to warm to some extent; at least as much as the 0.8 degree C of warming to date is likely thanks to the CO2 already in the atmosphere.
At present pace, the world could reach 450 ppm in a few short decades. The record notches up another 2 ppm per year at present pace. Human civilization developed and flourished in a geologic era that never saw CO2 concentrations above 300 ppm. We are in novel territory again and we show no signs of slowing to get our bearings, let alone stopping.
TOPICS: Miscellaneous; News/Current Events; US: Hawaii
KEYWORDS: carbondioxide; climatechange; climatechangehoax; co2; globalwarming; globalwarminghoax; pliocene
Navigation: use the links below to view more comments.
first previous 1-20, 21-40, 41-60, 61-77 next last
To: Mrs. Don-o
Let's put "400 PPM" in proper perspective:
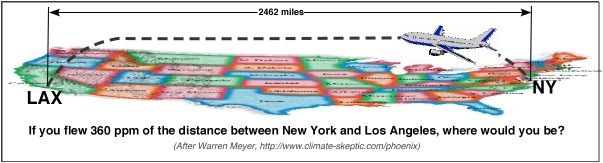
(I did that sketch for my granddaughter back when atmospheric CO2 was "only" 360 PPM.)
Today the claim is 400 PPM.
~~~~~~~~~~~~~
If you took off on Runway 13R-31L at JFK -- and traveled 400 PPM of the distance to LAX, where would you be?
(See my next comment...)
41
posted on
03/19/2014 6:59:27 AM PDT
by
TXnMA
(Remember the Alamo! Remember Goliad! REPEAT San Jacinto!!!)
To: Mrs. Don-o
With any substance other than CO2, a 0.0004 concentration would be referred to as a “trace”. Politics is trumping science, big time.
42
posted on
03/19/2014 7:04:58 AM PDT
by
JimRed
(Excise the cancer before it kills us; feed & water the Tree of Liberty! TERM LIMITS NOW & FOREVER!)
To: Mrs. Don-o
I endorse your proposal.
Let's organize ‘The Great Carbon Belch’.
Everyone start their cars and let them run in the driveway until the tanks run dry for a week straight. Same with the lawn mowers.
Let jet engines idle at airports, and refuel them in the air.
I'd wager the CO2 sensor is probably located over a fumarole in the Kilauea volcano.
To: eCSMaster
:o)
44
posted on
03/19/2014 7:08:36 AM PDT
by
Mrs. Don-o
(Point of view.)
To: PapaBear3625
Just you wait until my compost starts cookin’....
45
posted on
03/19/2014 7:09:59 AM PDT
by
Mrs. Don-o
(Point of view.)
To: Moonman62; All
I think it’s clear that there is a causal relationship between CO2 levels and temperatures. I don’t think there is a reasonable way to doubt that, just look at Venus for goodness sakes.
The question really is: does our contribution to the total CO2 amount in the atmosphere have a significant impact on the climate?
One factor the environmentalists seem to neglect is the very history they point to in an attempt to bolster their theory. In the article above and the graph you have provided, one can clearly see a natural trend towards rises and falls in CO2 amounts throughout recent geologic history.
A truly reasonable scientist would look at these data and conclude, if anything, we may indeed be in a warming trend but this trend is probably due to some as of yet unidentified factor that has clearly operated in the past, and had nothing to do with humanity.
Let’s examine your graph again. The period between the global increase in temperatures seems to be rather regular, with a period varying between 10 and 20,000 years.
Armed with this information, and the fact the period observed occured at least 4 other times with this same frequency, and the last spike occured about 12,000 years ago, if anything we are left with the distinct possibility (if not probability although admittedly statistical analysis cannot be done given such a small sample size) we are headed towards a warming trend, but not one caused by man’s influence rather one perfectly natural for this geologic epoch.
The truly vital and critical question to ask and answer is: is our CO2 output a significant portion of the total CO2 in the atmosphere? I have never seen this question addressed directly, in a rigorous way, and therefore I suspect the truly scientific and mathematic answer is “no”. I suspect this because it’s never discussed, this specific mechanism of man’s contribution and it’s effect on the environment, and the fact (if indeed it is a fact which I again suspect it is) that our contribution is negligible doesn’t fit too well with the agenda. The agenda being of course population control via the state.
Because “everyone” (everyone by implication who is smart) knows: humans=”bad”.
To: TXnMA
So post it, already!
But first let me get in my guess:
At the end of the runway?
47
posted on
03/19/2014 7:13:51 AM PDT
by
Mrs. Don-o
(Point of view.)
To: Mrs. Don-o
Perhaps, maybe, could be, most likely, possibly, etc.
48
posted on
03/19/2014 7:15:21 AM PDT
by
headstamp 2
(What would Scooby do?)
To: Cold Heat
Two words:
Dinosaur Flatulance.
49
posted on
03/19/2014 7:15:41 AM PDT
by
Ouchthatonehurt
("When you're going through hell, keep going." - Sir Winston Churchill)
To: Mrs. Don-o
ANSWER: If you traveled 400PPM of the distance from JFK to LAX, You would still be on or over the JFK runway -- with 9,283 feet (1 3/4 miles) of runway remaining!
And the warmalarmists claim that minuscule amount of carbon dioxide will destroy us...
Bravo Sierra!!!
50
posted on
03/19/2014 7:16:32 AM PDT
by
TXnMA
(Remember the Alamo! Remember Goliad! REPEAT San Jacinto!!!)
To: Mrs. Don-o
OK. So during pre-history, the Co2 was high.
What natural phenomenon caused that, dear scientists?
And can you prove to me that that natural phenomenon is no longer in existence?
No you can’t.
51
posted on
03/19/2014 7:22:33 AM PDT
by
I want the USA back
(Media: completely irresponsible traitors. Complicit in the destruction of our country.)
To: TXnMA
I got it! Whoopee!
Do I get a cookie?
52
posted on
03/19/2014 7:23:26 AM PDT
by
Mrs. Don-o
(Point of view.)
To: Mrs. Don-o
...after nightfall shut down photosynthesis for the day in Hawaii, carbon dioxide levels in the atmosphere touched 400 parts-per-million there for the first time... ... the hourly levels at Mauna Loa will soon drop as spring kicks in across the northern hemisphere, trees budding forth an army of leaves hungrily sucking CO2 out of the sky.
While I am neither a "Climate Scientist", nor have I played one on TV nor did I spend last night at a Holiday Inn Express, it does appear to me that, according to the above statements, atmospheric CO2 concentration is a least as dependent on the amount of plant growth as it is on SUV's & fossil fuel burning.
Long, harsh winters = higher CO2 concentrations.
Comments?
To: BwanaNdege
... the hourly levels at Mauna Loa
OK, this confirms my suspicions. So they locate the CO2 sensor next to a volcano to be representative of the whole planet?
I live near Pittsburgh. Every year they trumpet how our air is STILL among the dirtiest in the country, which I also don't believe. Until a few years ago, the air quality sensor was located...(and I'm not joking)...above the bus entrance to the Greyhound station!
54
posted on
03/19/2014 7:27:56 AM PDT
by
BikerJoe
To: BikerJoe
... the hourly levels at Mauna Loa OK, this confirms my suspicions. So they locate the CO2 sensor next to a volcano to be representative of the whole planet?
Before I get flamed, sorry, I forgot, isn't Mauna Loa inactive?
55
posted on
03/19/2014 7:29:51 AM PDT
by
BikerJoe
To: Mrs. Don-o
Good guess! And good sense of perspective!
Ummm... the only "cookies" I have on hand are -- "Milk-Bone" brand. [So, I doubt you'd want one...] '-)
56
posted on
03/19/2014 7:31:04 AM PDT
by
TXnMA
(Remember the Alamo! Remember Goliad! REPEAT San Jacinto!!!)
How much of the “Greenhouse Effect” is caused by human activity?
It is about 0.28%, if water vapor is taken into account— about 5.53%, if not.
This point is so crucial to the debate over global warming that how water vapor is or isn’t factored into an analysis of Earth’s greenhouse gases makes the difference between describing a significant human contribution to the greenhouse effect, or a negligible one.
http://www.geocraft.com/WVFossils/greenhouse_data.html
57
posted on
03/19/2014 7:31:46 AM PDT
by
listenhillary
(Courts, law enforcement, roads and national defense should be the extent of government)
To: BikerJoe
That is another factor to consider here in the final analysis. Where are these sensors located?
I think the story in the OP about the one located near a volcano is laughable. I’d like to THINK this obvious bias is accounted for in some way.
Somehow I don’t think it is. Call me cynical.
To: Mrs. Don-o
The article says
"...the last time CO2 levels are thought to have been this high was more than 2.5 million years ago, an era known as the Pliocene, when the Canadian Arctic boasted forests instead of icy wastes. The land bridge connecting North America and South America had recently formed. The globe’s temperature averaged about 3 degrees C warmer, and sea level lapped coasts 5 meters or more higher." However,
"During the ice ages of the Pleistocene Epoch, global sea levels fell significantly in many areas around the world as the Earth's water and precipitation became frozen in large continental ice sheets and glaciers. As these ice sheets and glaciers grew, global sea levels fell and in several places across the planet different land bridges became exposed. The Bering Land Bridge between eastern Siberia and Alaska was one of these."
A Geographic Overview of the Bering Land Bridge
Facts? Who needs facts? Just make up things as you go along. After all, we're trying to save the planet! It's for the children, right?
To: Mrs. Don-o
I’m waiting for the OXYGEN level to hit 30% like in prehistoric times! Think of the grass fires!
60
posted on
03/19/2014 7:49:01 AM PDT
by
Ruy Dias de Bivar
(Sometimes you need 7+ more ammo. LOTS MORE.)
Navigation: use the links below to view more comments.
first previous 1-20, 21-40, 41-60, 61-77 next last
Disclaimer:
Opinions posted on Free Republic are those of the individual
posters and do not necessarily represent the opinion of Free Republic or its
management. All materials posted herein are protected by copyright law and the
exemption for fair use of copyrighted works.
FreeRepublic.com is powered by software copyright 2000-2008 John Robinson