
Posted on 11/09/2013 6:40:23 AM PST by Kaslin
Initial Reaction
The already wide discrepancies between the household survey and the establishment survey took a wild leap yesterday.
The establishment survey showed a gain of 240,000 jobs but the household survey showed a drop in employment of -735,000. However, the BLS states that on unadjusted basis 448,000 of the drop in employment was due to temporary federal layoffs during the budget negotiations.
Because of the way the BLS calculates overall numbers, one cannot subtract the seasonally unadjusted number of -448,000 from the reported seasonally adjusted number of -735,000 and arrive at any kind of meaningful number.
Important Note: I will go through my normal calculations, but they are very distorted by the temporary layoffs.
How Federal Layoffs Distorted the Picture
The BLS reports "Estimates of the unemployed by reason, such as temporary layoff and job leavers, do not sum to the official seasonally adjusted measure of total unemployed because they are independently seasonally adjusted. Household survey data for federal workers are available only on a not seasonally adjusted basis. As a result, over-the-month changes in federal worker data series cannot be compared with seasonally adjusted over-the-month changes in total employed and unemployed."
From the Commissioner's Statement
Some federal workers who were not at work during the entire reference week in October were not classified as unemployed on temporary layoff.
Our review of the data indicates that most of these workers should have been classified as unemployed on temporary layoff. Such a misclassification is an example of nonsampling error and can occur when respondents misunderstand questions or interviewers record answers incorrectly. According to usual practice, the data from the household survey are accepted as recorded. To maintain data integrity, no ad hoc actions are taken to reassign survey responses.
If the federal workers who were recorded as employed but absent from work had been classified as unemployed on temporary layoff, the overall unemployment rate would have been slightly, but not substantively, higher than reported.
Revisions
This was the fourth straight month of revisions to the establishment survey. The first two revisions were significantly lower. Last month, the revision was slightly higher and I commented "Perhaps the BLS has numbers they are happy with now." So much for that idea. Today, the BLS reports "August revised up by 45,000 (from +193,000 to +238,000), and the employment change for September revised up by 15,000 (from +148,000 to +163,000).
The unemployment rate rose 0.1 to 7.3% (but according to the BLS it should have been higher due to estimated nonsampling error as noted in the commissioner's statement above).
It's the household survey that determines the unemployment rate, not the establishment survey. So let's take a look at the factors.
Explaining the Unemployment Rate
Employment fell more than the labor force, so the unemployment rate rose.
October BLS Jobs Statistics at a Glance
Quick Notes About the Unemployment Rate
October 2013 Jobs Report
Please consider the Bureau of Labor Statistics (BLS) October 2013 Employment Report.
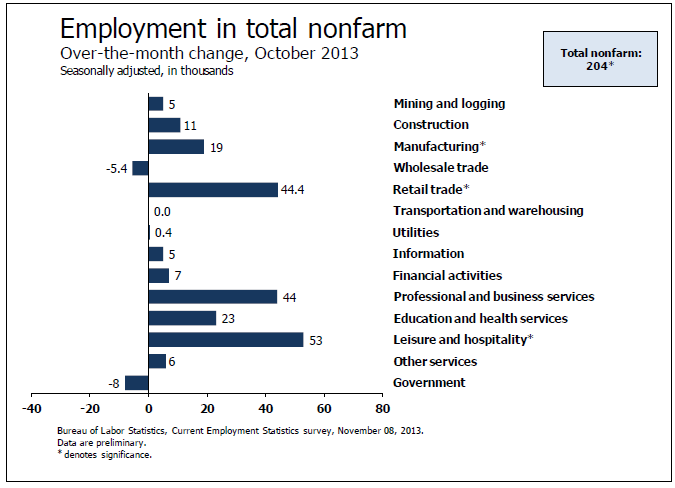
Total nonfarm payroll employment rose by 204,000 in October, and the unemployment rate was little changed at 7.3 percent, the U.S. Bureau of Labor Statistics reported today. Employment increased in leisure and hospitality, retail trade, professional and technical services, manufacturing, and health care.
Click on Any Chart in this Report to See a Sharper Image
Unemployment Rate - Seasonally Adjusted

Employment History Since January 2009
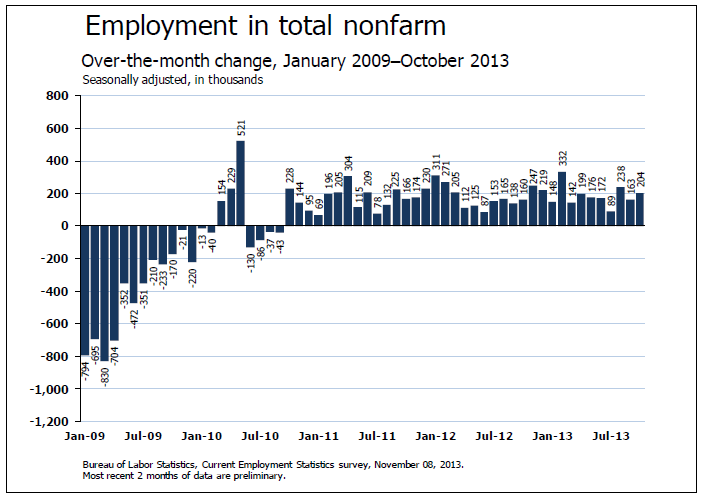
click on chart for sharper image
Change from Previous Month by Job Type
Hours and Wages
Average weekly hours of all private employees remained at 34.4 hours. Average weekly hours of all private service-providing employees was flat at 33.3 hours.
Average hourly earnings of production and non-supervisory private workers rose $0.02 to $20.26. Average hourly earnings of private service-providing employees rose $0.02 to $20.04.
Real wages have been declining. Add in increases in state taxes and the average Joe has been hammered pretty badly. For 2013, one needs to factor in the increase in payroll taxes for Social Security.
For further discussion of income distribution, please see What's "Really" Behind Gross Inequalities In Income Distribution?
BLS Birth-Death Model Black Box
The BLS Birth/Death Model is an estimation by the BLS as to how many jobs the economy created that were not picked up in the payroll survey.
The Birth-Death numbers are not seasonally adjusted, while the reported headline number is. In the black box the BLS combines the two, coming up with a total.
The Birth Death number influences the overall totals, but the math is not as simple as it appears. Moreover, the effect is nowhere near as big as it might logically appear at first glance.
Do not add or subtract the Birth-Death numbers from the reported headline totals. It does not work that way.
Birth/Death assumptions are supposedly made according to estimates of where the BLS thinks we are in the economic cycle. Theory is one thing. Practice is clearly another as noted by numerous recent revisions.
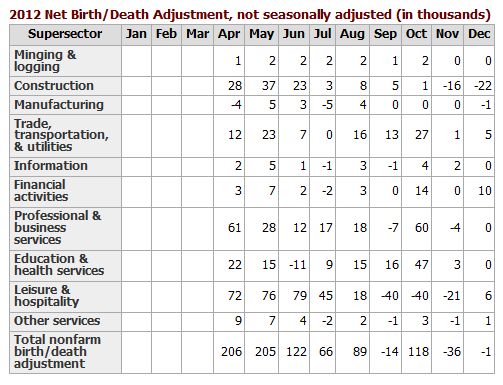
Birth Death Model Adjustments For 2012
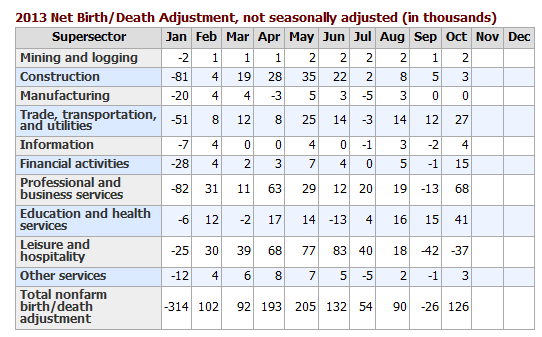
Birth Death Model Adjustments For 2013
Birth-Death Notes
Once again: Do NOT subtract the Birth-Death number from the reported headline number. That approach is statistically invalid.
In general, analysts attribute much more to birth-death numbers than they should. Except at economic turns, BLS Birth/Death errors are reasonably small.
For a discussion of how little birth-death numbers affect actual monthly reporting, please see BLS Birth/Death Model Yet Again.
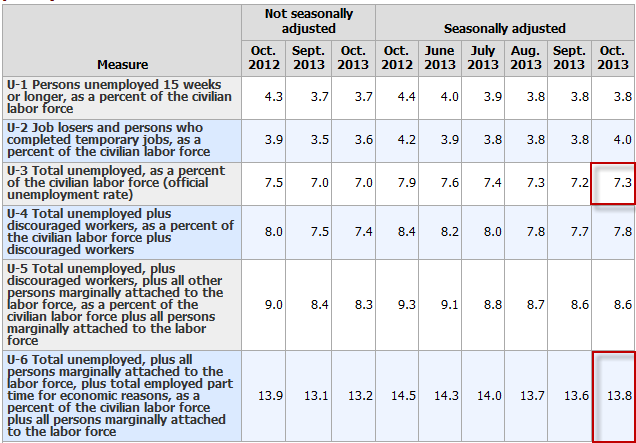
Table 15 BLS Alternate Measures of Unemployment
click on chart for sharper image
Table A-15 is where one can find a better approximation of what the unemployment rate really is.
Notice I said "better" approximation not to be confused with "good" approximation.
The official unemployment rate is 7.3%. However, if you start counting all the people who want a job but gave up, all the people with part-time jobs that want a full-time job, all the people who dropped off the unemployment rolls because their unemployment benefits ran out, etc., you get a closer picture of what the unemployment rate is. That number is in the last row labeled U-6.
U-6 is much higher at 13.8%. Both numbers would be way higher still, were it not for millions dropping out of the labor force over the past few years.
Labor Force Factors
Were it not for people dropping out of the labor force, the unemployment rate would be over 9%. In addition, there are 8,050,000 workers who are working part-time but want full-time work.
Grossly Distorted Statistics
Digging under the surface, much of the drop in the unemployment rate over the past two years is nothing but a statistical mirage coupled with a massive increase in part-time jobs starting in October 2012 as a result of Obamacare legislation.
Moreover, as noted above, this month's numbers are extremely distorted due to temporary layoffs. Next month we will have a better understanding of various factors including the unemployment rate.

“Figures lie, and liars figure.” It’s true, especially with these corrupt Democrats in office, covering for The Worst President Ever.
IMO, It is hard to count any of those ‘shutdown’ people as Layoffs, when they are getting paid for every minute, and they didn’t work.
Also- Many of them are demanding to collect both their delayed wages/salaries & UNEMPLOYMENT.
True Double Dippers!!!
We have now seen the decoupling of ADP and NFP.
The BLS Fun with Numbers exercise.
240,000 new jobs created for the MONTH.
About 320,000 new unemployment claims per WEEK.
At that rate, new job creation is only about 1/5 of the new unemployment.
[Are they going to blame the slight increase in the UE rate on those California computers again? Those computers have been taking the blame for months.]
Maybe if Bammy would just stop focusing on jobs.....?
According to the liar in chief the jobs report is great.
It would be much better if that arrogant pos just would resign along with his entire administration
Shadowstats is often thought to be a bit on the high side of depressing. However, even granting that, what is interesting is the divergence between the blue Shadowstats line of U-6 and the gray government line of U-6. Both tracked pretty well before 2010, but now they diverge sharply.
Who are you going to believe? Obama or ShadowStats?
Surely, you jest.
In the last year, in a typical month under Jug-ear's pitiful administration, there were about 4.4-4.5 million new hires, none of them thanks to Dear Leader.
There were about 4.3-4.4 million separations, probably more than a few of them due to the ACA and Dear Leader.
There's the net 100K to 200K new jobs each month.
However, new unemployment benefit claims have nothing to do with net new job creation, horrible as it has been.
~4.3 million separations/month leads to ~350K/week (~1.5 million/month) in new unemployment claims. No surprise there.
In a healthy economy, with 3.5-4.0% growth, new hires would be, for instance (and it has been previous to Dear Leader,) 5.5 million/month and separations 5 million/month -- that's net new employment of 500K/month, not at all unusual for a rapidly growing economy -- we used to do this routinely prior to Dear Leader.
New unemployment claims would still be 300-350K/week. Oh, the horror! According to your math and logic, new job creation would be about a third of new unemployment. We're doomed!
See how comparing apples and oranges, never mind ignoring an important reference point about how to think about the oranges doesn't work?
The difference between what we are doing and what we could be doing is the lying idiot we elected and his anti-growth policies, not some BLS statistical conspiracy.
Disclaimer: Opinions posted on Free Republic are those of the individual posters and do not necessarily represent the opinion of Free Republic or its management. All materials posted herein are protected by copyright law and the exemption for fair use of copyrighted works.