
Posted on 05/06/2016 4:50:52 AM PDT by expat_panama
Seldom have we seen so many assets and indicators at decision points simultaneously! We see stocks, gold, and the U.S. dollar trading at extremely important levels, all in conjunction. Note that this is not according to technical analysis, but our intermarket analysis and chart patterns.
First, as indicated in recent analysis, risk indicators in U.S. stocks have turned positive in recent weeks. That suggest a bullish outcome for stocks, almost exactly at their breakout level. We prefer to let the market do its work, and so far we have not seen a breakout. But there are sufficient signs that it is in the making.
As stocks are testing key resistance, the U.S. dollar is testing secular support. Needless to say that the next chart is of incredible importance to all markets worldwide. Remember the summer of 2014, when the dollar started a huge rally? It created a domino effect in all markets: crude oil crashed with more than 70% (its steepest decline ever), stock markets went through a flash crash, emerging markets collapsed, … If the dollar manages to hold the 92 level, it would imply a successful test of its secular breakout. We should not understimate the importance of this scenario, as the dollar would be in a confirmed bull market, or, at a minimum, in a consolidation phase of its bull market.

We realize that a dollar bull market is not in line with the expectations of many, including ourselves. Let us reiterate, just like we did repeatedly in the past, that we are not hoping for that outcome. We do not believe that ongoing extreme monetary policies will end well, and the sooner a correction in monetary markets takes place, the better. Our job, however, is to read the message of markets, regardless our opinion(s). So our analysis is objective, and we simply look for trends and try to derive as much as possible valuable information on the charts.
Talking about expectations, below is the chart featuring inflation expectations. This is another case of an asset that reached multi-year resistance.

While all previous charts were interesting and meaningful, the most fascinating chart currently is GOLD. This is an incredible story. The yellow metal moved from the bottom of its descending trend channel to the top in a matter of weeks. That was an extremely powerful move, and we admit in all honesty that we did not see that coming.
However, gold is being stopped currently, and seems not able to rally any further. Gold’s huge resistance area coincides with secular support in the U.S. dollar, resistance in inflation expectations, and critical resistance in U.S. stocks. That is really no coincidence. From an intermarket point of view, this is an extremely important period of time, as the next big moves are brewing, and we can expect a resolution sooner rather than later.

Which direction will gold go? We believe the rally in gold is over, and a sharp correction is in the making, based on two indicators.
First, gold miners, a leading indicator in the precious metals complex, have reached extreme resistance. Note on the next chart how the current resistance level goes back to the 2013 collapse. After the incredible recent run in which gold miners doubled in a matter of weeks, the rally seems extremely overbought currently, and we see a sharp reversal right at the upper boundaries of resistance. This is extremely bearish.

Our second, and more important, indicator in precious metals is the COT report. Readers know meantime that we are focused on the combination of extreme net positions of commercial traders and the rate of change of their net positions. Both paramaters suggest an extremely bearish scenario. Commercial traders have accumulated short positions in a very fast way (too fast), and reached extreme levels not seen since December 2012, right before the big crash of precious metals.
Are we now saying that a crash is coming in gold and silver, similar to 2013? Not necessarily, but our point is that a severe correction is in the making, and we do not exclude that gold will fall back to the lower area of its trend channel, which would be right above $1,000, based on the extremely bearish COT report.
CONCLUSION:
We believe gold is about to correct sharply very soon. The U.S. dollar is testing its secular breakout point, watch whether the 92 level holds for a breakdown or a confirmation of its bull market. Deending on the move of the U.S. dollar stabilizes, we will see consequences in global markets: a stabilization of the dollar could push stocks much higher, a break down of the dollar (very unlikely though) will lit a fire under commodities markets, while a successful retest of the dollar’s breakout level will result in a strong correction in commodities and gold.
(.....There is absolutely nothing wrong with holding cash, now, then, forever.)
That’s a good recipe for losing buying power.
Seems like those who have been holding gold since forever did much, much better.
The economy is weaker than they are disclosing. Both the right (Trump) and the left (Yellen) don’t seem to be too keen on increasing interest rates. In a negative interest rate environment gold is king. As the supply of gold decreases, and it is expected to decrease as there hasn’t been much investment in exploration since forever, the price of gold will increase. Over the long run. Who knows what the short term fluctuations will look like.
Hey, I resemble that remark! Seriously, though, I've seen that chart a thousand times. But always it is at a specific moment, of course, and at that moment, is it a good time? Like right now? I'm really not stupid, but I'll still hold on.
If we lived for centuries, that would apply.
There are times when having cash to buy bargains can create tremendous gains. There are times when we perceive stocks to be “bargains” and those are the times usually create the biggest and most horrific losses.
Good analysis. I just don’t agree with it based on fundamentals. It all centers around the US$. If your theory of the US$ doesn’t pan out, everything else becomes the opposite, except the stock market which actually will do terribly if the interest rates rise and the US$ strengthens.
The only reason the US$ has increased in the last few years was in the erroneous belief that interest rates in the US are going to rise. The market kept expecting that quarter after quarter, year after year. And throughout that period the US$ kept strengthening and gold kept plunging. As the market realizes that higher interest rates are not coming, both will revert back to their levels before this erroneous expectation took hold. That means gold will be way higher, and the dollar will be way lower.
I have all my clients in 10-20% cash right now. (actually, they are in US Treasury notes and strips).
[WARNING: REPLY IN KIND]
What, you don't live hundreds of years? Wow, you poor poor darling.
Back to Planet earth.
A normal retirement savings span is say 40 years. You're the smart one, you tell me which 40-year span is the one that would have been bad for stocks and great for stupid cash? Yeah, sure there can be say a year or two that stocks are bad and if we only lived a year or two then you'd be right.
No need to be condescending. Easy enough. There are many of them.
1915 > 1942
1916 > 1948
1915 > 1942
1915 > 1943
1927, 8, or 9 > to 1973 or 1975 or 1977 or 1978 (that’s 3E4) which is 81 instances.
So there are 85 examples for you.
an I assume that chart is “normalized” for inflation?
“I see one last smack down coming for PM’s before the banks can no longer manipulate and control and PM’s take off in value/price.”
I sure hope so! I’ve been waiting 14 years for this! :)

There are many, many 20 and 30 and 40 year and even 50 and 60 year periods where the market experienced losses and some cases ghastly losses. One could not invest in the "DJIA" back then because there were not etfs, nor were there retirement plans, lifespans were shorter (so the "40 year" arbitrary benchmark applies somewhat less) and the DJIA also has "survivor bias", which means (as you surely know) that your investment in Eastman Kodak or Bethlehem Steel (once the largest company on the NYSE), or even GM for that matter which go to zero are replaced by something else.
Huh, now I seem to be hearing this everywhere. Got it from you first, tx!
You're right to be concerned w/ inflation w/ investment planning. 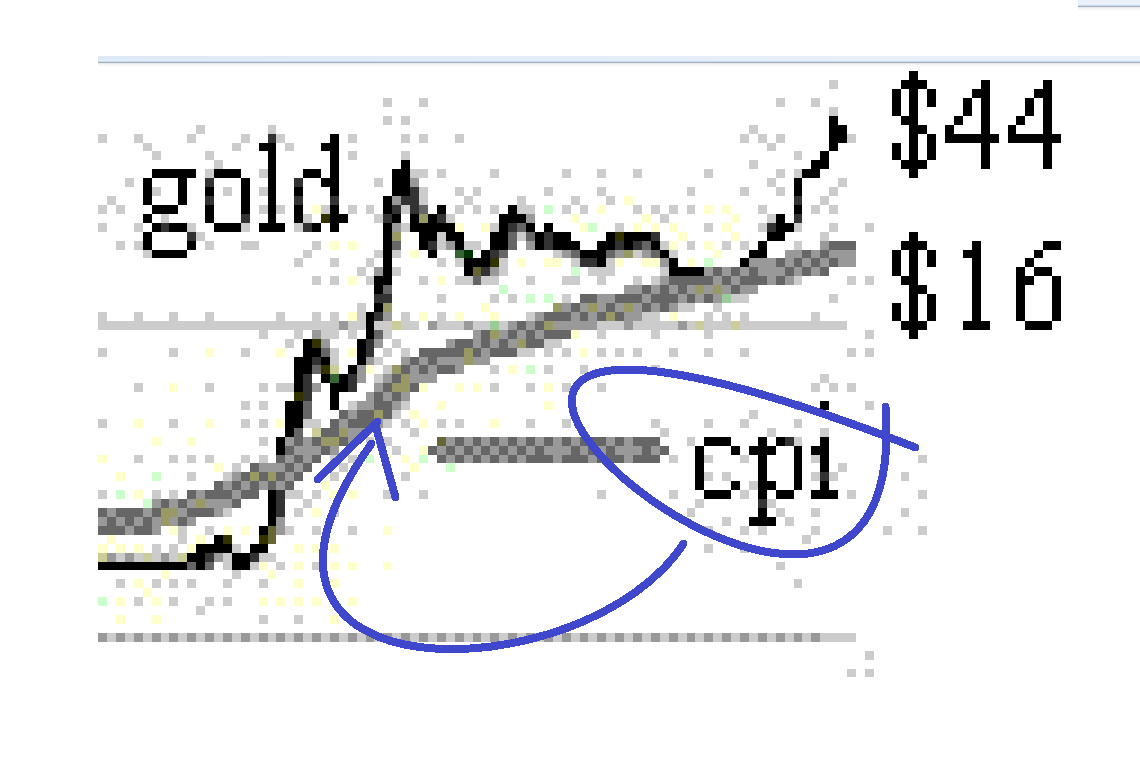
Down in the lower right hand corner of the numbers is a grey line labeled "cpi" --the consumer price index.
It shows that a one dollar purchase in 1800 of the standard market basket of the index would be worth about $16 in current dollars.
We get an idea of the last 40 years of returns by seeing how that time-frame shows a tripling of inflation, a 20-increase in the price of gold, and a 10,000% increase in sales price of a bunch of Dow Jones stocks + dividends.
Since the past four-decade returns has been fairly typical of what we've had over the past two centuries it's reasonable to plan that the next 40 years can be much the same.
I will add one last comment on this topic.
From the chart I posted, one can see several things but one thing that is painfully obvious.
To invest long after a robust recovery, at an apparent “peak” into a period of war can be horrific. The absolute worst.
1914-1915 > 1918
1937 > 1942
1965 > 1972
Over and above the chestnut of “dca”, these are jaw-dropping ghastly losses. Sure, if you can stomach them, there is sweetness and light on the other side on a near-infinite timespan.
The market has tripled since SP 666 March 2009. Traders have been betting that rates will rise since “they can’t go any lower”. Those traders have been obliterated over the past 2-3 years. Murdered.
Now we have the concept of negative rates = NIRP. This is a synthetic construct. Nobody knows how stocks will perform under such conditions. Good div payers *should* do well. But there are many shoulds that do not turn out as expected.
why even look at the US market?...ex pats should invest in the country they call home...the USA is apparently not your home...
Disclaimer: Opinions posted on Free Republic are those of the individual posters and do not necessarily represent the opinion of Free Republic or its management. All materials posted herein are protected by copyright law and the exemption for fair use of copyrighted works.