
Posted on 12/06/2014 12:34:35 PM PST by Kaslin
Initial Reaction
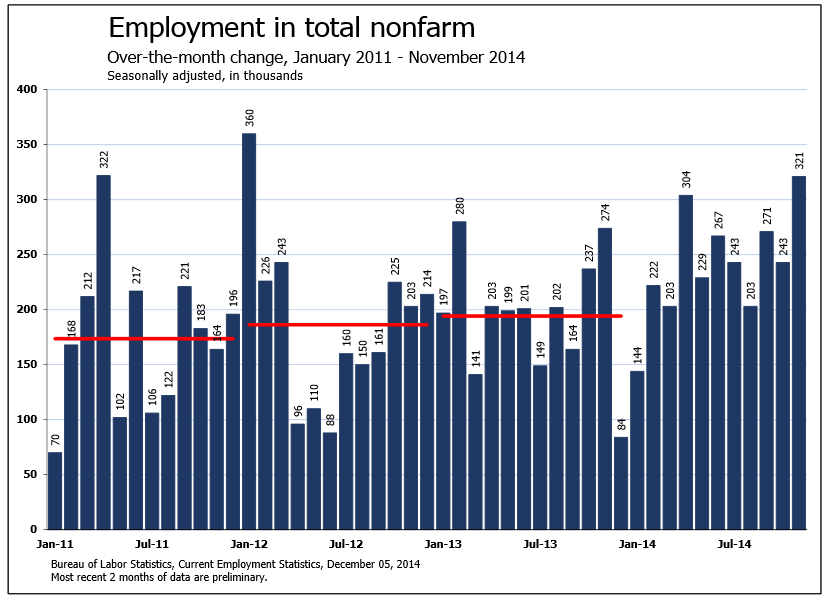
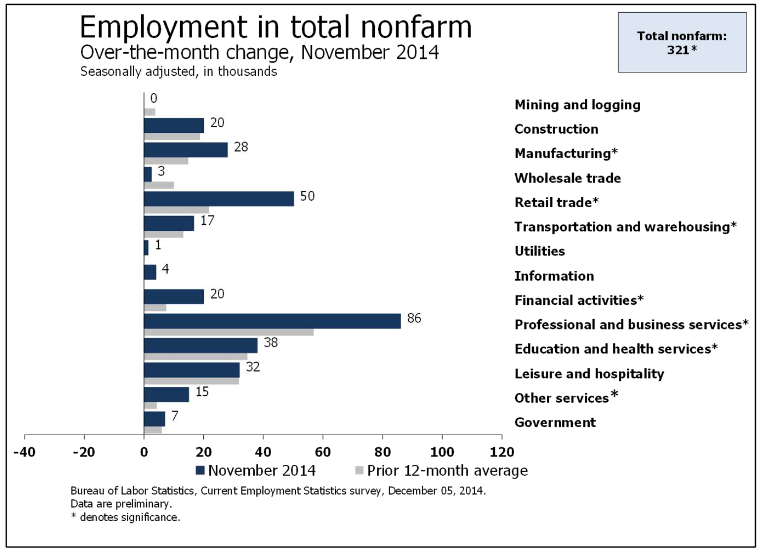
The payroll survey shows a net gain of 321,000 jobs vs. a Bloomberg consensus expectation of 230,000 jobs. September was revised up from 256,000 to 271,000. October was revised up from 214,000 to 243,000.
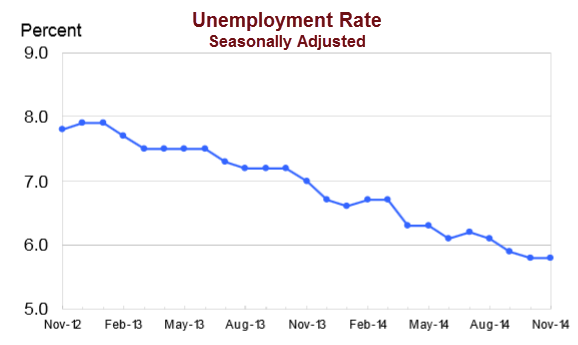
The unemployment rate was steady although employment only rose by 4,000 in the household survey. Unemployment actually rose by 115,000. Swings in household survey employment and the labor force have been wild lately.
Once again we are in a situation where the establishment survey and the household survey are at odds. Over time these fluctuations tend to smooth out. The question, as always, is "in which direction".
BLS Jobs Statistics at a Glance

The Bureau of Labor Statistics has the Obama stench all over it.
#1. It’s a load of crap designed to fool the nolow constituents and doing a damn fine job of that?
Obam-bers : )
Actual unemployment is 37.2%, ‘misery index’ worst in 40 years.
http://www.freerepublic.com/focus/f-news/3114041/posts
Why don’t we ever see the monthly numbers of :
How many people paid income tax
How many people paid Social Security taxes
Because, it is more important we know how many people are on the non-farm payrolls that were born under the sign of Taurus, born in the afternoon hours, on a day the sun shone brightly, to rich white folks, that live in houses facing south, that had one cow for milking. Now, any more questions?
“monthly numbers of income taxes and SS”
Monthly? Who needs monthly?
That information is published DAILY by the Treasury Dept. It’s called the Daily Treasury Statement.
See: https://www.fms.treas.gov/dts/index.html
Page 7 has tax deposits and payments of all kinds:
Withheld Income and Employment Taxes
Individual Income Taxes
Railroad Retirement Taxes
Excise Taxes
Corporation Income Taxes
Federal Unemployment Taxes
Estate and Gift Taxes & Misc IRS Rcpts.
Cash Federal Tax Deposits:
Direct
Through Depositaries
Total Cash FTD’s
Inter-agency Transfers
Every single one of those numbers reflects an actual dollar balance. They are not subject to any adjustment or modification or smoothing or substitution — they are just actual numbers reflecting real transactions in any given 24 hour period.
Since they aren’t subject to any fiddling or game-playing, they’re the only fed numbers I pay any attention to or rely on.
For Sep-Oct-Nov, using withheld income and SS taxes only, year-over year withholding is running about +4%. Earlier in the year — Jan-Feb-Mar — it was running about +8% y-o-y.
Of the current roughly +4%, about 2% is for new jobs (total non-farm employment has been running about +2% y-o-y all year.) That leaves about +2% as increased withholding for existing “old” jobs. Assuming 2% inflation, that leaves essentially no net wage growth happening right now. Net wage growth was running about +5% early in the year and has slowed down steadily all year.
The upshot of all that is employment is growing slowly but steadily, and average wages are stagnant.
Despite the worst that President Chickenshit can throw at it, the U.S. economy is resilient enough to manage to grow slowly. Perhaps growth rates will improve a little next year with Republican control of the Senate. 2017 might finally see a return to consistent, solid 4%+ growth if jug-ears is replaced with any Republican.
A general point on the article. Shedlock is mistaken when he says “all the people who dropped off the unemployment rolls because their unemployment benefits ran out” when talking about how unemployed people are counted.
Whether or not anyone is collecting a UI check has absolutely NOTHING to do with who is counted as unemployed. That number is determined solely by the Household Survey — you are either able to work and actively looking or you ain’t. UI doesn’t matter, period.
 the numbers come from the federal government, THAT is all you need to know... to know it's bull$h!t
When are they going to crank in 5 million new job seekers?
Exactly
Disclaimer: Opinions posted on Free Republic are those of the individual posters and do not necessarily represent the opinion of Free Republic or its management. All materials posted herein are protected by copyright law and the exemption for fair use of copyrighted works.