Skip to comments.
What States are the Biggest Job Winners and Losers in the Recovery?
Townhall.com ^
| August 18, 2014
| Mike Shedlock
Posted on 08/18/2014 6:36:36 AM PDT by Kaslin
The Deloitte University Press has a very interesting, and comprehensive study on job gains and losses, by type of job, and state by state.
The biggest winners are states involved in energy production, finance, or healthcare. The biggest losers are states that did not recover from the real estate bust, or lost population due to emigration.
With that overview, let's dive deeper into the Geography of Jobs.
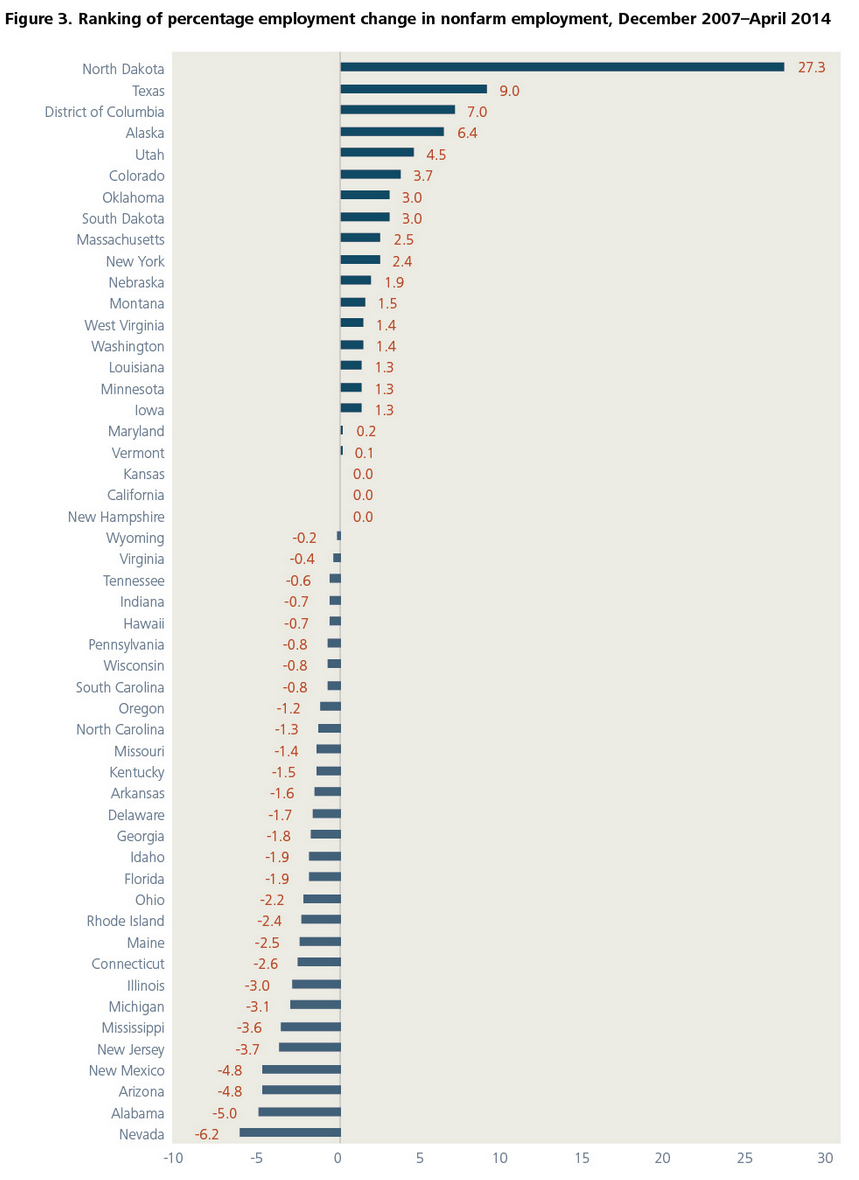
Only now, as we reach the fifth anniversary of the end of the recession, has employment in the United States finally regained its pre-recession peak. The national story of slow recovery obscures the more complicated regional picture: As is the case during most business cycles, the pace of recovery has been very uneven among the states. At present, only 16 states plus the District of Columbia have employment rates at least one percent higher than they had prior to the start of the recession.
Among the states that have experienced the highest overall employment gains are the beneficiaries of expanding energy production. Among the states where employment remains substantially below pre-recession levels are those states most affected by the bursting of the housing bubble and those with declining manufacturing employment.
click on chart for sharper image
Only 16 states and the District of Columbia are at least one percent above their pre-recession employment levels. For more than half of these states (North Dakota, Texas, Alaska, Utah, Colorado, Oklahoma, Montana, West Virginia, and Louisiana), expanding energy production has played a key role in driving employment growth. The District of Columbia and the other employment-gaining states can attribute their total employment growth to increases in a variety of sectors, most notably health services and leisure and hospitality.
Four of these states (North Dakota, Colorado, Texas, and South Dakota) and the District of Columbia also had among the highest proportional increases in population due to inflows of people from other states between 2010 and 2013 (net domestic migration) as people moved to where the jobs were. Texas alone added more than 400,000 people from other states (1.5 percent of its 2013 population) during this period.
The recession was significantly more severe for the states that fall at the bottom of the job recovery rankings; these states continued to lose jobs well after the end of the recession. Job creation did not pick up in Nevada and New Jersey until the beginning of 2011 and did not pick up in Alabama and Maine until the middle of 2011. It took until the middle of 2012 for employment to begin to grow in New Mexico.
Population also migrated away from the states at the bottom of the job recovery rankings: Of those in the bottom 10, New Jersey, Maine, New Mexico, Connecticut, Michigan, Rhode Island, and Illinois all lost population to domestic migration.
Currently only North Dakota, the District of Columbia, and Oklahoma have more construction workers than they did in December 2007. Two of the states in the bottom 10 for employment recovery, Nevada and Arizona, were the hardest hit by the bursting of the housing bubble: At present, construction employment in Nevada is 51 percent below, and in Arizona is 42 percent below, their December 2007 construction employment levels. The other three states that remain at the bottom in terms of employment recovery—Alabama, New Mexico, and New Jersey—all have construction employment losses at least five percentage points higher than the national average.
The report takes a detailed look at mining, construction, and manufacturing gains and losses.
Mining is of course a net overall gain, while hard-hit manufacturing states were slow to recover.
Here are a few of my own conclusions, not from the report:
- California no doubt benefited from Silicon Valley in spite of an overall hostile business environment and tax setup
- Illinois was hit with a series of misguided tax hikes to the point Caterpillar threatened to leave the state. Illinois has no redeeming features to offset high taxes and other mistakes.
- D.C. benefited from national politics and lobbying.
- In general, red vs. blue is not the name of the game, but rather "what have you done for me lately".
It's a nice report. Inquiring minds may wish to take a closer look.
TOPICS: Business/Economy; Culture/Society; Editorial
KEYWORDS: economicrecovery; economy; employment; jobs; recovery; states; unemployment
1
posted on
08/18/2014 6:36:36 AM PDT
by
Kaslin
To: Kaslin
2
posted on
08/18/2014 6:37:19 AM PDT
by
yldstrk
( My heroes have always been cowboys)
To: Kaslin
Colorado is only up because of the drug industry that Obama started up for Soros. He got caught trying to import lots of new customers from Central America but they’re stil coming...
To: yldstrk; P-Marlowe
recovery?
It’s a lie they tell. In the last 2 quarters the economy average 1/2% growth. Because they adjusted it down so far because of bad weather in the 1st quarter, they bragged about 4% growth last quarter.
Without that deep adjustment down, it has grown only 1% since the last quarter of 2013.
Government bureaucrats love to manipulate numbers.
4
posted on
08/18/2014 6:54:33 AM PDT
by
xzins
( Retired Army Chaplain and Proud of It! Those who truly support our troops pray for victory!)
To: yldstrk
North Dakota has the lowest unemployment rate of 2.7 percent. Followed by Nebraska, Utah and Vermont with 3.5 each
5
posted on
08/18/2014 6:54:56 AM PDT
by
Kaslin
(He needed the ignorant to reelect him, and he got them. Now we all have to pay the consequenses)
To: Kaslin
I can’t believe the Virginia or Maryland numbers.
The Federal government has been growing at leaps and bounds with Captain Midnight at the helm.
To: Kaslin
Percentage employment is a bad measure of job health.
If people are leaving a state in droves (New York, California) to look for work in other states, then it boosts the numbers in 5the state that they left.
IOW, don’t look for work in New York.
7
posted on
08/18/2014 7:04:50 AM PDT
by
kidd
To: Kaslin
Of the 8 that are above 2.5% (and all 8 are at a minimum of 3%), there are 7 energy producers and one blood sucker (DC).
8
posted on
08/18/2014 7:25:39 AM PDT
by
Hieronymus
( (It is terrible to contemplate how few politicians are hanged. --G.K. Chesterton))
To: Kaslin
It would be interesting to overlay this chart with Right To Work status
9
posted on
08/18/2014 7:47:53 AM PDT
by
bigbob
(The best way to get a bad law repealed is to enforce it strictly. Abraham Lincoln)
To: jsanders2001
Oh come on. The drug thing is something a lot of us here in CO are embarrassed and ashamed of, but there weren’t all that many jobs created by that.
Fracking is the more likely cause of job growth in CO.
10
posted on
08/18/2014 7:52:16 AM PDT
by
Balding_Eagle
(If America falls, darkness will cover the earth for a thousand years.)
To: xzins
The raw unadjusted numbers show 0 growth.
11
posted on
08/18/2014 9:26:58 AM PDT
by
Jim from C-Town
(The government is rarely benevolent, often malevolent and never benign!)
To: Jim from C-Town
doesn’t surprise me at all
When the government using a system that claims no one working and no one looking for work equals full employment, then you know that the politicians have gotten control of the numbers reporting.
12
posted on
08/18/2014 9:31:23 AM PDT
by
xzins
( Retired Army Chaplain and Proud of It! Those who truly support our troops pray for victory!)
To: Kaslin
13
posted on
08/18/2014 9:35:53 AM PDT
by
SeekAndFind
(If at first you don't succeed, put it out for beta test.)
To: bigbob
Well, Texas is one of them...I cannot speak to the others...
But the odds are good...
14
posted on
08/18/2014 2:56:03 PM PDT
by
stevie_d_64
(I will settle for a "perfectly good, gently used" kidney...Apply within...)
Disclaimer:
Opinions posted on Free Republic are those of the individual
posters and do not necessarily represent the opinion of Free Republic or its
management. All materials posted herein are protected by copyright law and the
exemption for fair use of copyrighted works.
FreeRepublic.com is powered by software copyright 2000-2008 John Robinson