Skip to comments.
US jobless queue shortens, but housing starts plunge sharply in June
CNBC ^
| 07/17/2014
Posted on 07/17/2014 6:52:23 AM PDT by SeekAndFind
The number of Americans filing new claims for unemployment benefits unexpectedly fell last week, suggesting the labor market recovery was gaining traction. However, a separate report showed U.S. housing starts and building permits unexpectedly fell in June, suggesting the housing market recovery was struggling to get back on track after stalling in late 2013.
Initial claims for state unemployment benefits dropped 3,000 to a seasonally adjusted 302,000 for the week ended July 12, the Labor Department said on Thursday.
The prior week's claims were revised to show 1,000 more applications received than previously reported. Economists polled by Reuters had forecast first-time applications for jobless aid rising to 310,000 last week.
The four-weak average of claims, considered a better gauge of labor market trends as it irons out week-to-week volatility, fell 3,000 to 309,000, the lowest level since June 2007.
(Excerpt) Read more at cnbc.com ...
TOPICS: Business/Economy; Culture/Society; News/Current Events
KEYWORDS: housing; joblessclaims; jobs; unemployment
Navigation: use the links below to view more comments.
first 1-20, 21-32 next last
It's fun with Thursday jobless claims numbers once again...
To: SeekAndFind
I truly hope that some time in the future when all of this madness is over someone will be able to give us the actual real-world numbers. I’m genuinely interested to see how bad it truly is/has been.
2
posted on
07/17/2014 6:54:16 AM PDT
by
rarestia
(It's time to water the Tree of Liberty.)
To: SeekAndFind
Queue? Are we still in the Commonwealth.
3
posted on
07/17/2014 6:55:58 AM PDT
by
demshateGod
(The fool hath said in his heart, There is no God.)
To: SeekAndFind
Queue? Are we still in the Commonwealth.
4
posted on
07/17/2014 6:55:58 AM PDT
by
demshateGod
(The fool hath said in his heart, There is no God.)
To: SeekAndFind
The prior week's claims were revised to show 1,000 more applications received than previously reported.And the sun came up today too.
5
posted on
07/17/2014 6:56:26 AM PDT
by
mykroar
(This is an insult to the nation's intelligence and these days, that isn't easy.)
To: rarestia
RE: I’m genuinely interested to see how bad it truly is/has been.
Things WERE really bad... but has it not occurred to you that things might actually be improving (although not at the pace we would like it to be )?
To: SeekAndFind
LOL! You are tilting against the FR windmills again... :-)
On housing (more my specialty than labor economics) here is a chart I put together this morning. the label is wrong as it should read 24-months instead of 36 but the point stands. Single family housing has been essentially flat for the last two years:

To: SeekAndFind
No, it hasn’t, but then I have a job. For those without, I’m sure things seem hopeless.
8
posted on
07/17/2014 7:00:57 AM PDT
by
rarestia
(It's time to water the Tree of Liberty.)
To: SeekAndFind
Philly fed just blew it out of the water
To: SeekAndFind
Remain calm... all is well!
10
posted on
07/17/2014 7:04:35 AM PDT
by
Common Sense 101
(Hey libs... If your theories fly in the face of reality, it's not reality that's wrong.)
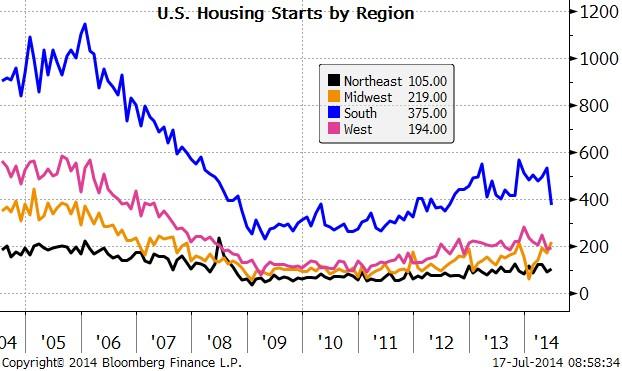
To: SeekAndFind
Interesting chart. South is the housing story:
To: Wyatt's Torch
The South’s gonna rise again!
12
posted on
07/17/2014 7:10:34 AM PDT
by
smokingfrog
( sleep with one eye open (<o> ---)
To: SeekAndFind
To: Wyatt's Torch
Cool huge image, but it runs out of the frame in various FR views. Try this instead:
<img src="http://4.bp.blogspot.com/-5bkLQbWb59k/U8fFuzuZS1I/AAAAAAAAfvk/YeT2yeM1cWo/s1600/WeeklyClaimsJuly172014.jpg" width="100%">

Using width="100%" gets you the entire chart no matter how the user's window is sized.
 |
Freedom ≠ Free Stuff☭ |
 |
| I, for one, welcome our new Cybernetic Overlords /. |
|
Mash Dobbshead® for HTML, bop Hello_Cthlhu for XAMPP
|
14
posted on
07/17/2014 8:10:48 AM PDT
by
Mycroft Holmes
(The fool is always greater than the proof.)
To: SeekAndFind
"The captain would like you to know that we are addressing the problem and that your next flight will be much better!"

15
posted on
07/17/2014 8:18:08 AM PDT
by
Caipirabob
(Communists... Socialists... Democrats...Traitors... Who can tell the difference?)
To: SeekAndFind
I am sure that “former” Microsoft employees are happy with the news.
To: SeekAndFind
Hard to buy a house when you’re maxing out at 28 hours a week.
17
posted on
07/17/2014 9:32:07 AM PDT
by
Night Hides Not
(Remember the Alamo! Remember Goliad! Remember Mississippi!)
To: Wyatt's Torch
OK, based on the chart, there seems to be LESS people being laid off...
Next question — how many of those laid off in the past have found jobs?
18
posted on
07/17/2014 9:34:17 AM PDT
by
SeekAndFind
(If at first you don't succeed, put it out for beta test.)
To: SeekAndFind
Here is the 4WMA of Continuing Claims:

To: Wyatt's Torch
So, based on the chart, people ARE finding jobs.
So, why are 92 Million people not in the workforce?
20
posted on
07/17/2014 11:40:02 AM PDT
by
SeekAndFind
(If at first you don't succeed, put it out for beta test.)
Navigation: use the links below to view more comments.
first 1-20, 21-32 next last
Disclaimer:
Opinions posted on Free Republic are those of the individual
posters and do not necessarily represent the opinion of Free Republic or its
management. All materials posted herein are protected by copyright law and the
exemption for fair use of copyrighted works.
FreeRepublic.com is powered by software copyright 2000-2008 John Robinson