On a monthly basis, retail sales increased 0.1% from December to January (seasonally adjusted), and sales were up 4.7% from January 2012. From the Census Bureau report:
The U.S. Census Bureau announced today that advance estimates of U.S. retail and food services sales for January, adjusted for seasonal variation and holiday and trading-day differences, but not for price changes, were $416.6 billion, an increase of 0.1 percent from the previous month and 4.4 percent above January 2012. ... The November to December 2012 percent change was unrevised from +0.5 percent.
Sales for December were unrevised at a 0.5% gain.
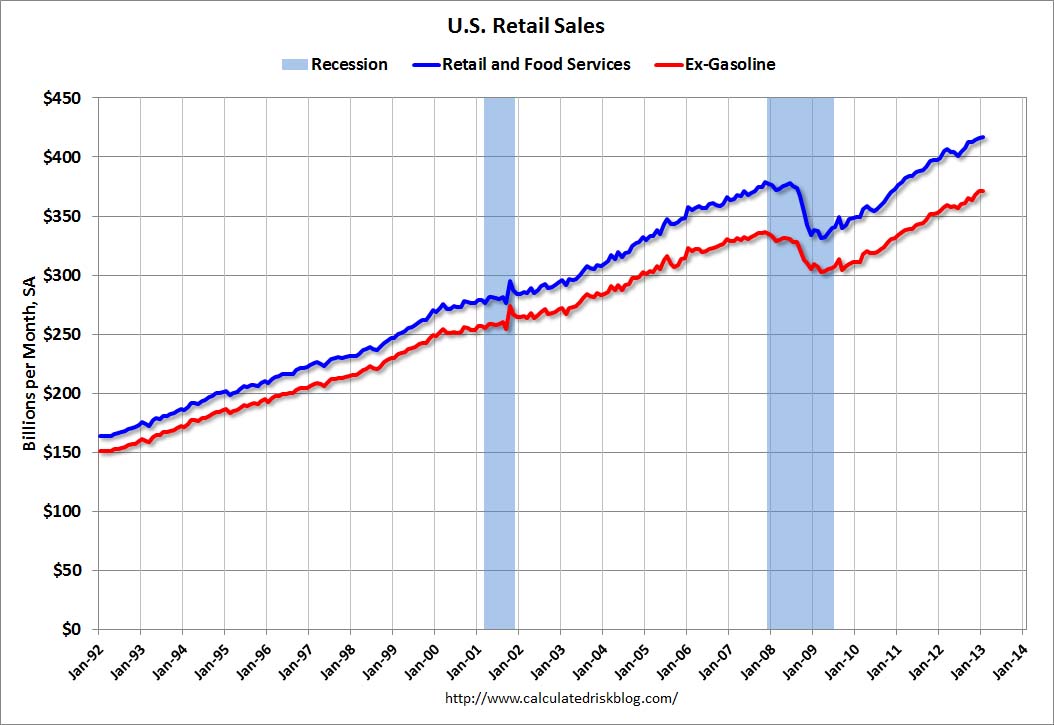
This graph shows retail sales since 1992. This is monthly retail sales and food service, seasonally adjusted (total and ex-gasoline).
Retail sales are up 25.7% from the bottom, and now 9.9% above the pre-recession peak (not inflation adjusted)
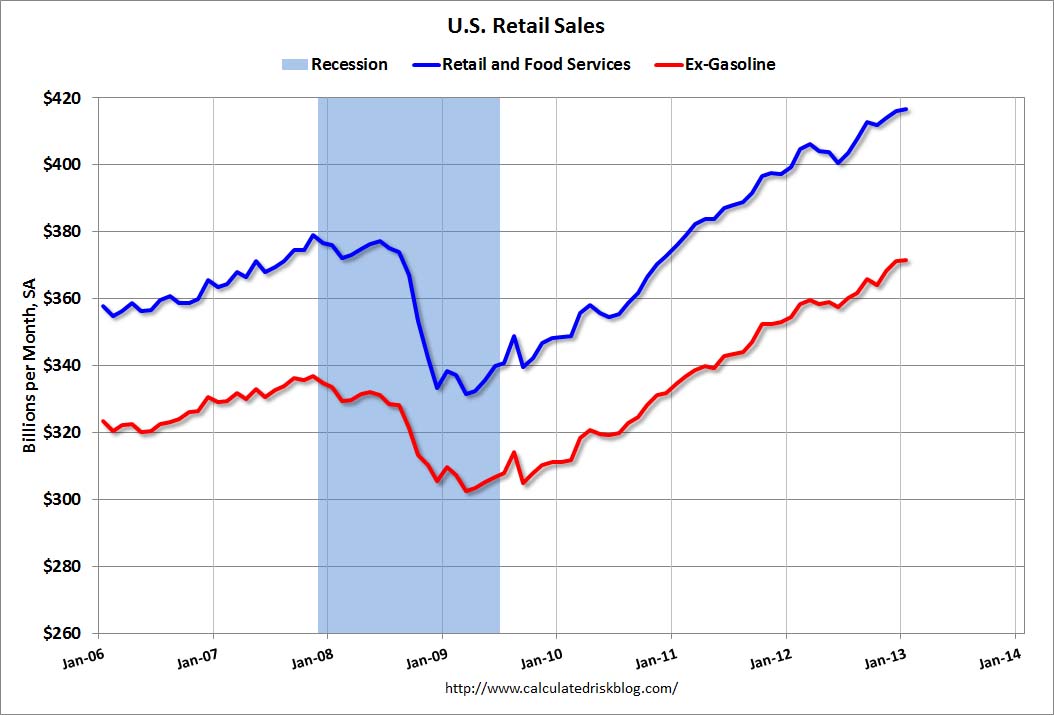
The second graph shows the same data, but just since 2006 (to show the recent changes).
Retail sales ex-autos increased 0.2%.
Excluding gasoline, retail sales are up 22.8% from the bottom, and now 10.3% above the pre-recession peak (not inflation adjusted).
The third graph shows the year-over-year change in retail sales and food service (ex-gasoline) since 1993.
Retail sales ex-gasoline increased by 4.8% on a YoY basis (4.4% for all retail sales).

Year-over-year change in Retail SalesThis was above the consensus forecast of a 0.1% increase, and might indicate some slowdown in retail spending growth related to the payroll tax increase.
Read more at http://www.calculatedriskblog.com/2013/02/retail-sales-increased-01-in-janaury.html#LAZWxgP7y8kzlV60.99