Posted on 10/24/2009 5:57:00 AM PDT by Son House
What Is It?
Macroeconomics is the study of the behavior of the economy as a whole.
Macroeconomic analysis broadly focuses on three things: national output (measured by gross domestic product (GDP)), unemployment and inflation. (For background reading, see The Importance Of Inflation And GDP.)
National Output: GDP
Output, the most important concept of macroeconomics, refers to the total amount of goods and services a country produces, commonly known as the gross domestic product. The figure is like a snapshot of the economy at a certain point in time.
When referring to GDP, macroeconomists tend to use real GDP, which takes inflation into account, as opposed to nominal GDP, which reflects only changes in prices. The nominal GDP figure will be higher if inflation goes up from year to year, so it is not necessarily indicative of higher output levels, only of higher prices.
The one drawback of the GDP is that because the information has to be collected after a specified time period has finished, a figure for the GDP today would have to be an estimate. GDP is nonetheless like a stepping stone into macroeconomic analysis. Once a series of figures is collected over a period of time, they can be compared, and economists and investors can begin to decipher the business cycles, which are made up of the alternating periods between economic recessions (slumps) and expansions (booms) that have occurred over time.
From there we can begin to look at the reasons why the cycles took place, which could be government policy, consumer behavior or international phenomena, among other things. Of course, these figures can be compared across economies as well. Hence, we can determine which foreign countries are economically strong or weak.
Based on what they learn from the past, analysts can then begin to forecast the future state of the economy. It is important to remember that what determines human behavior and ultimately the economy can never be forecasted completely.
Unemployment
The unemployment rate tells macroeconomists how many people from the available pool of labor (the labor force) are unable to find work. (For more about employment, see Surveying The Employment Report.)
Macroeconomists have come to agree that when the economy has witnessed growth from period to period, which is indicated in the GDP growth rate, unemployment levels tend to be low. This is because with rising (real) GDP levels, we know that output is higher, and, hence, more laborers are needed to keep up with the greater levels of production.
Inflation
The third main factor that macroeconomists look at is the inflation rate, or the rate at which prices rise. Inflation is primarily measured in two ways: through the Consumer Price Index (CPI) and the GDP deflator. The CPI gives the current price of a selected basket of goods and services that is updated periodically. The GDP deflator is the ratio of nominal GDP to real GDP. (For more on this, see The Consumer Price Index: A Friend To Investors and The Consumer Price Index Controversy.)
If nominal GDP is higher than real GDP, we can assume that the prices of goods and services has been rising. Both the CPI and GDP deflator tend to move in the same direction and differ by less than 1%. (If you'd like to learn more about inflation, check out All About Inflation.)
Demand and Disposable Income
What ultimately determines output is demand. Demand comes from consumers (for investment or savings - residential and business related), from the government (spending on goods and services of federal employees) and from imports and exports.
Demand alone, however, will not determine how much is produced. What consumers demand is not necessarily what they can afford to buy, so in order to determine demand, a consumer's disposable income must also be measured. This is the amount of money after taxes left for spending and/or investment.
In order to calculate disposable income, a worker's wages must be quantified as well. Salary is a function of two main components: the minimum salary for which employees will work and the amount employers are willing to pay in order to keep the worker in employment. Given that the demand and supply go hand in hand, the salary level will suffer in times of high unemployment, and it will prosper when unemployment levels are low.
Demand inherently will determine supply (production levels) and an equilibrium will be reached; however, in order to feed demand and supply, money is needed. The central bank (the Federal Reserve in the U.S.) prints all money that is in circulation in the economy. The sum of all individual demand determines how much money is needed in the economy. To determine this, economists look at the nominal GDP, which measures the aggregate level of transactions, to determine a suitable level of money supply.
Greasing the Engine of the Economy - What the Government Can Do
Monetary Policy
A simple example of monetary policy is the central bank's open-market operations. (For more detail, see the Federal Reserve Tutorial.) When there is a need to increase cash in the economy, the central bank will buy government bonds (monetary expansion). These securities allow the central bank to inject the economy with an immediate supply of cash. In turn, interest rates, the cost to borrow money, will be reduced because the demand for the bonds will increase their price and push the interest rate down. In theory, more people and businesses will then buy and invest. Demand for goods and services will rise and, as a result, output will increase. In order to cope with increased levels of production, unemployment levels should fall and wages should rise.
On the other hand, when the central bank needs to absorb extra money in the economy, and push inflation levels down, it will sell its T-bills. This will result in higher interest rates (less borrowing, less spending and investment) and less demand, which will ultimately push down price level (inflation) but will also result in less real output.
Fiscal Policy
The government can also increase taxes or lower government spending in order to conduct a fiscal contraction. What this will do is lower real output because less government spending means less disposable income for consumers. And, because more of consumers' wages will go to taxes, demand as well as output will decrease.
A fiscal expansion by the government would mean that taxes are decreased or government spending is increased. Ether way, the result will be growth in real output because the government will stir demand with increased spending. In the meantime, a consumer with more disposable income will be willing to buy more. A government will tend to use a combination of both monetary and fiscal options when setting policies that deal with the macroeconomy.
Conclusion
The performance of the economy is important to all of us. We analyze the macroeconomy by primarily looking at national output, unemployment and inflation. Although it is consumers who ultimately determine the direction of the economy, governments also influence it through fiscal and monetary policy.
Macroeconomic analysis broadly focuses on three things:
National Output: GDP
Output, the most important concept of macroeconomics, refers to the total amount of goods and services a country produces
Unemployment
The unemployment rate tells macroeconomists how many people from the available pool of labor (the labor force) are unable to find work.
Inflation
The third main factor that macroeconomists look at is the inflation rate, or the rate at which prices rise.
^^When they get to the part about 'What Government can do' be careful, they are not talking about the Bankrupt, Corrupt One
Adding a couple of more links to help explain hype in the market, ect.
Stock Market Capitalization To GDP Ratio
http://www.investopedia.com/terms/m/marketcapgdp.asp
A ratio used to determine whether an overall market is undervalued or overvalued.
Typically, a result of greater than 100% is said to show that the market is overvalued, while a value of around 50%, which is near the historical average for the U.S. market, is said to show undervaluation.
In recent years, however, determining what percentage level is accurate in showing undervaluation and overvaluation has been hotly debated.
In 2000, according to statistics at the World Bank the market cap to GDP ratio for the U.S. was 153%, a sign of an overvalued market. With the U.S. market falling sharply after the dotcom bubble burst, this ratio may have some predictive value in signaling peaks in the market.
However, in 2003, the ratio was around 130%, which was still overvalued but the market went on to produce all-time highs over the next few years.
There is only one way GDP has risen in Q3.....that is, if companies were building up inventories.
Nearly every major company reporting earnings stated Q3 revenues were lower than Q2...meaning fewer products were sold.
Unless those companies wanted to ‘stock up’, there was no need for increased production because there was no increasing demand.
Add in the rising unemployment numbers and you can see another reason why GDP will be negative in Q3.
What is GDP and why is it so important?
http://www.investopedia.com/ask/answers/199.asp
It represents the total dollar valueof all goods and services produced over a specific time period - you can think of it as the size of the economy. For example, if the year-to-year GDP is up 3%, this is thought to mean that the economy has grown by 3% over the last year.
^
any growth this quarter will be because of the BIG Shrink thanks to 110th and 111th United State Congress
You bring up a great point, ‘Private Sector Growth’,
which, the White House, Congress, and their leading economist in the state run media will try to fool us into thinking it grew any way they can(i.e. government spending)
“Stock Market Capitalization To GDP Ratio
http://www.investopedia.com/terms/m/marketcapgdp.asp
A ratio used to determine whether an overall market is undervalued or overvalued.
Typically, a result of greater than 100% is said to show that the market is overvalued, while a value of around 50%, which is near the historical average for the U.S. market, is said to show undervaluation.”
Very interesting. Theoretically, the value should be around 100%, not 50%. That says that historically, the stock market has been under invested.
You could make an argument the value should be somewhat higher than 100%, since market price is determined by past performance plus future expectations. In a rising market, it should be higher than 100%, and in a falling market, lower than 100%. With a historically expanding economy, the value should be at or above 100%.
Do you have a chart of this ratio over the years?
Lots of good links here for those who wish to learn more;
Gross Domestic Product - GDP
http://www.investopedia.com/terms/g/gdp.asp
GDP = C + G + I + NX
where:
“C” is equal to all private consumption, or consumer spending, in a nation’s economy
“G” is the sum of government spending
“I” is the sum of all the country’s businesses spending on capital
“NX” is the nation’s total net exports, calculated as total exports minus total imports. (NX = Exports - Imports)
Consumer Confidence: A Killer Statistic
http://www.investopedia.com/articles/fundamental/103002.asp
Consumer spending is the key to any market economy. On the airwaves, there’s never a shortage of data, analysis and cable commentary regarding consumer behavior.
Depending on the economy’s sheer breadth, consumer spending can range anywhere from 50-75% of gross domestic product (GDP). In the U.S. and most highly industrialized nations, this percentage is about 65% of total spending.
Consumer Sentiment
The two numbers expressing consumers’ feelings about the economy and their subsequent plans to make purchases are the Consumer Confidence Index (CCI), prepared by the Conference Board, and the Consumer Sentiment Index, prepared by the University of Michigan. Both indexes are based on a household survey and are reported on a monthly basis.
Business Spending: A Leading Indicator
Though not as powerful an indicator as consumer spending, business capital spending can be a killer statistic - since things can get ugly in a hurry when overall business investment precipitously cuts back: the impact on the economy can be felt at an even faster pace than if the cut occurred purely along consumer lines.
Other Spending Items
There are other spending indicators, such as purchases of durable goods orders and overall auto sales; however, in terms of aggregating the data, these metrics are narrowly defined extensions of overall individual consumption. Trends across personal consumption will usually be reflected and correlated across these two metrics as well as others.
Economic Indicators: Overview[tutorial-several links]
http://www.investopedia.com/university/releases/default.asp
Economic indicators can have a huge impact on the market; therefore, knowing how to interpret and analyze them is important for all investors. In this tutorial, we’ll cover some of the most important economic indicators. You’ll learn where to find them, how to read them and what they can tell you about he health of the economy - and your investments.
Government spending makes up a 4th of the equation? Sheesh, I guess economists have their reasons, I think I would put a minus in front of the G.
“Cheap money is a stimulant, also an intoxicant. If the dose is large enough, a substantial temporary effect can be brought about, but headaches follow. If the matter really were that simple, everybody could be an economist, and only the perversity of central banks would keep us from endless prosperity.
Merchants and manufacturers will not be induced to increase borrowings, since interest on money borrowed is only one small factor in total costs. But if merchants and manufacturers will not use cheap money, speculators will”. Benjamin Anderson, Chief Economist of Chase National Bank, New York Times, April 1930
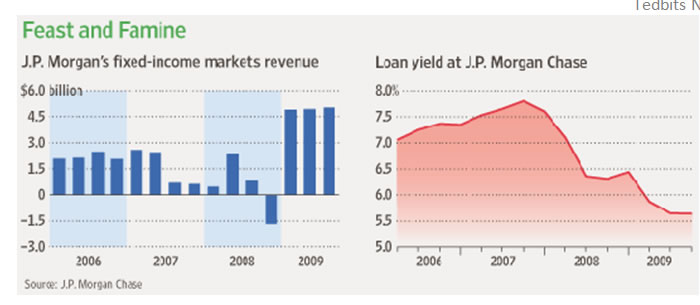
This could have been written YESTERDAY. Goldman, er…Government Sachs, JPMorgan Chase and Citigroup have now all reported earnings, and guess what? Profits and revenues from core banking activities are almost non-existent; profits now come from speculation using GOVERNMENT money at zero interest rates. The markets for securitized lending are closed so the banks can no longer pass consumer and small business lending to third-party INVESTORS. They must hold the loans on their books and for the most part they are REFUSING to do so.
So, instead of lending to Main Street, the big banks are borrowing overnight from the Federal Reserve and buying Treasuries to absorb the huge budget deficits and put a bid into the bond market with a wink and a nod from the Central Bank. Take a look at the revenue streams from JPMorgan Chase.
What difference does truth make? Just lie. Nobody will know the difference and the few that do will be marginalized and destroyed. Social deviants who cause trouble ala Glenn Beck...
As if we can trust any number coming out of this Administration.
look at the DOW, based on NOTHING, but a psychological deception to make people ‘feel’ better.
Not quite right. Tax rates have not been increased and tax revenues are down due to the recession. This is CHINESE money, folks and, some day, they will want it back. One billion Chinese, 150 million American conservatives. Guess who looses? Welcome to the Maoist Revolution where American minorities get to kick white people in the ....
What's the theory here? Could you expand?
It's not just economics but even basics of how the main institutions work. Even "conservatives" on this forum often think that corporations that get TARP money keep it in the basements of their buildings, as if it were not the millions of shareholders --- retirees, widows and orphans --- that were actually bailed out.
Americans used to understand such matters. Our schools were unsurpassed in 1800s. And even more recently: just look at history tests, for instance, that high school students took in 1930s. Most college students I know would fail those today.
You appear to dismiss poor education and indifference of students as an immutable fact. If so, no political meaures would help. Our economic prospects depend on our values, and the latter are broken.
150 million American conservatives. Guess who looses?
^
The productive that actually have to work and pay taxes
Disclaimer: Opinions posted on Free Republic are those of the individual posters and do not necessarily represent the opinion of Free Republic or its management. All materials posted herein are protected by copyright law and the exemption for fair use of copyrighted works.