Skip to comments.
History of Energy in the United States (Excellent Charts)
REAL CLEAR POLITICS
| 09.24.09
| staff
Posted on 09/26/2009 6:21:03 AM PDT by kellynla
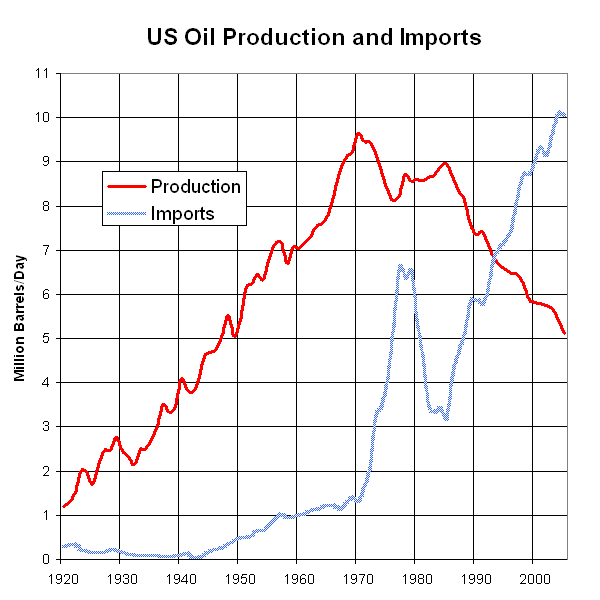
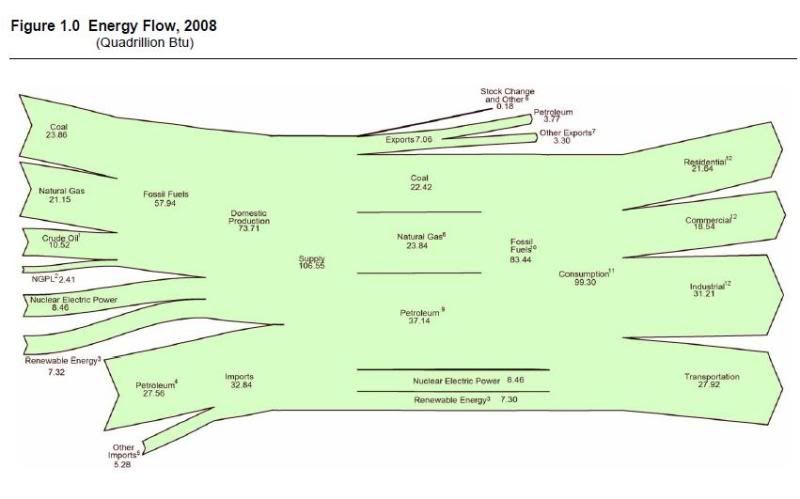
The United States was self-sufficient in energy until the late 1950s when energy consumption began to outpace domestic production. At that point, the nation began to import more energy to fill the gap. In 2008, net imported energy accounted for 26 percent of all energy consumed.
TOPICS: Business/Economy; Culture/Society; Extended News; Foreign Affairs
KEYWORDS: energy; gas; missinglink; oil; petroleum
Navigation: use the links below to view more comments.
first 1-20, 21-23 next last
1
posted on
09/26/2009 6:21:04 AM PDT
by
kellynla
2
posted on
09/26/2009 6:21:54 AM PDT
by
kellynla
(Freedom of speech makes it easier to spot the idiots! Semper Fi!)
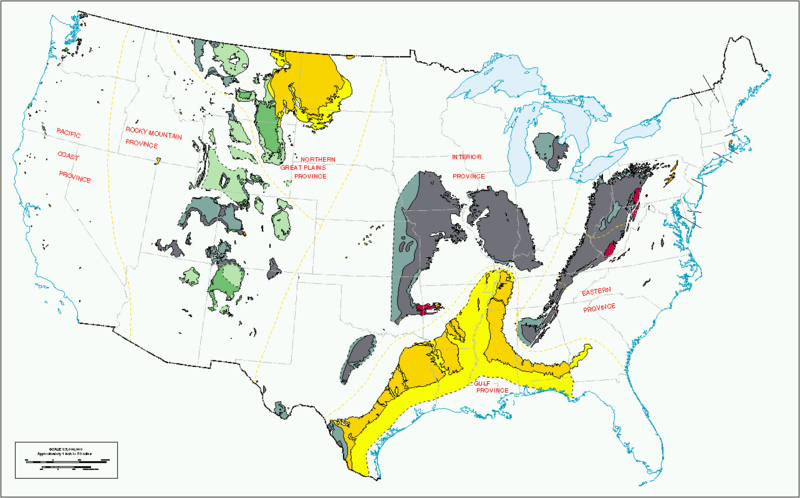
The U.S. derives about a quarter of its energy from coal, which generates more than half of the electricity used in the country. Between 1885 and 1951, coal was the leading source of domestically-produced energy and it has regained and maintained that status since 1984. The U.S. coal production has doubled since the 1950s and now burns over 1 billion tons of coal every year. But despite being self-sufficient with several hundred years of supply, the U.S. nevertheless has started to curtail coal energy production due to concerns about global warming.
3
posted on
09/26/2009 6:24:05 AM PDT
by
kellynla
(Freedom of speech makes it easier to spot the idiots! Semper Fi!)
To: kellynla
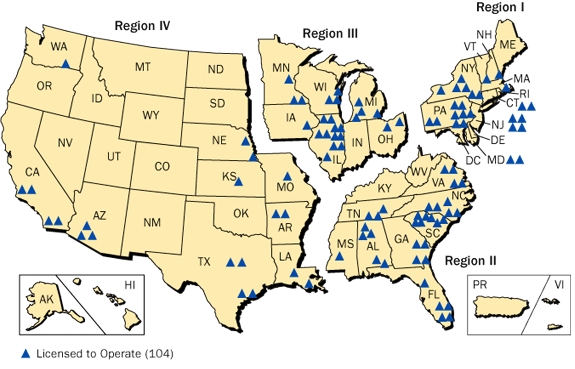
Nuclear power accounts for about 20 percent of U.S. electricity consumption but less than 10 percent of overall energy supply (as compared to France, which derives nearly 80 percent of its electricity from nuclear power). Currently, there are just over 100 nuclear power plants in operation in the U.S. The 1979 Three Mile Island accident was a turning point in the history of nuclear power for domestic use in the U.S. At the time of accident, 129 nuclear power plants had been approved; of those, only 53 were completed as federal requirements became more stringent, local opposition became more strident, and construction times were significantly lengthened.
5
posted on
09/26/2009 6:25:15 AM PDT
by
kellynla
(Freedom of speech makes it easier to spot the idiots! Semper Fi!)
To: kellynla
Not to mention all of this time, huge amounts of money being wasted on wind and solar “power” will contribute vastly to this mess.
Get ready for electrical prices to do what ObaMao himself promised. They will “NECESSARILY” skyrocket.
6
posted on
09/26/2009 6:26:17 AM PDT
by
PSYCHO-FREEP
(Give me LIBERTY or give me an M-24A2!)
Hydroelectricity accounts for about 6 percent of all electricity output in the United States. The oldest continuously-operated commercial hydroelectric plant in the U.S. is built on the Hudson River at Mechanicville, N.Y., which went online in July 1898. The Grand Coulee Dam on the Colorado River in Washington state, which went into service in June 1942, is the largest power-producing facility in the U.S. and the seventh-largest in the world.

7
posted on
09/26/2009 6:26:31 AM PDT
by
kellynla
(Freedom of speech makes it easier to spot the idiots! Semper Fi!)
To: thackney
8
posted on
09/26/2009 6:28:00 AM PDT
by
kellynla
(Freedom of speech makes it easier to spot the idiots! Semper Fi!)
To: kellynla
Thanks Kellynal!
9
posted on
09/26/2009 6:28:44 AM PDT
by
Traveler59
(Truth is a journey, not a destination.)
To: PSYCHO-FREEP
The article covers solar & wind too. There are 9 pages of charts & data.
10
posted on
09/26/2009 6:29:15 AM PDT
by
kellynla
(Freedom of speech makes it easier to spot the idiots! Semper Fi!)
To: kellynla
Why do most other energy reports give the use of coal at between 50 and 65% of our energy sources? 25% is simply not correct.
11
posted on
09/26/2009 6:29:18 AM PDT
by
PSYCHO-FREEP
(Give me LIBERTY or give me an M-24A2!)
To: kellynla
Thanks for the post. I snitched your charts for future use!
Here is an interesting one that shows the relation between GDP growth and energy consumption. It helps show how more efficient energy use is today, compared to earlier periods.
12
posted on
09/26/2009 6:30:30 AM PDT
by
A.Hun
(Common sense is no longer common.)
To: kellynla
The ONLY reason consumption is bigger than production is Environmentalism and wingnut green laws that forbid drilling and mining.
13
posted on
09/26/2009 6:34:44 AM PDT
by
BuffaloJack
(Obama, you stop lying; we'll stop callin' you a LIAR.)
To: A.Hun
Thanks for posting. In the first part of the 19th century there was a movement to have engineers run the country with governing decisions based on the laws of thermodynamics.
Perhaps Hoover, being an engineer, put an end to that idea.
14
posted on
09/26/2009 7:01:07 AM PDT
by
Moonman62
(The issue of whether cheap labor makes America great should have been settled by the Civil War.)
To: Moonman62
You’re welcome. I like using it when moonbats claim we are such energy hogs. We consume a lot of energy, but its because of our size!
15
posted on
09/26/2009 7:07:18 AM PDT
by
A.Hun
(Common sense is no longer common.)
To: Moonman62
The coal chart is misleading. Much of the western Illinois Basin coal in Iowa, Illinois and Missouri simply is either not there or unmineable because it’s too deep or too thin. Before a mine is opened, a miner doesn’t want to go exploring with a dragline. Drilling at quarter mile or less intervals in a requirement.
To: PSYCHO-FREEP; kellynla
Why do most other energy reports give the use of coal at between 50 and 65% of our energy sources? 25% is simply not correct. You are probably talking about electrical power generation, which is just less than 50%. ~25% represents total energy including transportation fuel.
US Electric Power Industry Net Generation, 2007

from: Electric Power Industry 2007: Year in Review
http://www.eia.doe.gov/cneaf/electricity/epa/epa_sum.html
- - - - - -
Or shown as:
U.S. Primary Energy Consumption by Source and Sector, 2008

From: State and U.S. Historical Data, EIA
http://www.eia.doe.gov/overview_hd.html
17
posted on
09/26/2009 11:15:48 AM PDT
by
thackney
(life is fragile, handle with prayer)
To: kellynla
...129 nuclear power plants had been approved; of those, only 53 were completed as federal requirements became more stringent, local opposition became more strident, and construction times were significantly lengthened.
Remember the old "Shake N Bake" commercial?
 "And mah intrust rates halped!"
18
posted on
09/28/2009 11:05:32 AM PDT
by
fallujah-nuker
(America needs more SAC and less empty sacs from Goldman-Sachs.)
To: kellynla
Thank Nixon and the enviros for the reduction in production (channeling Jesse Jackson).
19
posted on
09/29/2009 5:22:43 AM PDT
by
1010RD
(First Do No Harm)
To: kellynla; Carry_Okie
Great thread. Very useful charts.
Appreciate the post. ‘Pod.
20
posted on
09/29/2009 5:25:28 AM PDT
by
sauropod
(People who do things are people that get things done.)
Navigation: use the links below to view more comments.
first 1-20, 21-23 next last
Disclaimer:
Opinions posted on Free Republic are those of the individual
posters and do not necessarily represent the opinion of Free Republic or its
management. All materials posted herein are protected by copyright law and the
exemption for fair use of copyrighted works.
FreeRepublic.com is powered by software copyright 2000-2008 John Robinson