Skip to comments.
#AGU14 NASA’s Orbiting Carbon Observatory shows surprising CO2 emissions in Southern Hemisphere
Wattsupwiththat.com ^
| December 20, 2014
| Anthony Watts
Posted on 12/21/2014 9:42:09 PM PST by Ernest_at_the_Beach
click here to read article
Navigation: use the links below to view more comments.
first 1-20, 21-31 next last
To: Ernest_at_the_Beach
Carbon dioxide concentrations are highest above northern Australia I may just misunderstand the map, but I can't see this...
2
posted on
12/21/2014 9:47:44 PM PST
by
naturalman1975
("America was under attack. Australia was immediately there to help." - John Winston Howard)
To: Ernest_at_the_Beach
Sure that screenshot doesn’t just correspond with higher temperatures because the heaviest co concentrations seem to be near the equator...
To: Ernest_at_the_Beach
It would seem that despite the GW alarmist claims, it is not the US that is putting high levels of CO2 in the atmosphere.
4
posted on
12/21/2014 9:50:41 PM PST
by
UCANSEE2
(Lost my tagline on Flight MH370. Sorry for the inconvenience.)
To: Tolerance Sucks Rocks; SunkenCiv; Oldeconomybuyer; NormsRevenge; Marine_Uncle; TigersEye; ...
To: Ernest_at_the_Beach
“Carbon dioxide in the atmosphere has no distinguishing features to show what its source was.”
OMG!! What an agenda killer statement! They always swear to God/gods/Gaia/satan that it’s all manmade and they need trillions of dollars from puking disgusting epic fail mankind to “fix” it!
Morons. Humans are definitely in epic fail mode, but it’s not because of naturally occurring gases on the planet.
6
posted on
12/21/2014 9:56:53 PM PST
by
bluejean
(The lunatics are running the asylum)
To: Ernest_at_the_Beach
With the exception of China, all of those areas seem to be either jungle, or Volcanic.
Imagine THAT ONE, eh??
This does not fit the pre-approved liberal echowhacko narrative!
7
posted on
12/21/2014 9:57:23 PM PST
by
tcrlaf
(They told me it could never happen in America. And then it did....)
To: naturalman1975
You can’t see it? It is right there over Indonesia.
8
posted on
12/21/2014 9:57:26 PM PST
by
Kirkwood
(Zombie Hunter)
To: UCANSEE2
At least it is now clear as day that we Americans are NOT the cause for “global warming”
9
posted on
12/21/2014 10:02:22 PM PST
by
__rvx86
(This Tagline is gluten-free.)
To: Kirkwood
Which is not ‘over northern Australia’. It’s over Indonesia.
I don’t understand.
10
posted on
12/21/2014 10:02:53 PM PST
by
naturalman1975
("America was under attack. Australia was immediately there to help." - John Winston Howard)
To: Kirkwood; naturalman1975
Must be from wood burning stoves there,
To: Ernest_at_the_Beach
Lookit all that CO2 over the Amazon Rainforest...welp, those darn trees are just gonna have to go! Tree-made Grobull Warming!
12
posted on
12/21/2014 10:05:10 PM PST
by
bigbob
(The best way to get a bad law repealed is to enforce it strictly. Abraham Lincoln)
To: Ernest_at_the_Beach
It's the penguins!!! Kill them all to save the earth!!!
13
posted on
12/21/2014 10:08:22 PM PST
by
dalereed
To: Ernest_at_the_Beach
"Over the next few months, the team will refine the OCO-2 data"
...so they will more closely satisfy obama administration requirements.
To: Ernest_at_the_Beach
I'm looking at the maps
on this page:
Especially to this one:
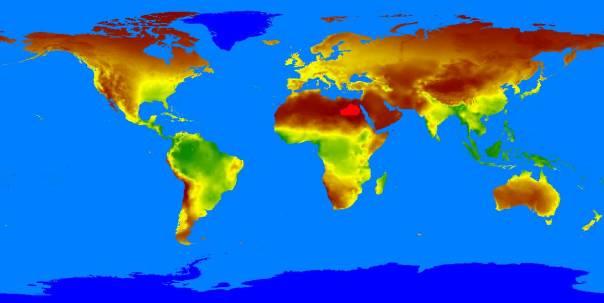
which is said to show Net Primary Production from 1951-2001.
As I understand it, NPP shows where most carbon dioxide is turned by photoynthesis into chemical energy.
To my completely layman eyes, it looks like the areas that the map you've shared here, matches this NPP map pretty well.
And that to me would seem to suggest a mechanism by which CO2 concentrates in the areas of the world where it does the most good.
I'm not an expert of any sort on this. I just notice this and wonder what is going on. I may be completely misunderstanding both maps.
15
posted on
12/21/2014 10:13:24 PM PST
by
naturalman1975
("America was under attack. Australia was immediately there to help." - John Winston Howard)
To: Ernest_at_the_Beach
rainforests cause global warming
16
posted on
12/21/2014 10:21:43 PM PST
by
GeronL
(Vote for Conservatives not for Republicans)
To: naturalman1975
From the comments:
**************************************************EXCERPT*************************************
To: naturalman1975
Preceding comments to what I poated im #17:
***********************************EXCERPT**************************************
Tom J says:
The revenue generating mystery novel needs a mysterious, and changing villain if the public is to be constantly coaxed into dispensing hard earned money.
To: tcrlaf
With the exception of China, all of those areas seem to be either jungle, or Volcanic. Make the ...Used to be jungle....
The high CO2 in southern hemisphere and around Indonesia is because of burning off jungle to plant palm oil trees.....so the greenies can use non crude oil derivtives inb their cars.

Above shows deforestation regions.

Above shows typical palm oil plantation on former jungle.
19
posted on
12/21/2014 10:43:26 PM PST
by
spokeshave
(He has erected a multitude of New Offices, and sent hither swarms of Officers to harass our people,)
To: spokeshave
Now that is super interesting!
Navigation: use the links below to view more comments.
first 1-20, 21-31 next last
Disclaimer:
Opinions posted on Free Republic are those of the individual
posters and do not necessarily represent the opinion of Free Republic or its
management. All materials posted herein are protected by copyright law and the
exemption for fair use of copyrighted works.
FreeRepublic.com is powered by software copyright 2000-2008 John Robinson

