Free Republic
Browse · Search
General/Chat
Topics · Post Article

Skip to comments.

Arctic Sea Ice - Daily Comparison
University of Illinois at Urbana-Champaign ^ | Daily | Department of Atmospheric Sciences, UI-UC

Posted on 06/30/2008 10:40:39 AM PDT by CedarDave

Over the past few days, a plethora of articles have been published saying that Arctic ice is melting at a faster rate than last year, which was a recent historical record, and the North Pole will soon be ice free. The graphic below and link to this thread show the opposite:

Compare (Arctic) Daily Sea Ice

Associated web page:

The Cryosphere Today

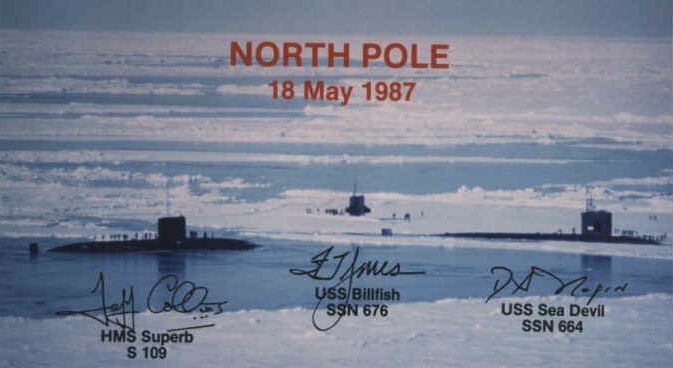
As for the North Pole being ice free, there are openings in the sea ice that don't mean the entire surrounding area is free of ice:

The Top of the World: Is the North Pole Turning to Water?


TOPICS: Science; Weather
KEYWORDS: arctic; arcticice; arcticseaice; climatechange; environment; globalwarming; northpole
Navigation: use the links below to view more comments.
first 1-2021-31 next last
Visit the links and judge for yourself whether the latest pronouncements about global warming of the Aarctic are just the most recent Chicken Little cries of the global warming crowd. Save the link to the Daily Sea Ice web page and bring it up every time you hear hand-wringing by the gloom and doom crowd, and educate them.
1 posted on 06/30/2008 10:40:39 AM PDT by CedarDave
[ Post Reply | Private Reply | View Replies]

To: CedarDave

Hmmm...
missed the spelling error:
Aarctic=Arctic


2 posted on 06/30/2008 10:43:15 AM PDT by CedarDave
[ Post Reply | Private Reply | To 1 | View Replies]

To: CedarDave
The Left refuses to be educated on this issue. But congrats for trying!

By the way, notice the ice still on Hudson Bay this year. It wasn't there last year. Great visual.

3 posted on 06/30/2008 10:45:48 AM PDT by Flycatcher (Strong copy for a strong America)
[ Post Reply | Private Reply | To 1 | View Replies]

To: steelyourfaith; xcamel

Global warming PING!!


4 posted on 06/30/2008 10:50:50 AM PDT by CedarDave
[ Post Reply | Private Reply | To 1 | View Replies]

To: CedarDave; Killing Time; Beowulf; Mr. Peabody; RW_Whacko; honolulugal; SideoutFred; Ole Okie; ...


FReepmail me to get on or off
Click on POGW graphic for full GW rundown
Dr. John Ray's
GREENIE WATCH

The Great Global Warming Swindle Video - Back On The Net!!(Mash Here!)


5 posted on 06/30/2008 10:53:22 AM PDT by xcamel (Being on the wrong track means the unintended consequences express train doesnt kill you going by)
[ Post Reply | Private Reply | To 1 | View Replies]

To: Flycatcher

Thanks. A visual view of the ice sheet’s extent beats graphs and words. Be sure to play with the interactive and view how last year’s ice diminished through the summer and into early fall.

BTW, light purple is 80% sea ice concentration; dark purple increases toward 100% ice coverage.


6 posted on 06/30/2008 10:55:40 AM PDT by CedarDave
[ Post Reply | Private Reply | To 3 | View Replies]

To: CedarDave
Another link with additional data. There should be a June update by July 6-7 (the May update was on June 3, but with a holiday on the 4th, they might opt to wait until the next week).

Arctic Sea Ice News and Analysis

7 posted on 06/30/2008 11:05:10 AM PDT by cogitator
[ Post Reply | Private Reply | To 1 | View Replies]

To: cogitator

RE: Arctic Sea Ice News and Analysis

From that web site:

“Although ice extent is slightly greater than this time last year, the average decline rate through the month of May was 8,000 square kilometers per day (3,000 square miles per day) faster than last May. Ice extent as the month closed approached last May’s value.”

I don’t know how they figure that, nor do I know how they confidently extrapolate that into a complete melt projection. The pictures in this thread seem to indicate, regardless of this analysis claims, that sea ice is still greater this year at the end of June.

Go figure!


8 posted on 06/30/2008 12:11:05 PM PDT by Thickman (Term limits are the answer.)
[ Post Reply | Private Reply | To 7 | View Replies]

To: CedarDave

It would be nice if legends accompanied the various sea ice graphics that get posted on FR. It’s hard to make heads or tails if the colors are not explained.


9 posted on 06/30/2008 12:13:24 PM PDT by Thickman (Term limits are the answer.)
[ Post Reply | Private Reply | To 1 | View Replies]

To: CedarDave
Here is North Pole sub picture from March 17, 1959, a time of the year when the Pole should be (and is today) completely frozen solid. Sub is the US SSN Skate.


10 posted on 06/30/2008 12:19:31 PM PDT by JustDoItAlways
[ Post Reply | Private Reply | To 1 | View Replies]

To: CedarDave
Here is satellite picture of the NorthWest Passage from yesterday (June 29, 2008). Good luck to all global warming believing Mariners out there.

It might open up near the end of August for a few weeks. Park your ship off Baffin Island now, wait six weeks and take your chances.


11 posted on 06/30/2008 12:26:40 PM PDT by JustDoItAlways
[ Post Reply | Private Reply | To 1 | View Replies]

To: Thickman
It would be nice if legends accompanied the various sea ice graphics that get posted on FR. It’s hard to make heads or tails if the colors are not explained.

Sorry if you can not see the legend; it is at the upper left of the graphic:

For Firefox, click "View Image" then "+" and scroll to the upper left where the color code is explained.

For IE-6, I don't see any easy way to enlarge the picture (the "show picture" tab is grayed out) though you might try saving the picture and viewing on Windows Picture Viewer.

Or you might go to the UI-UC website and see if you can work with their images.

12 posted on 06/30/2008 12:34:33 PM PDT by CedarDave
[ Post Reply | Private Reply | To 9 | View Replies]

To: CedarDave

It looks like the Navy doesn’t like external links. Here is the page with various other pictures of Subs at the North Pole including the USS Skate.

http://www.navsource.org/archives/08/08578.htm


13 posted on 06/30/2008 12:35:43 PM PDT by JustDoItAlways
[ Post Reply | Private Reply | To 1 | View Replies]

To: JustDoItAlways

JDIA,
Missing your picture...


14 posted on 06/30/2008 12:38:02 PM PDT by CedarDave
[ Post Reply | Private Reply | To 10 | View Replies]

To: JustDoItAlways

Got it! Thanks


15 posted on 06/30/2008 12:45:22 PM PDT by CedarDave
[ Post Reply | Private Reply | To 14 | View Replies]

To: CedarDave; WL-law; Genesis defender; proud_yank; FrPR; enough_idiocy; rdl6989; IrishCatholic; ...
Thanx !


Beam me to Planet Gore !

16 posted on 06/30/2008 1:04:32 PM PDT by steelyourfaith
[ Post Reply | Private Reply | To 4 | View Replies]

To: CedarDave

Just a side note,,,,

If I recall correctly, about a week ago was a posting that there were some new and gigantic volcanos forming up on the undersea ridge between the top of Greenland and Russia.........

You dont suppose that perhaps thousands of cubic miles of molten lava could increase the polar sea temp just a little bit, could it?


17 posted on 06/30/2008 1:10:58 PM PDT by Concho (IRS--Americas real terrorist organization.)
[ Post Reply | Private Reply | To 14 | View Replies]

To: Concho
You don't suppose that perhaps thousands of cubic miles of molten lava could increase the polar sea temp just a little bit, could it?

I'm sure it does, but of course the MSM doesn't say much about that because it's unlikely any change could be easily quantified and they don't want anything to dilute their gloomy message. Of course man-made global warming can't be quantified either, except by their garbage-in garbage-out computer models, but that doesn't stop them from saying we humans are to blame.

18 posted on 06/30/2008 1:22:40 PM PDT by CedarDave
[ Post Reply | Private Reply | To 17 | View Replies]

To: steelyourfaith

I love the interactive photos on this site. You can compare any two dates back to 1979.

BTW, they just updated the site with today’s photograph (June 30, 2008).


19 posted on 06/30/2008 1:28:35 PM PDT by CedarDave
[ Post Reply | Private Reply | To 16 | View Replies]

To: Thickman
“Although ice extent is slightly greater than this time last year, the average decline rate through the month of May was 8,000 square kilometers per day (3,000 square miles per day) faster than last May. Ice extent as the month closed approached last May’s value.”

They are probably doing it with some kind of satellite algorithm, but there are no details readily available.

This winter there was a significant freeze/formation of first-year ice; this ice will be the fastest to melt, so if there was more ice cover at the "height of winter" than last year, and temperatures following roughly the same summer warming trend, then there is a probably a larger area of ice amenable to faster melting now than at a comparable time last year.

20 posted on 06/30/2008 2:12:53 PM PDT by cogitator
[ Post Reply | Private Reply | To 8 | View Replies]


Navigation: use the links below to view more comments.
first 1-2021-31 next last

Disclaimer: Opinions posted on Free Republic are those of the individual posters and do not necessarily represent the opinion of Free Republic or its management. All materials posted herein are protected by copyright law and the exemption for fair use of copyrighted works.

Free Republic
Browse · Search
General/Chat
Topics · Post Article

FreeRepublic, LLC, PO BOX 9771, FRESNO, CA 93794
FreeRepublic.com is powered by software copyright 2000-2008 John Robinson