To: RomanSoldier19
Claim That Sea Level Is Rising Is a Total Fraud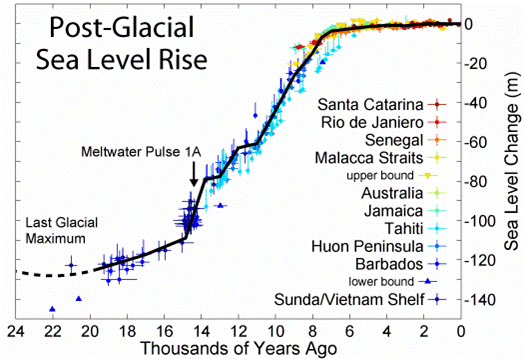
Sea levels began to rise 18k years ago at the end of the last glacial period. They have risen about 135 meters since then which is an average of 7.5 millimeters per year. That is an average of 750 mm per century (29.5 inches) which is far more than the average over the last century. As the chart shows most of that rise was over about 8k years ago.
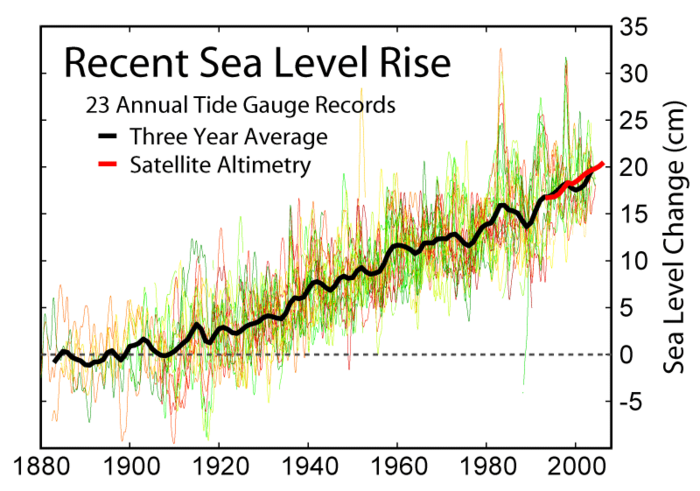
From 1880 to 2000 sea level rose about 20 cm or just under 8 inches. Far less than the nearly 30 inches per century average over the last 18,000 years.
The most recent data from NASA shows a decline in sea level.
Inconvenient: NASA shows global sea level…pausing, instead of rising

16 posted on
12/19/2021 7:21:34 PM PST by
TigersEye
(Ray Epps didn't kill himself.)
To: TigersEye
talking about sea raise
Fingerprint Of A Global Cataclysm 12,800 Years Ago ...
[Search domain grahamhancock.com] https://grahamhancock.com › ancient-cataclysm-hancock
Fingerprint Of A Global Cataclysm 12,800 Years Ago. The graphic shows the vast swathe of our planet that geologists call the Younger Dryas Boundary Field. Across this huge “fingerprint” spanning North America, Central America, parts of South America, most of Europe and parts of the Middle East as well, the tell-tale traces of multiple ...
24 posted on
12/19/2021 7:25:50 PM PST by
RomanSoldier19
(Res ad Triarios venit)
To: TigersEye
Yes, we are nearing the peak of an inter-glacial phase …
53 posted on
12/19/2021 8:08:48 PM PST by
dodger
To: TigersEye
100 posted on
12/20/2021 5:49:07 AM PST by
Robert A Cook PE
(Method, motive, and opportunity: No morals, shear madness and hatred by those who cheat.)
FreeRepublic.com is powered by software copyright 2000-2008 John Robinson