
Posted on 11/07/2020 7:49:30 PM PST by DoughtyOne
Edited on 11/07/2020 7:54:00 PM PST by Sidebar Moderator. [history]
PING LIST - Please contact me as needed...
COVID-19 Update # 234
As of 11/06/2020 23:15 PDST United States CDC - Provisional Numbers
As of 00/00/2020 23:45 PDST Johns Hopkins University - Capture Nations Informaton
As of 00/00/2020 23:45 PDST Johns Hopkins University - Capture Counties Information
As of 00/00/2020 23:46 PDST Johns Hopkins University - Process JHU Data
As of 00/00/2020 23:59 PDST WorldofMeters - Document Core Numbers
As of 00/00/2020 23:59 PDST WorldofMeters - Capture Nations Information
As of 00/00/2020 23:59 PDST WorldofMeters - Capture States Information
As of 00/00/2020 00:00 PDST WorldofMeters - Data Processing begins...
As of 00/00/2020 ??:?? PDST Publish COVID-19 Update - 00/00/00
Thank you for stopping by to check out the COVID-19 Update.
Here you can find...
Section: 01 Commentary, Special Reports, COVID-19 Update Info, & System Notes
Section: 02 the United States Situation
Section: 03 the Global Community Situation Outside China
Section: 04 the Global Community Situation Including China with reservations
Section: 05 the Mortality Report
Section: 06 Miscellaneous Reports of Interest
Section: 07 the United States, Counties (alphabetical / case no descending)
Section: 08 the United States, States Ranking, Provisional Numbers, & Territories
Section: 09 the United States, Ranked with Other Nations
Section: 10 the End of this COVID-19 Update
Section: 11 Data Sources and a Link to My Own Spreadsheet
Section: 12 Linked Spreadsheet: Counties, States, Provisional, Territories, & Nations
Section: 13 Links to Other Resources
Section: 01
Commentary, Special Reports, and COVID-19 Update Information4
Interesting Tid-bits (hopefully)
Fatalities and New Cases in the United States
Fatalities rose by 29 cases from the previous day, to come in at 1,213
yesterday. That was 23.52% higher than the same day the previous
week.
New Cases rose by 9,093 from the day before, to come in at 133,452
yesterday. That was 28.90% higher than the same day the week before.
This was our highest day for declaring New Cases.
Fatalaties and New Cases on the Global Scene
Fatalities rose by 985 cases from the previous day, to come in at 9,403
yesterday. That was 26.08% higher than the same day the previous week.
New Cases rose by 66,490 cases from the day before, to come in at 651,192
yesterday. This was 13.87% higher than the same day the week before.
I had just said that I wasn't seeing the same strength I had been seeing
in the number in the previous report. Then this very large new record
took place yesterday. Yikes!
Global Milestones
On the Global Scene we grew above 13 million Active Cases.
United States' Milestones
Here in the United States we declard our 10 millionth New Case yesterday.
Currently we have 3,425,272 Active Cases.

Section: 02
The Following Addresses the Numbers Here in
the United States of America
Here we go...
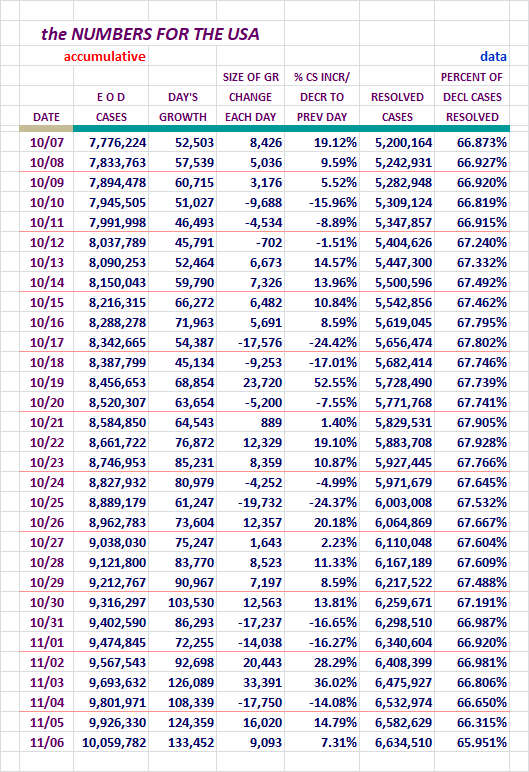
New Case Declarations rose by 9,093 cases yesterday.
Please take note of the Resolved Percentage level on the right.
It has been falling recently.
The number is significant enough now to take note of it daily now.
Concept of adding in Active Cases and Serious Critical here, courtesy of amorphous
Here are more of our numbers...
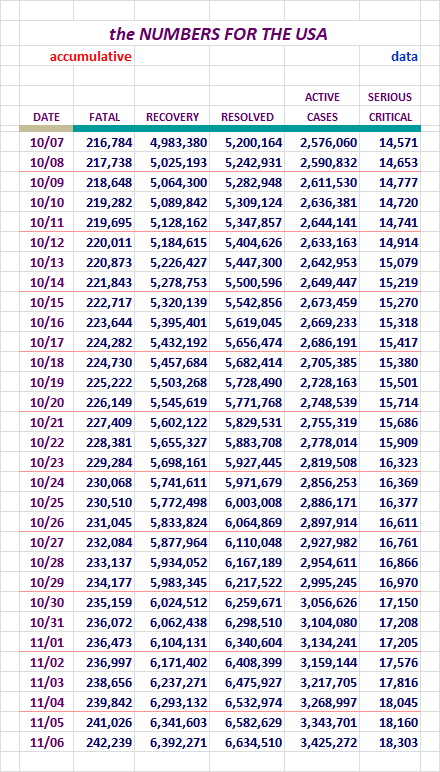
Active Cases rose by 81,571 cases yesterday. That was a very heavy day.
Serious/Critical cases continue to rise over on the right.
Our Slice of the COVID-19 Pie
The growth of our slice of the pie has been decreasing recently.
Here are the numbers I've been tracking, Globally Declared and Active Cases.
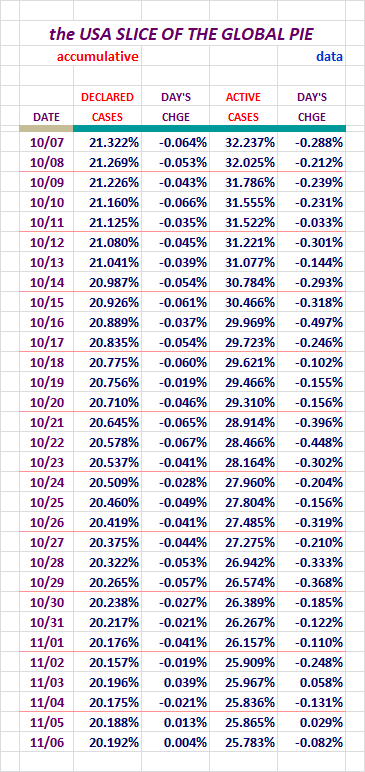
We've been struggling here in over the last few days.
We dropped about 6.00% in the Active Case slice of the pie in the last month,
but don't let that fool you, our number has been growing too much, but the
global number has been growing more than ours.
Active Cases in the United States / Chart
Unlike some of the other charts here, we should see a good rise and
fall at some point with this one.
Note that this presents the single, seven, and fourteen day averaging versions.
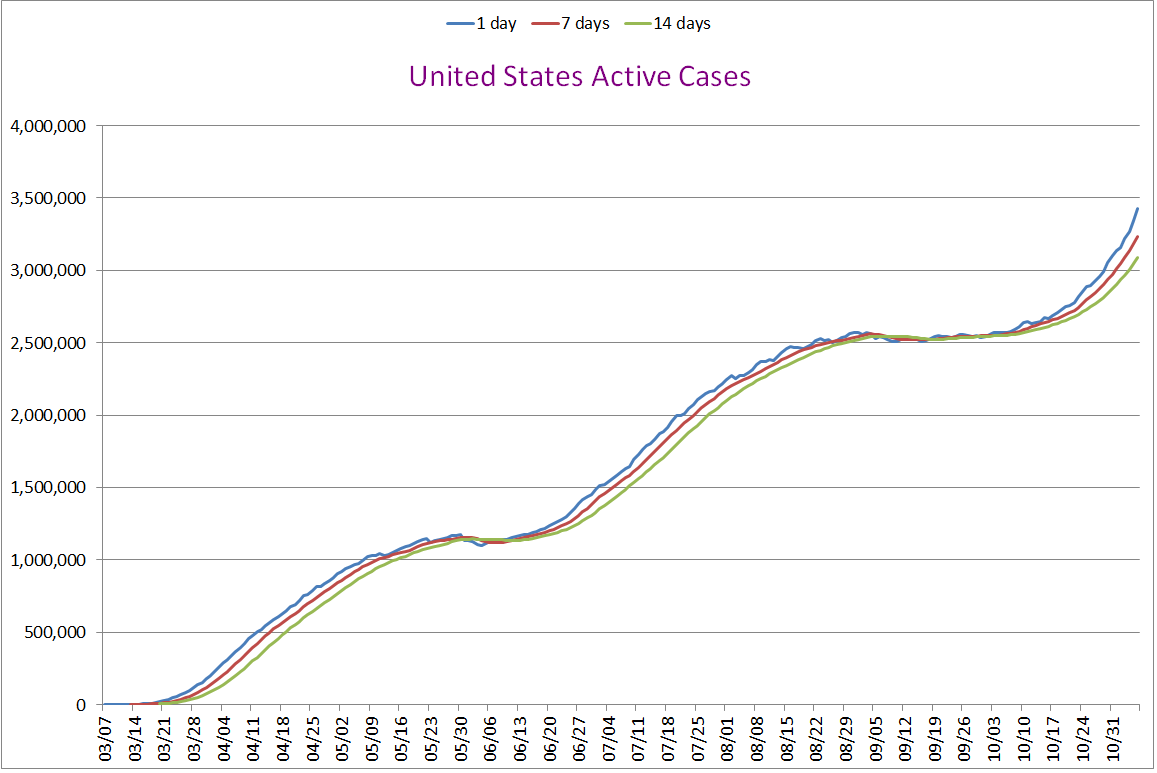
Remember, these are not new Declared Cases. These are remaing Active Cases.
Over a little more than 30 days, we have seen our number of Active Cases
grow close to 1.0 million new cases. We had 2.5 million accumulated over
the prior 7 months or so. This new growth is sad to see.
Testing and New Case Figures
Requested by stocksthatgoup
Some folks have shown an interest in seeing the COVID-19 Test figures compared
to the New Cases being declared. The following Data addresses that. The size
of it just doesn't seem reasoned to me.
Why/how could the posive portion of the popoulace vary ass much as 2.0% from day
to day? I could a lot easier see a 2.0% trend over three or four days. One day?
Nah.
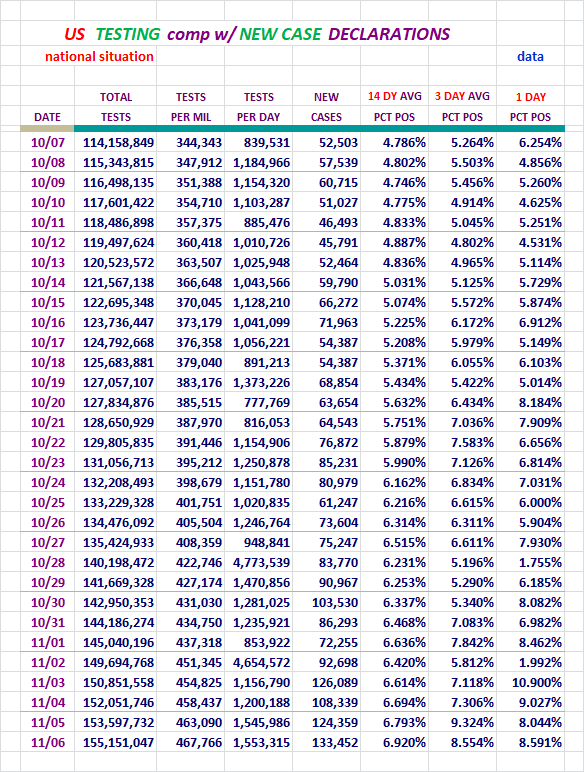
Testing was heavy yesterday and very close to the same number of test
the day before. The percentage of positives continue to rise on the
14-day averaging scale.
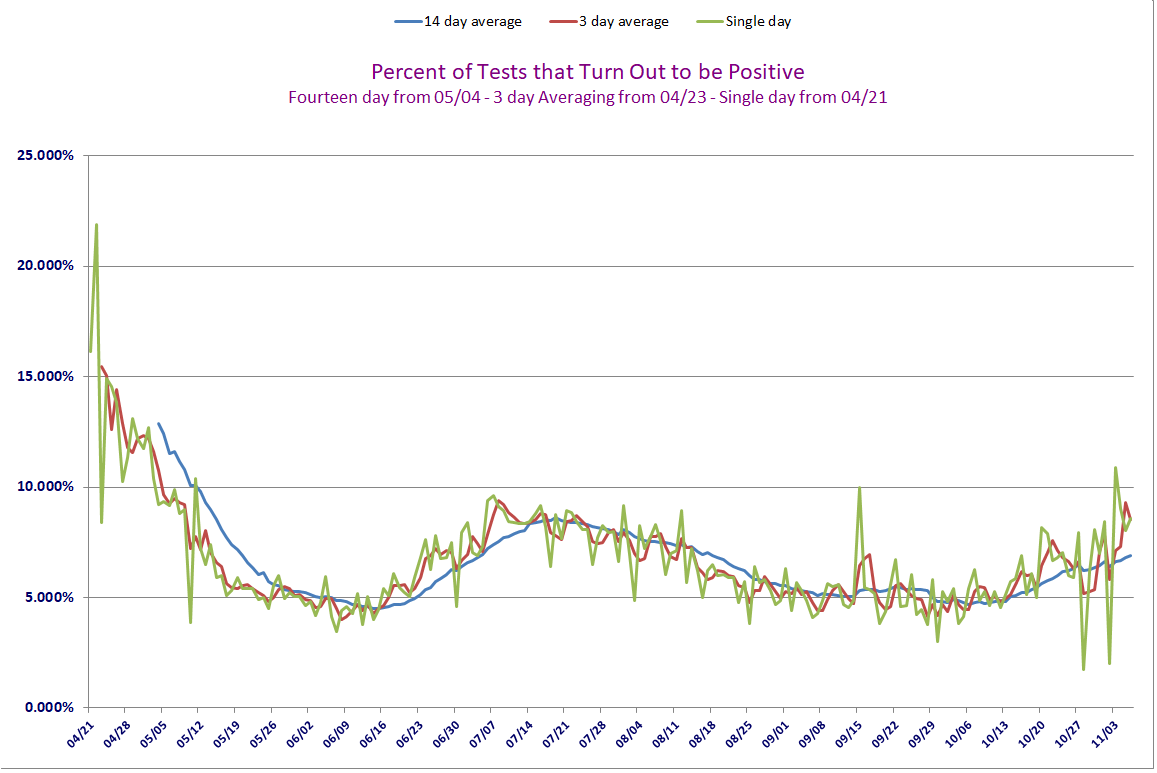
This area is looking pretty skittish over the last week or so.
The U. S. Stats / w 10 Day Averaging / Fr: 03/17
Requested by: Texas Eagle
This data and chart presents things in a little different way. In the
chart it is easy to see the relationship of these numbers. I may be wrong
not to do so, but I don't plan to put much weight in those figures for a
few days until they normalize.
The Chart will use the data all the way back to 03/17, but the data displayed
here will only go back one month.
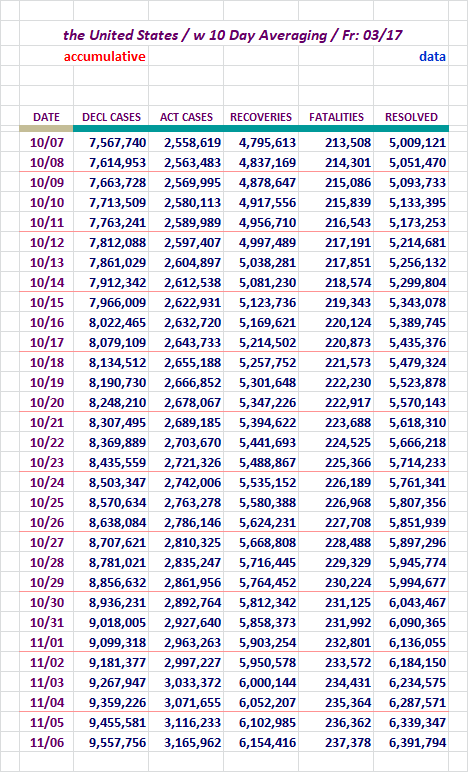
Here is the chart to watch.
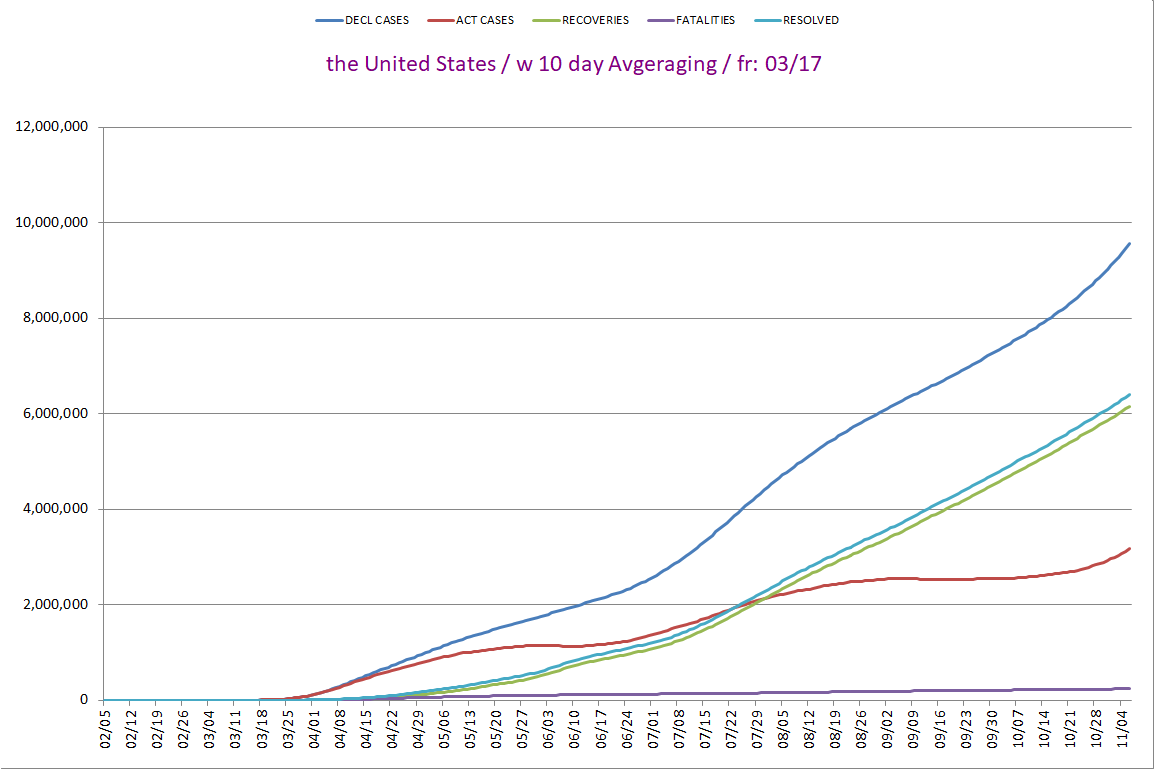
The New Case Declarations line is moving on up.
The Active Case line is rising.
United States Movers and Shakers...
I will present the U S States with the most New Cases and New
Fatilities rankings.
Here we go...
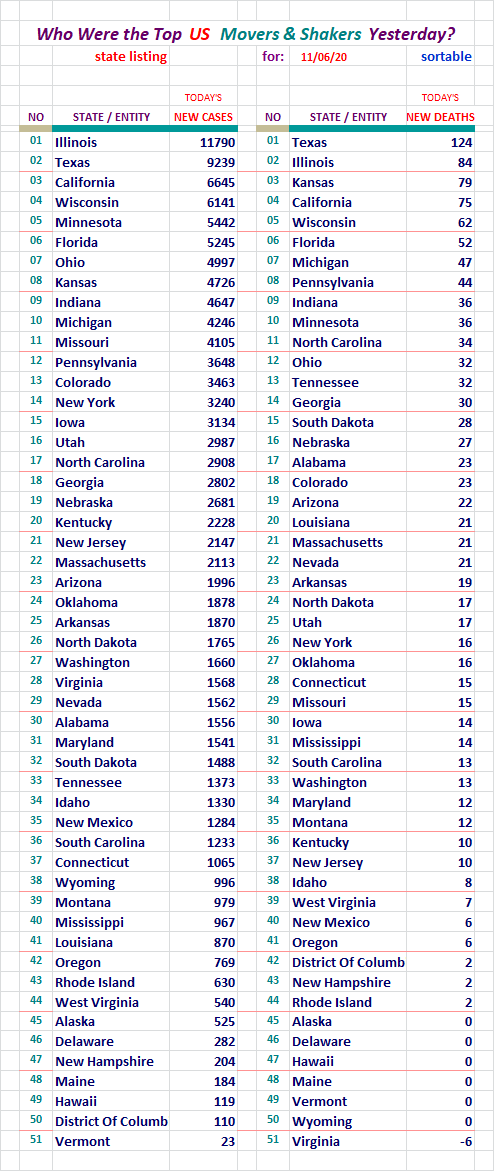
Illinois and Texas took the top spots yesterday.
Section: 03
The Following Addresses the Global Numbers
without Mainland China
Here is the first set of Data for the Global Outside China
Territories
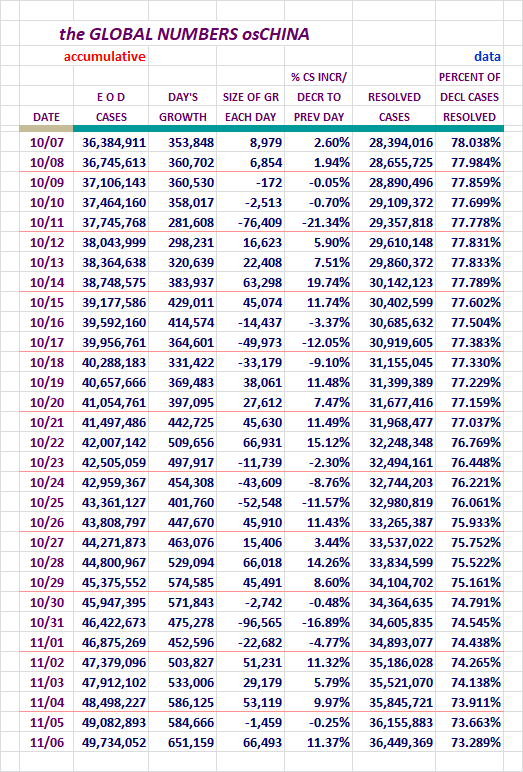
New Case declarations rose by 66,493 yesterday.
The Resolved Percentage fell again yesterday.
Please take a look back up the column to see it's changes recently.
Fatalities, Recoveries, Resolved, Active Cases, and
Serious/Critical Cases - Globally, Excluding M/L China
Concept of adding in Active Cases and
Serious/Critical here, courtesy of amorphous
Here we go...
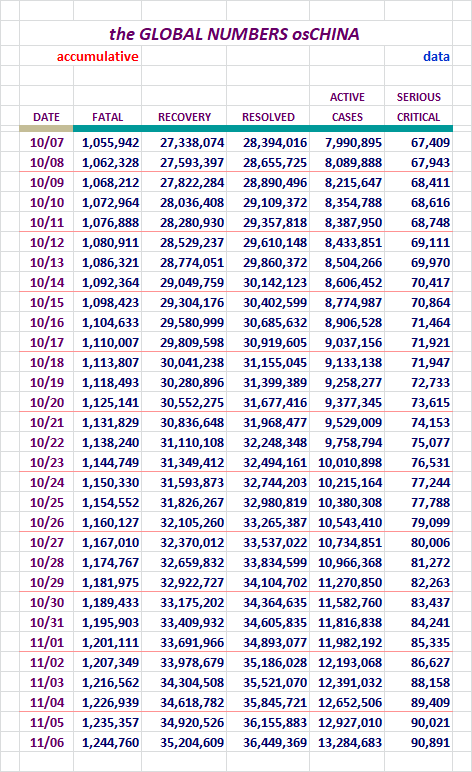
Active Cases rose by 357,673 cases yesterday. That is higher than normal
growth
Check out the Serious/Critical cases there. Nearly 91k. Grrrr...
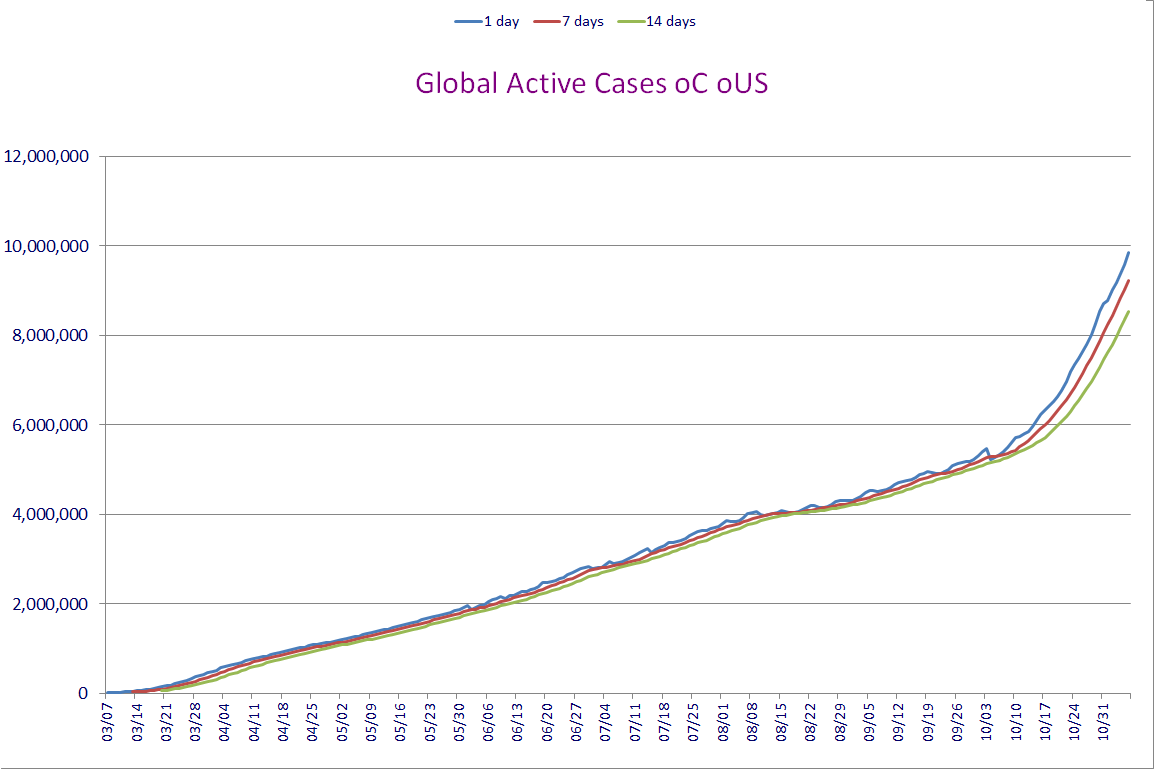
How is the Global Community Outside China Doing,
Without U. S. numbers?
Let's see...
This is a towering new record number in the middle here.
As near as I can tell, this is a naturally high number. Not liking
our blue column transitions.
The blue line depicts our New Cases, up up up. The velosity gas
gained steam in the last few days.
The only up side here is that our line doesn't resemble the Global
community line, in the last day or so we're doing a better impression
of it. Hope that's temporary.
The Active Cases outside China Globally / Chart
As in the United States' version of this, we should see a good rise and fall at
some point these two.
Note that these present the one day and then 7 and 14 day averaging versions.
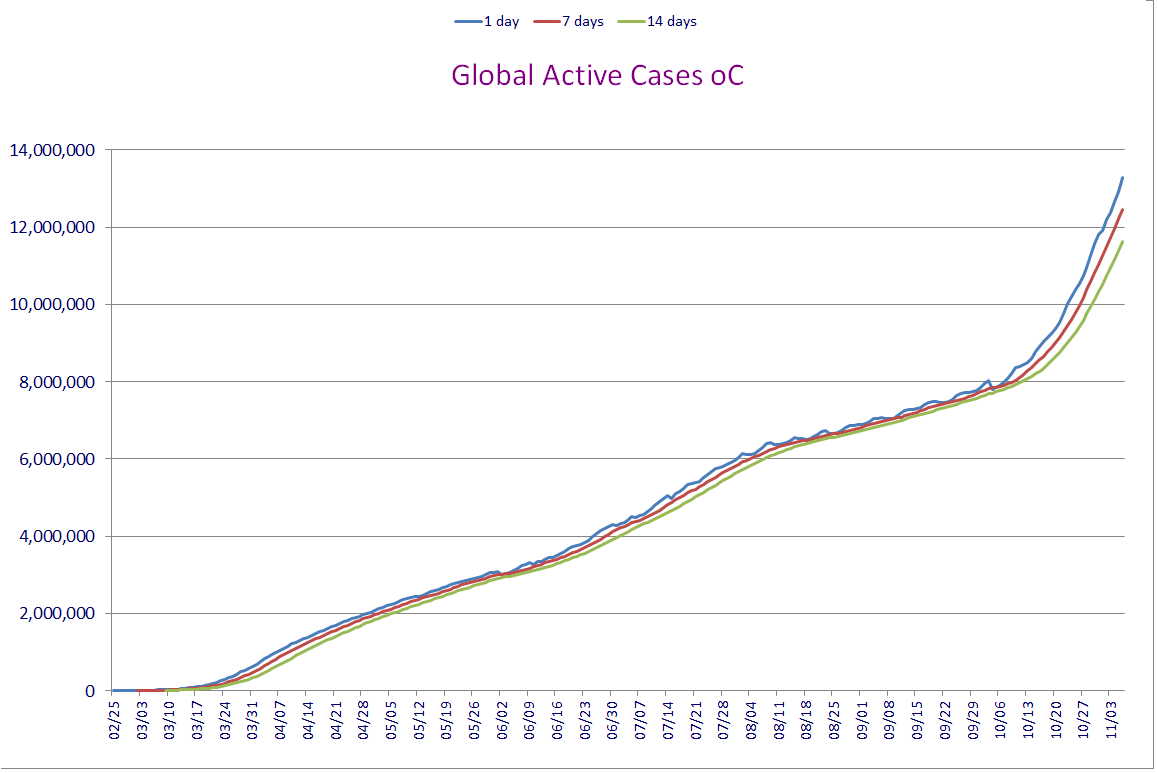
Georgia!
Global Active Cases are growing considerably. The distortion on the right
of those graphs is so out of line with the rest of the charts.
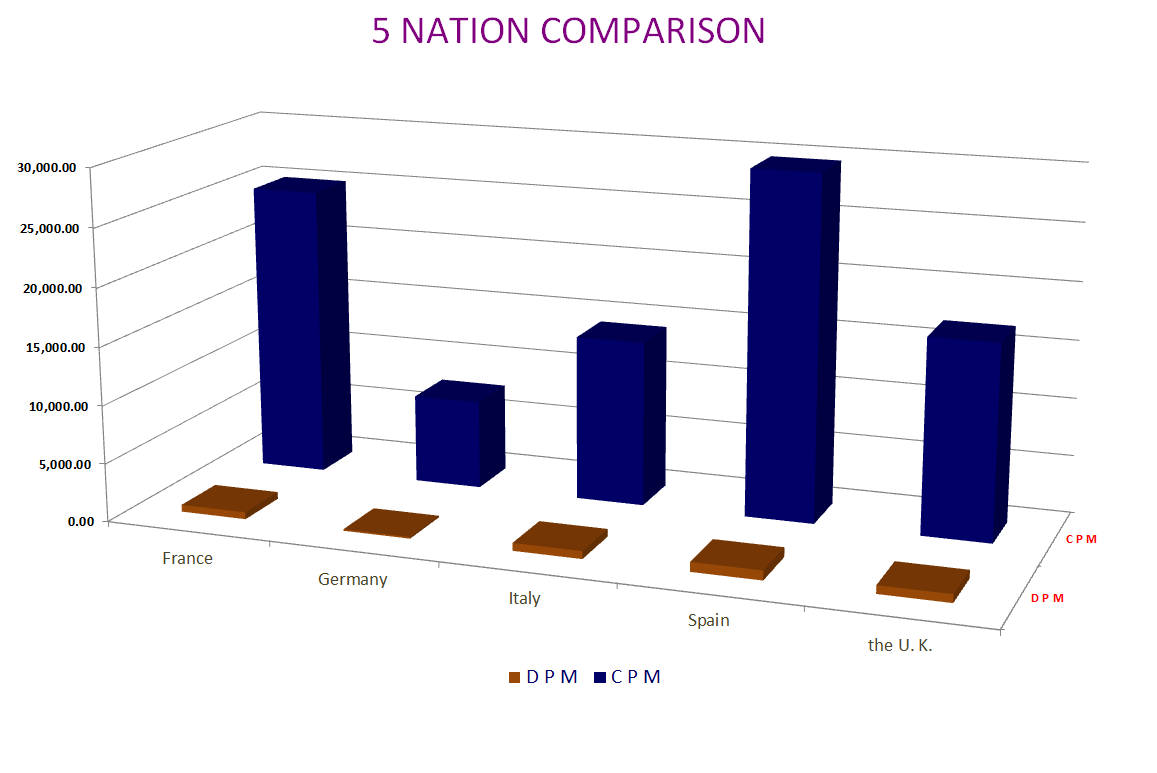
Special Section on France, Germany, Italy, Spain, and the U. K.
Case growth.
Jim Noble mentioned he'd like to see the US numbers added here. I added them
in on 06/21/2020. I did not add them to the chart because it would have
dwarfed the European nations chart lines. (they would have been reduced to
about 15% of their normal size)
Let's Look at Some Numbers in Five Day Increments:
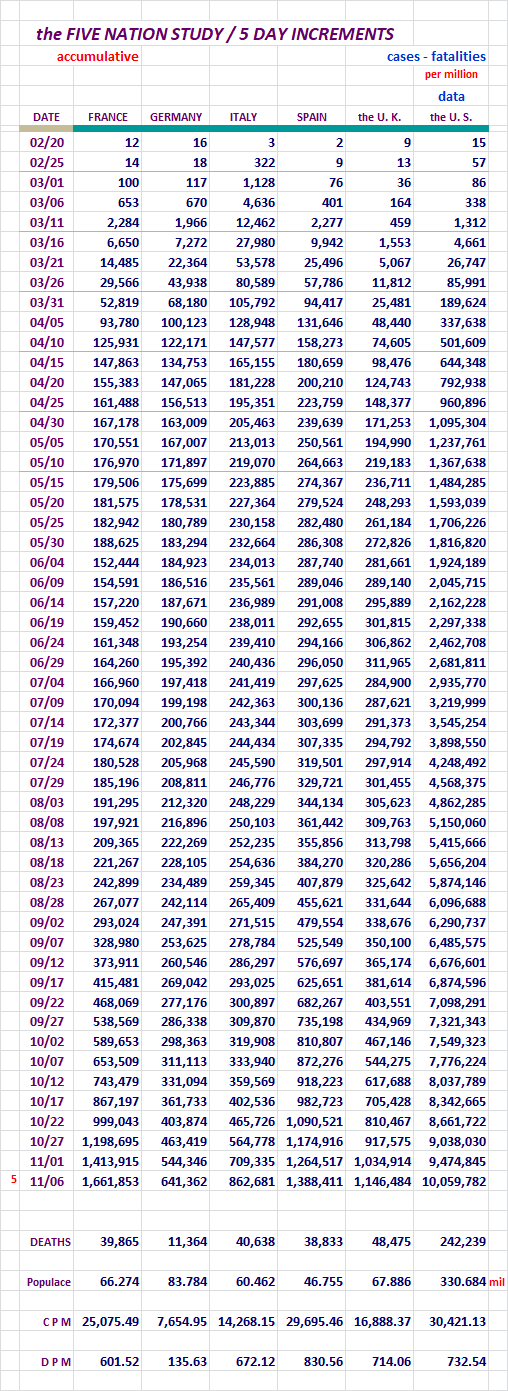
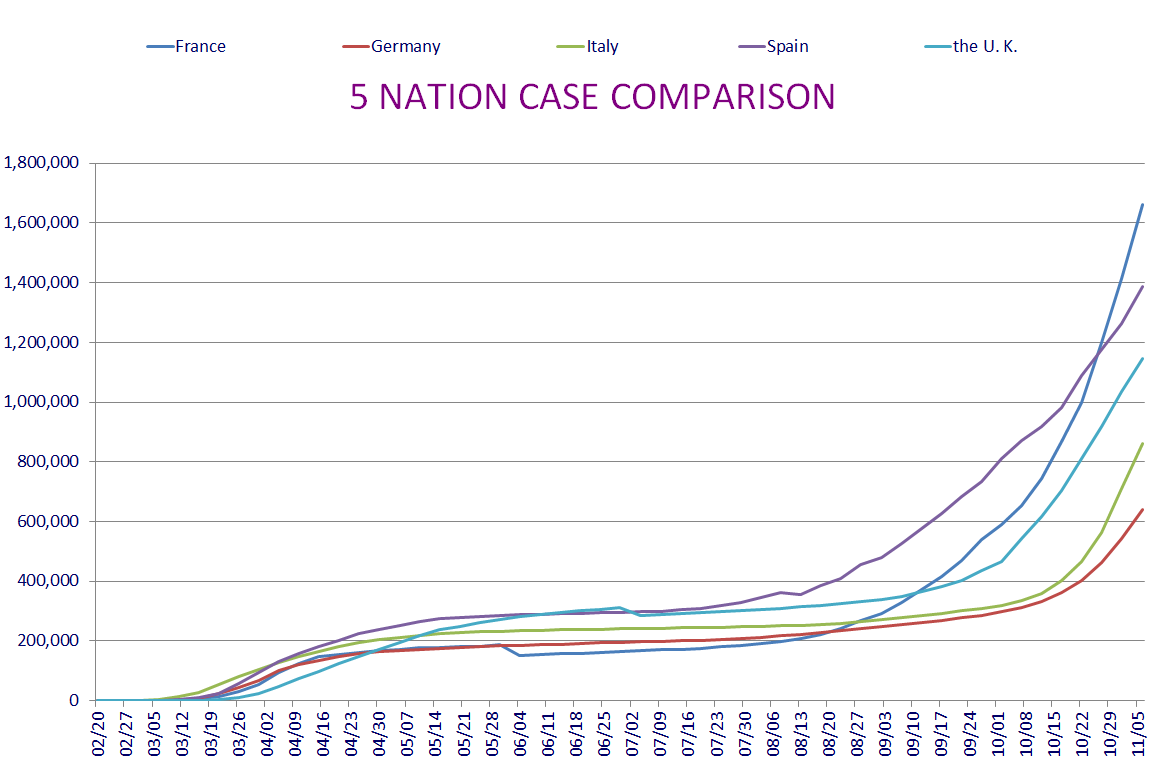
Ug!
The best way to read these line charges, is to take each individual
nation and compare what it's doing now in relation to what it was
doing.
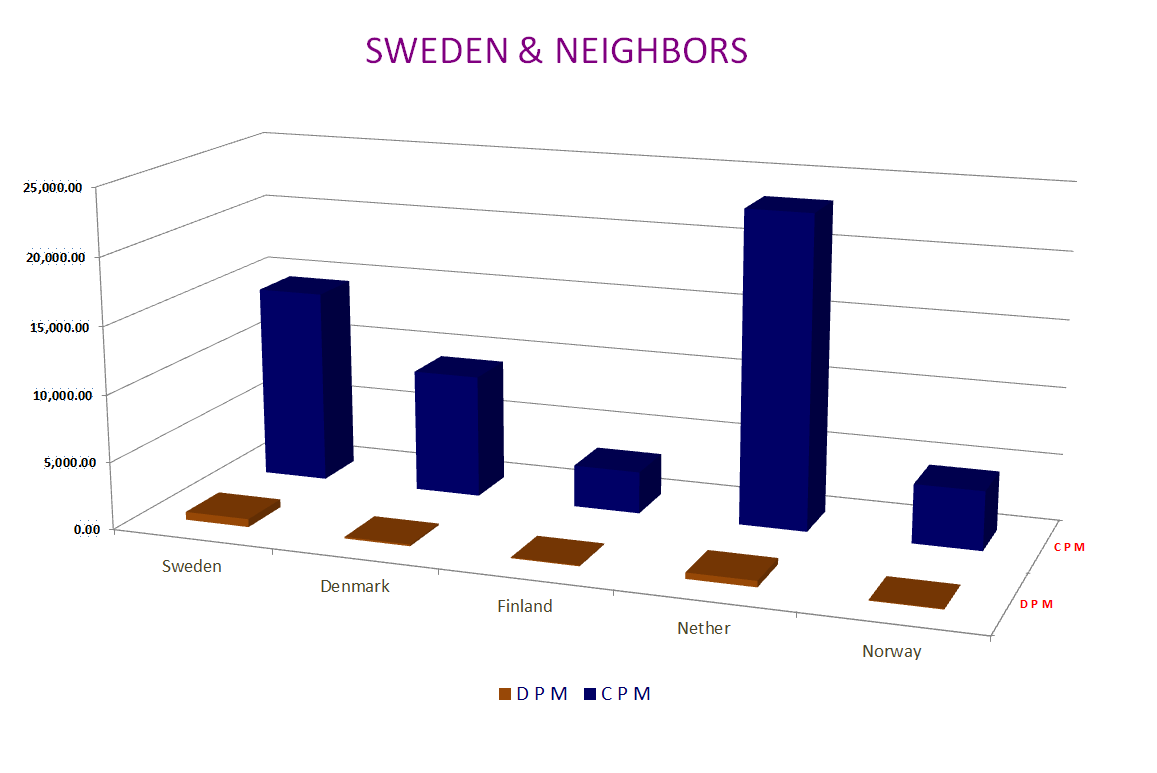
Sweden and It's Neighbors, Who Has the Best Tactic Against COVID-19?
Sweden is doing its own thing with regard to isolating. I think most people
are aware of it by now.
Here are some numbers to help us look at this issue.
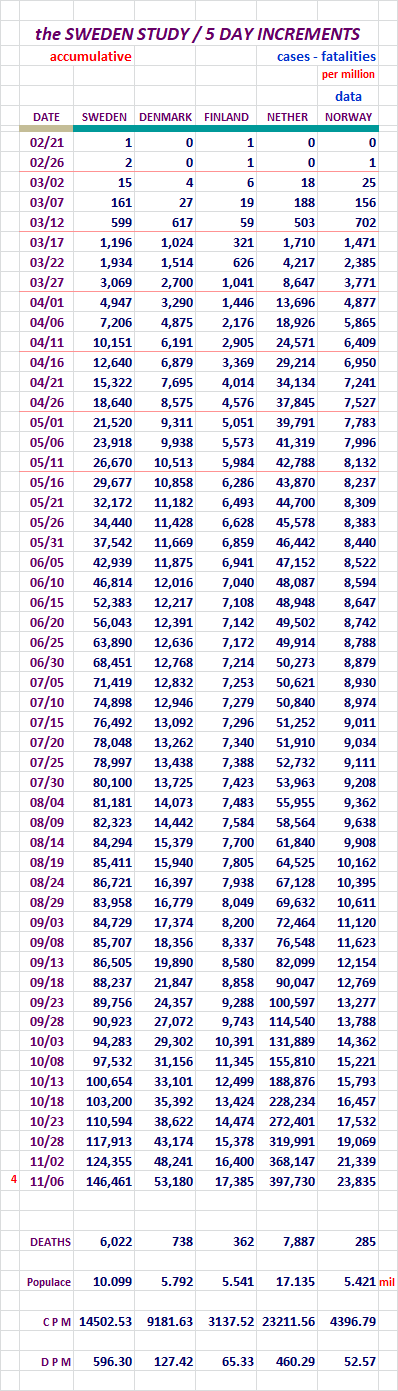
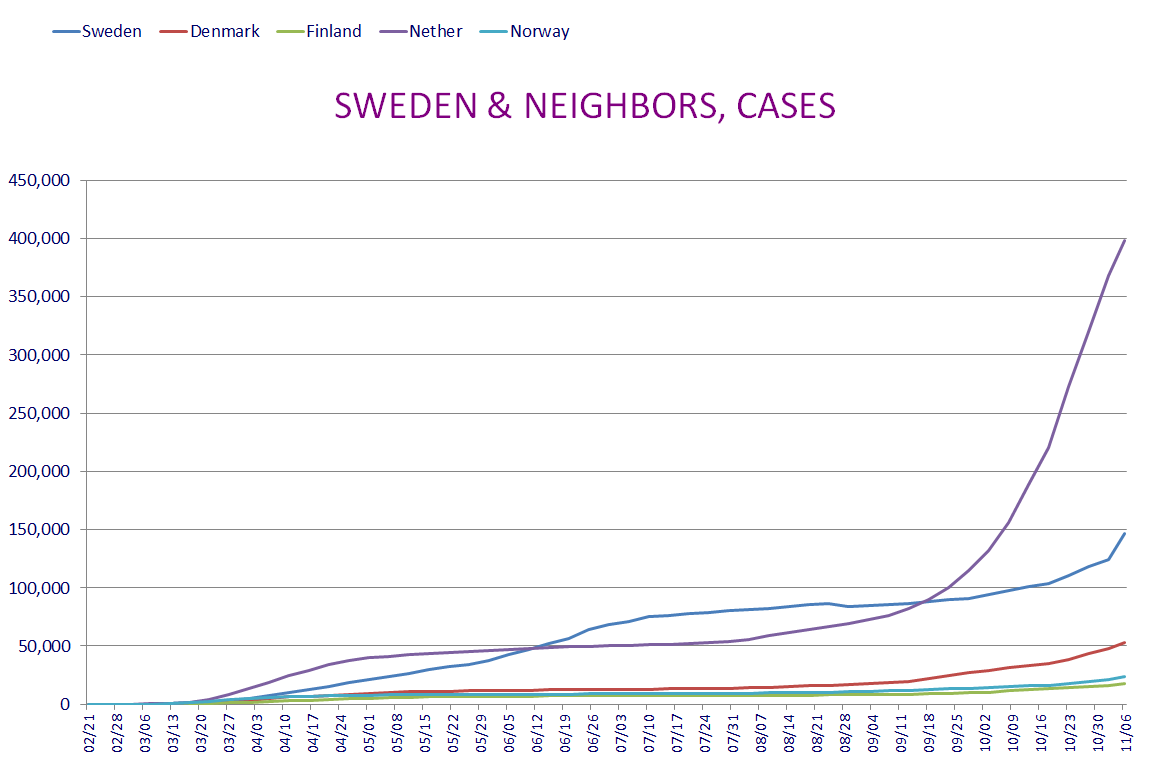
Sweden had flattened out a bit after that correction a while back, but it
is drifting up at an excellerated pace now. Norway seems to be making
a move also.
The best way to read these line changes, is to take each individual
nation and compare what it's doing now in relation to what it was
doing.
The Netherlands... yikes.
Global Movers and Shakers...
I will present the top fifty nations with the most New Cases and New
Fatilities.
Here we go...
The United States took both spots again here yesterday.
We're going through a high numbers period right now. So is Europe.
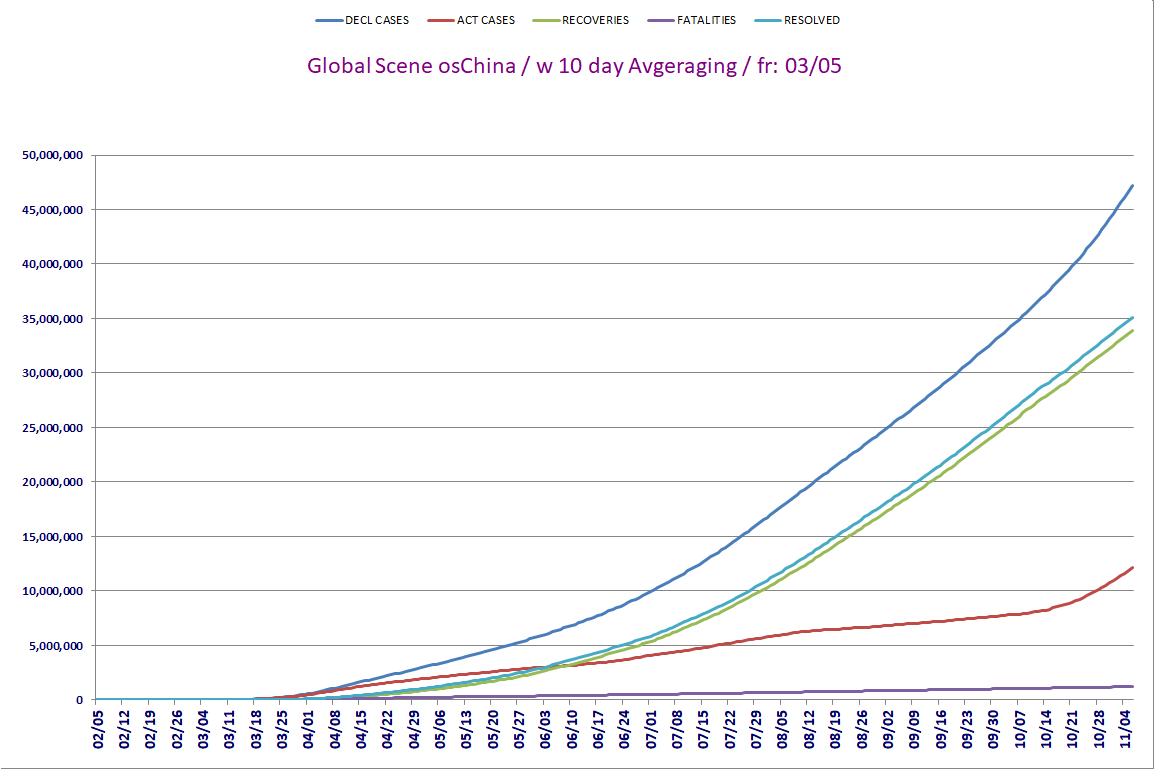
Global osChina Stats / w 10 Day Agveraging / Fr: 03/05
Requested by: Texas Eagle
This data and chart presents things in a little different way. In the
chart it is easy to see the relationship of these numbers.
The Chart will use the data all the way back to 03/05, but the data
displayed here will only go back one month.
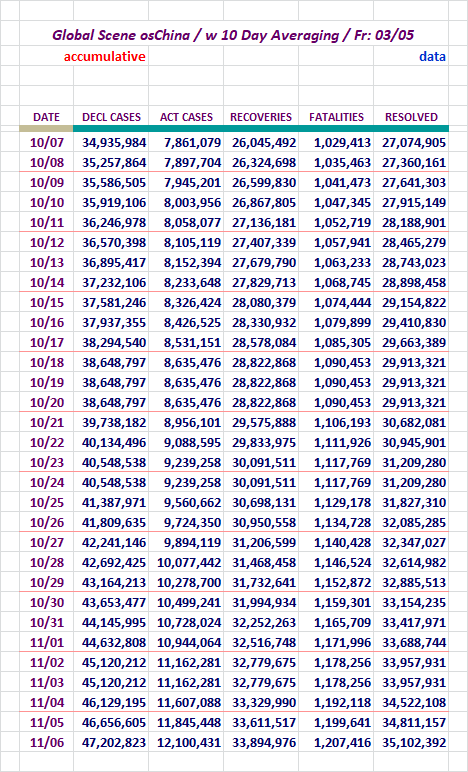
Here is the chart to match.
The Active Case chart line is turning up. Sorry to see it.
In the United States chart like this one, the Recoveries, and Resolved
Case lines have not shown near the strength as is revealed here with these
upward bound lines.
That chart is provided here, in a small version, but you can see it full size
if you right click view.
Section: 04
The Following Addresses the Global Numbers
including Mainland China*
Mainland China's numbers are 0.003% of today's total global numbers.
(this was larger than normal change here, and there may have been
something I didn't pick on - keep that in mind as you review this)
Note: That 0.003% figure should have run solidly over the last few
days, but I had made a small error in data entry. I knew I had but
didn't run into the cause until the next day. Then I forgot to update
this number. It appeared incorrect for two days, at aroumd 00.457%.
Sorry about that.
A Look at Declared, Resolved, and Active Cases, Includes M/L China
End of day figures follow:
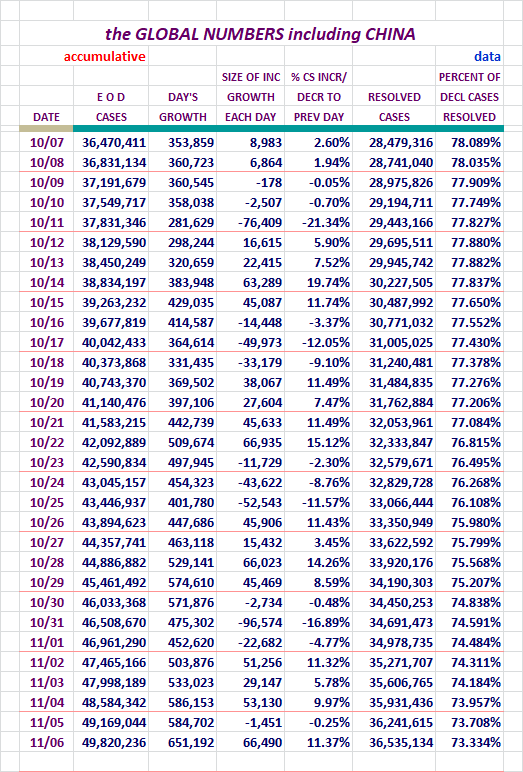
The Resolved percentage is declining for all groups at this time. Just
peak at it once in a while.
Folks should view up the column to see what the trend here has been
recently.
Fatalities, Recoveries, Resolved, Active, and Serious/Critical
Cases Globally, Including M/L China
Concept of adding in Active Cases and
Serious/Critical here, courtesy of amorphous
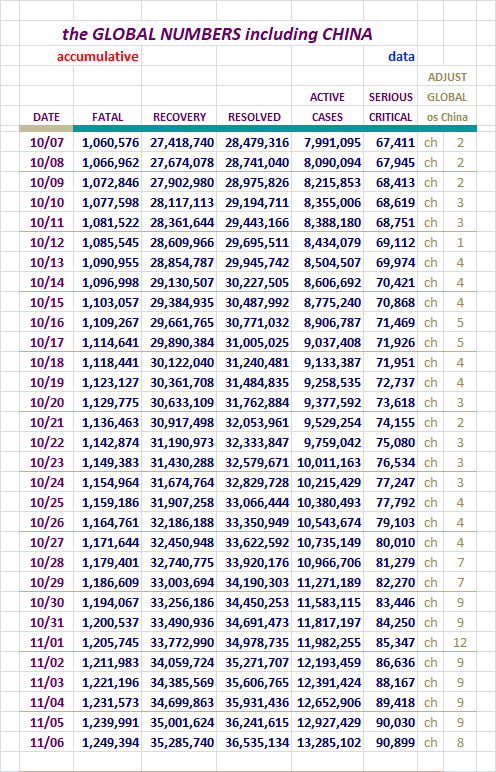
Active Cases rose by 357,673 cases yesterday, and Serious/Critical cases
rose by 869 cases yesterday.
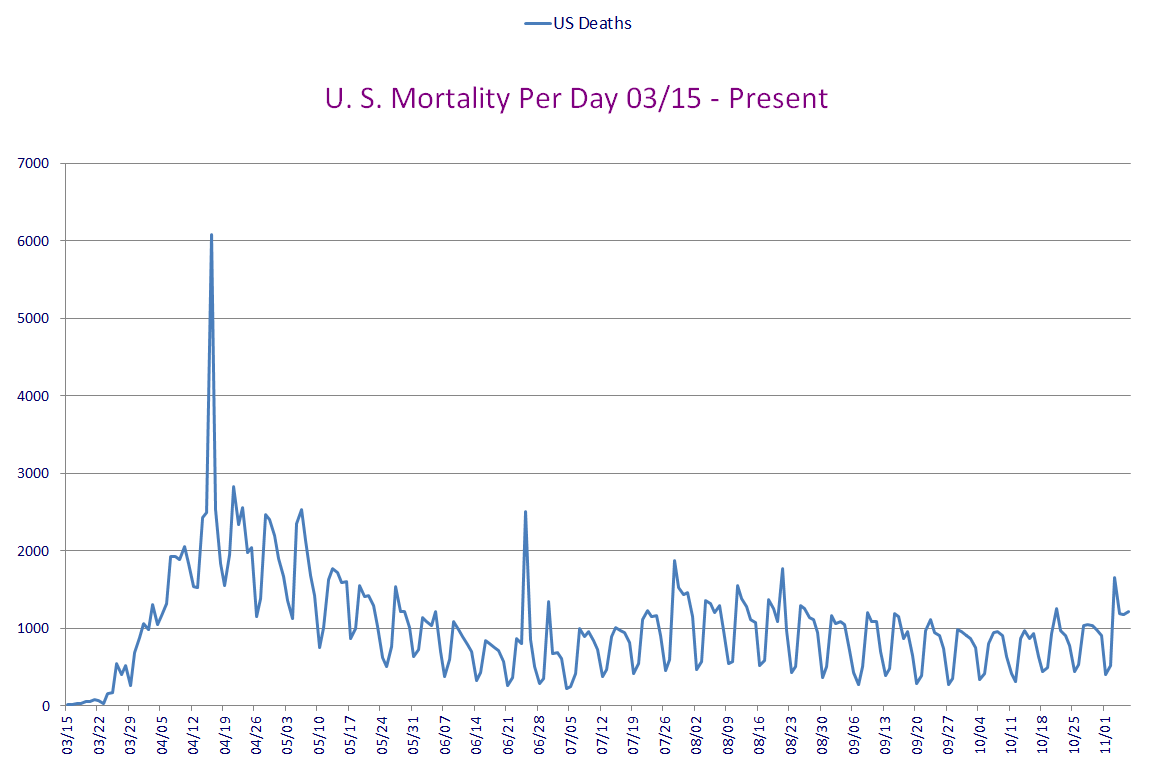
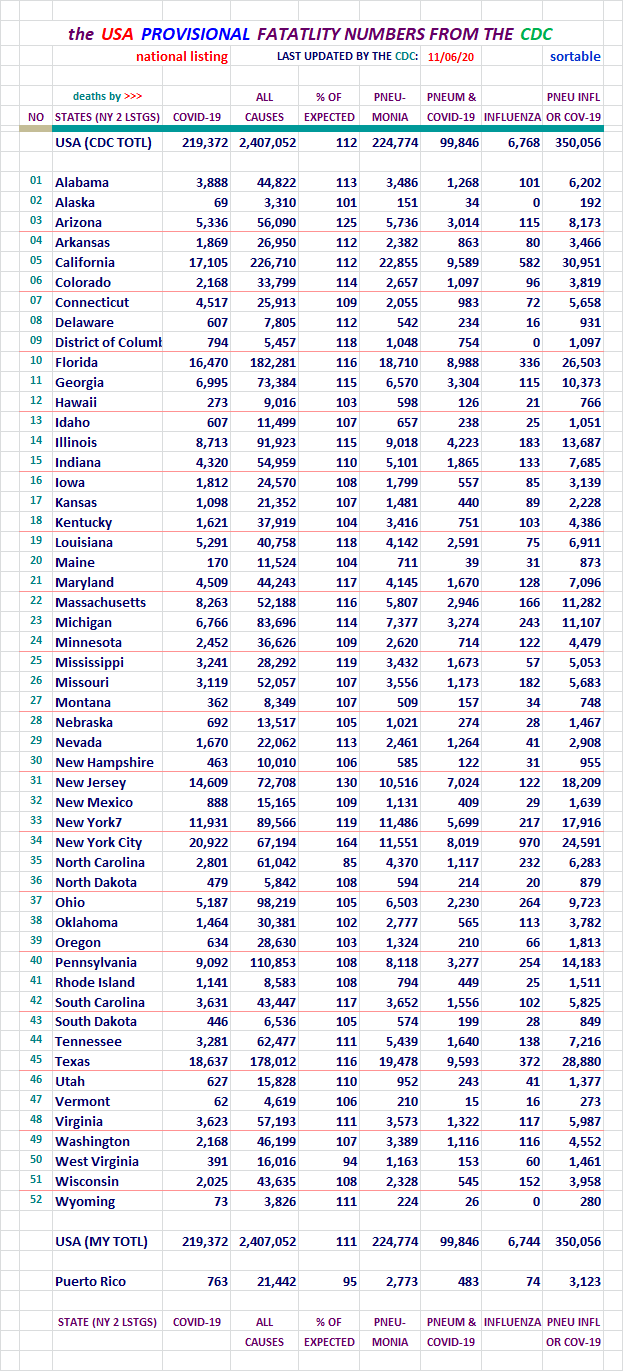
Section: 05
the Mortality Report
Here is the data for four entities...
Here are the figures for the growing case totals for four entities.
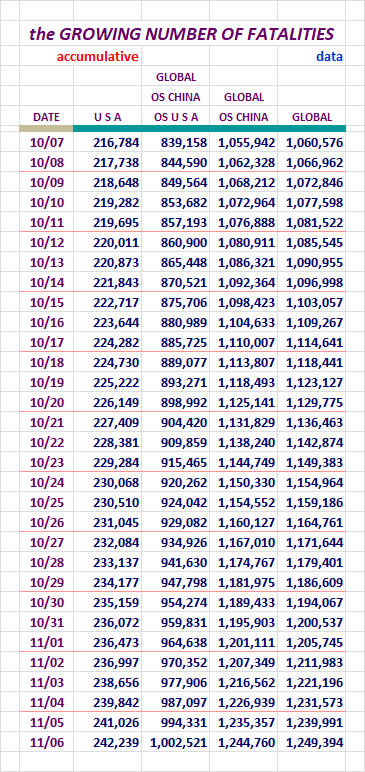
We hear all sorts of stories about how these figures are wildly off. The CDC
has studied them and seems to think they may actually be on the low side of
things. I am providing the CDC Provential Numbers down below. Not sure if
anyone has a rock solid number. I doubt it is possible. This is what is
reported out by WoM and JHU. Check out the CDC numbers too.
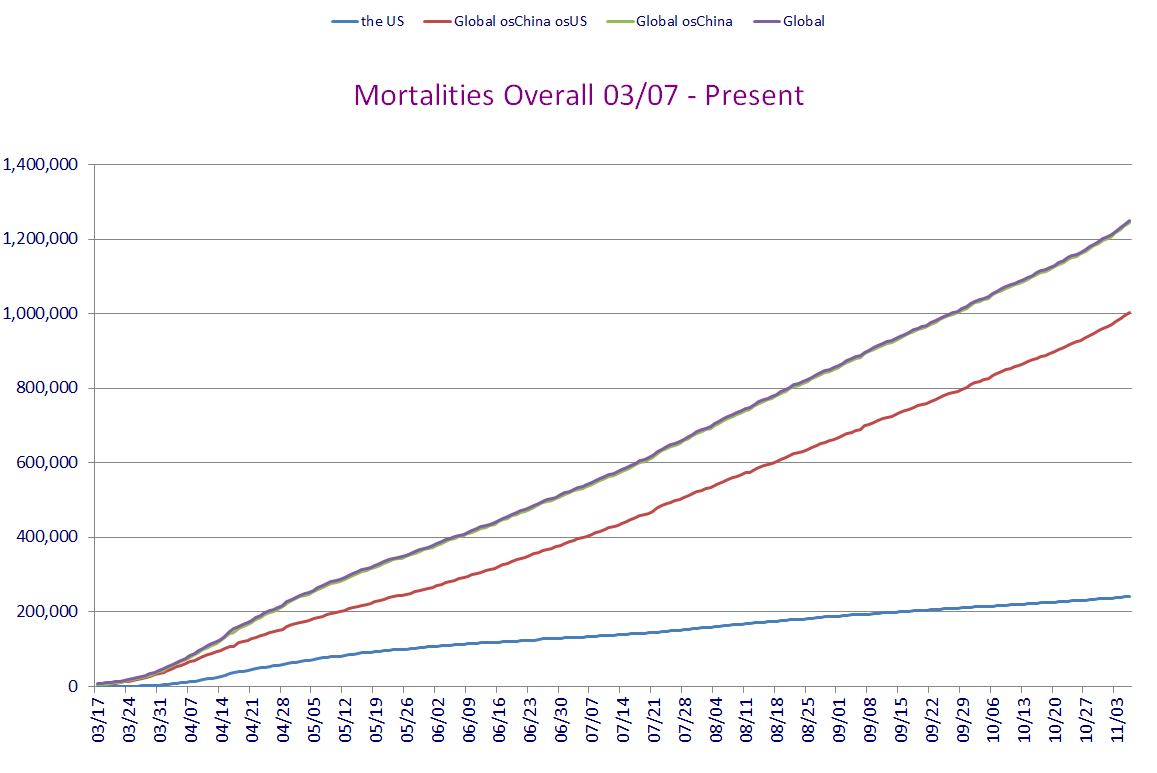
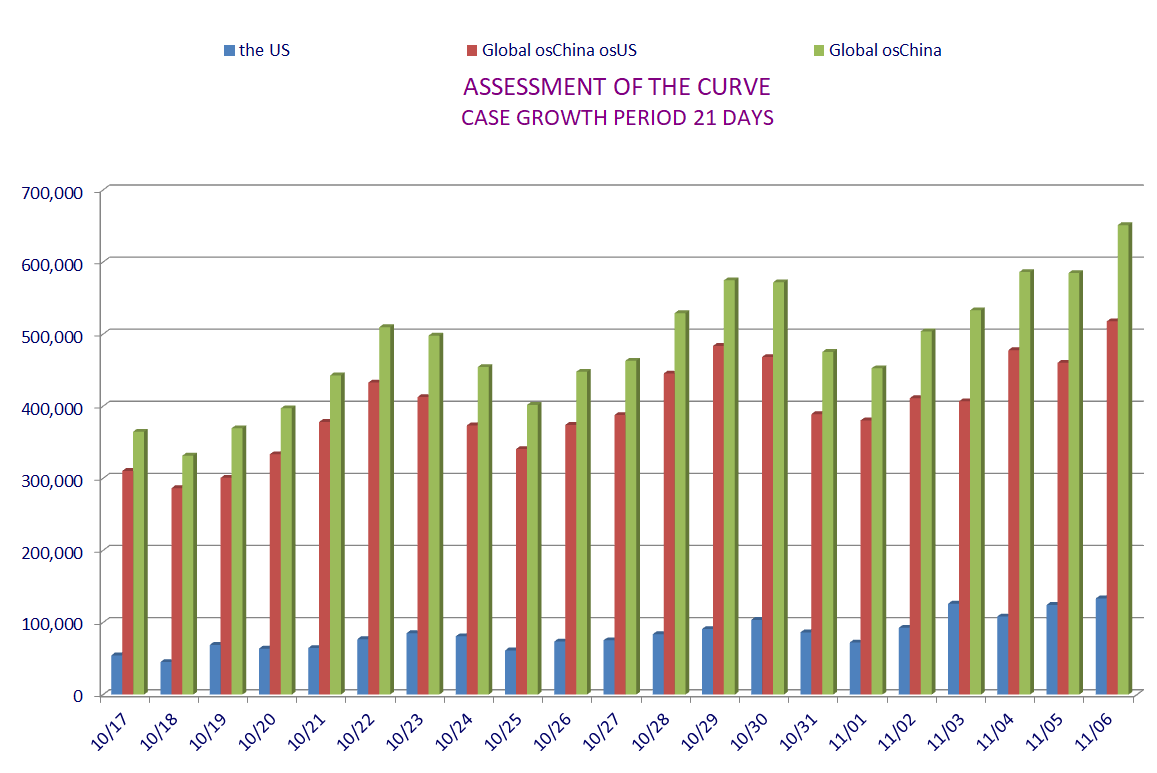
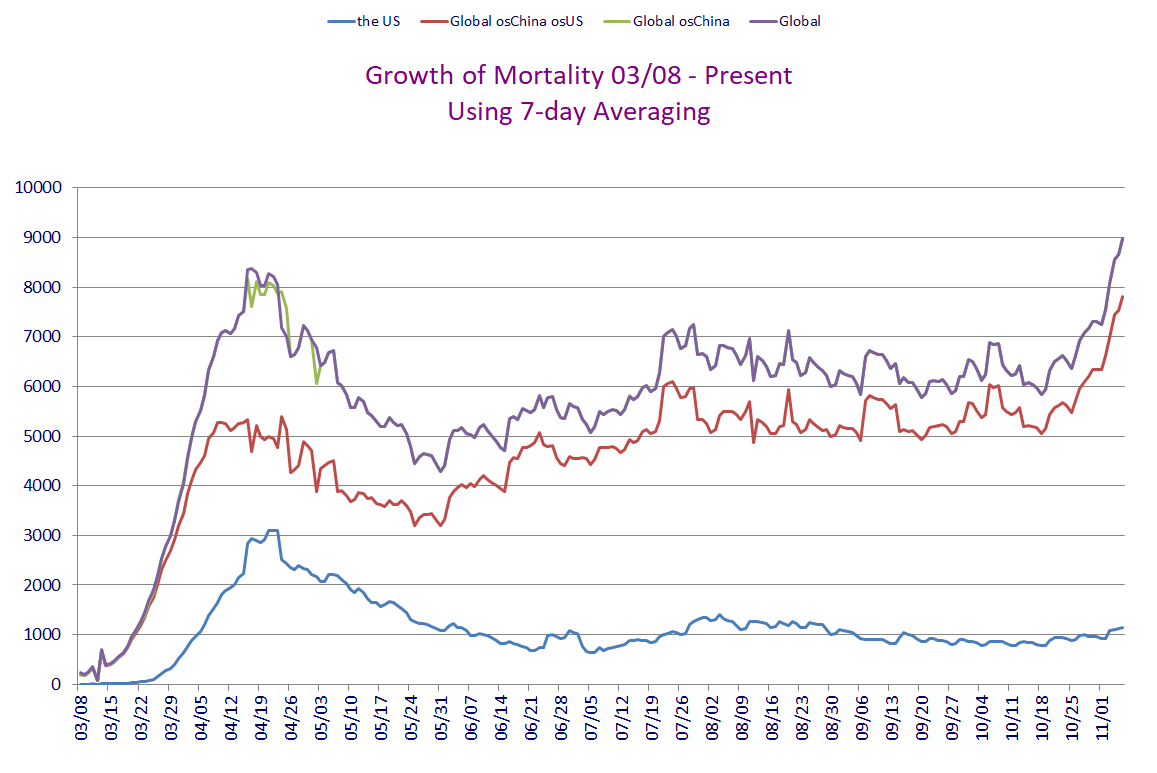
Charts like this one only show growth. That's why I recently took the advice
of a FReeper and added in a new chart for the U. S. and Global outside China
regions.
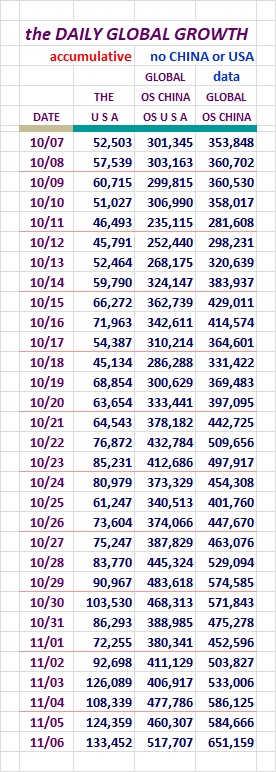
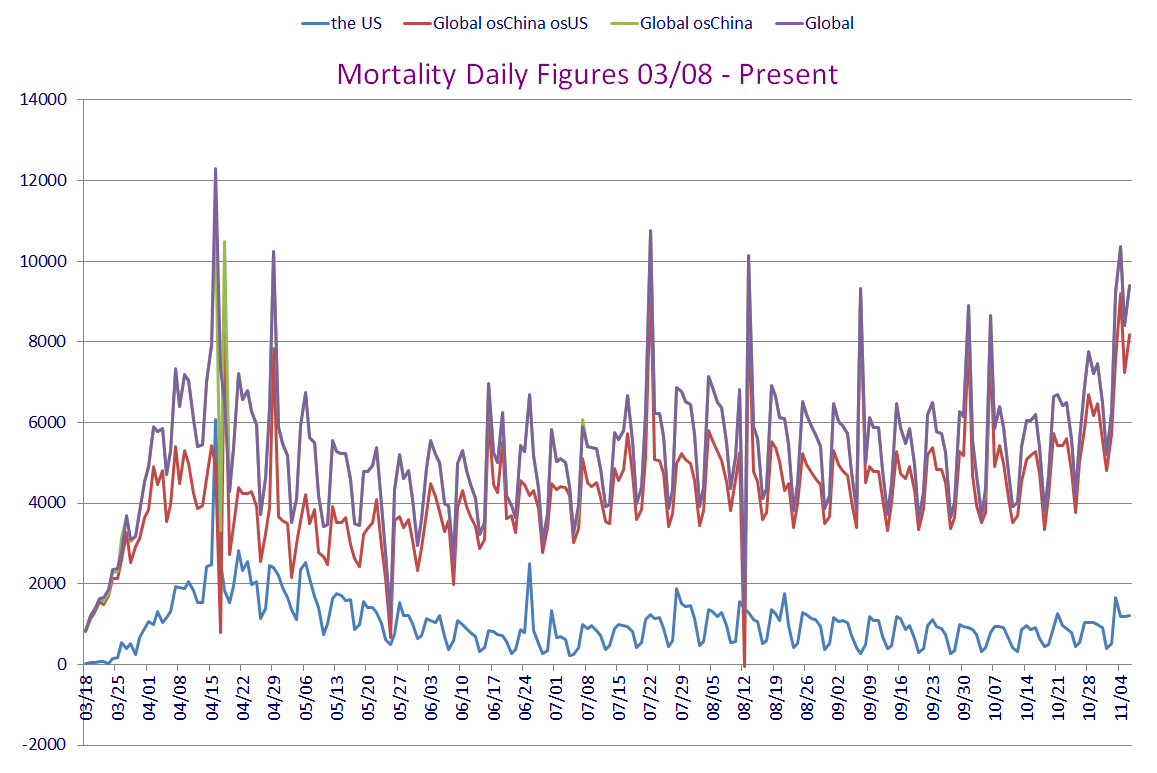
Here are figures revealing the daily growth for those four entities.
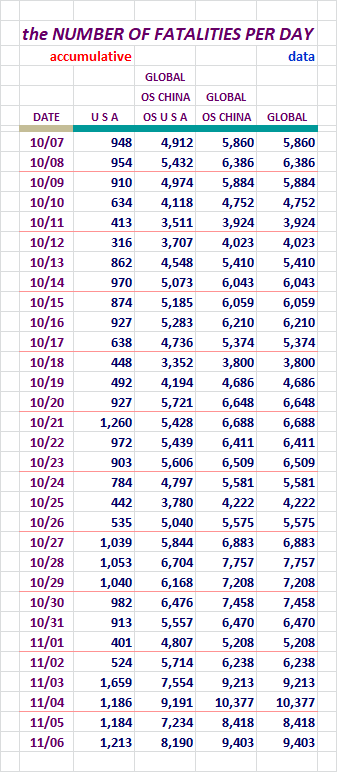
Each areas number of Fatalities rose yesterday.
Since the beginning of COVID-19's activity in the U. S., higher New Cases were
soon followed by elevated Fatalities. If we have gone to school on the data
of this disease, we know who should avoid exposure the most. So if the
demographic that has little to fear from the disease is out there getting
infected, it may not be a bad thing at all. If the Fatalities remain low,
vastly higher cases may simply increase the rapidity of the saturation of the
people in public who have already fought it off. And that may facilitate the
end of the disease. I'm sure others know this, but I did want to explain why
my thinking has fluctuated over time regarding these dynamics.
Here, let's look at data for the United States broken out by itself.
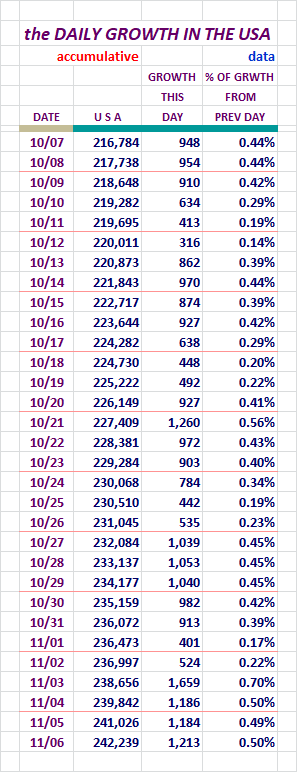
We moved up, but by only 29 cases.
We started out of character for the week, and it has stayed with us
with elevated numbers this week.
Section: 06
Population Saturation
Here are figures revealing how many people in each population base represent one
case. I'm also showing what percent of each population base is infected at this
time.
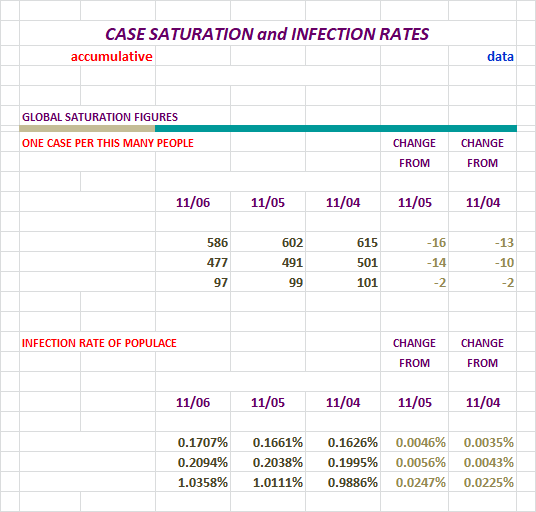
This area hasn't looked too good lately. Not good...
Nations With Lots of Cases
At the end of the day yesterday, there were:
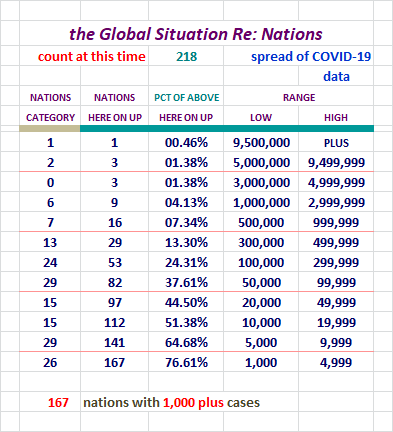
I expanded the levels here. We had nations who were seeing serious
growth, and their levels weren't showing up very well at the top.
Over 50% of the 215 nations we're tracking now, have declared over 10,000 cases,
but they have far less of them still Active. Over 30% of the nations we're
tracking have delared over 50,000 cases along the way. None of them have
anything near their declared amount remaining active. Keep that in mind.
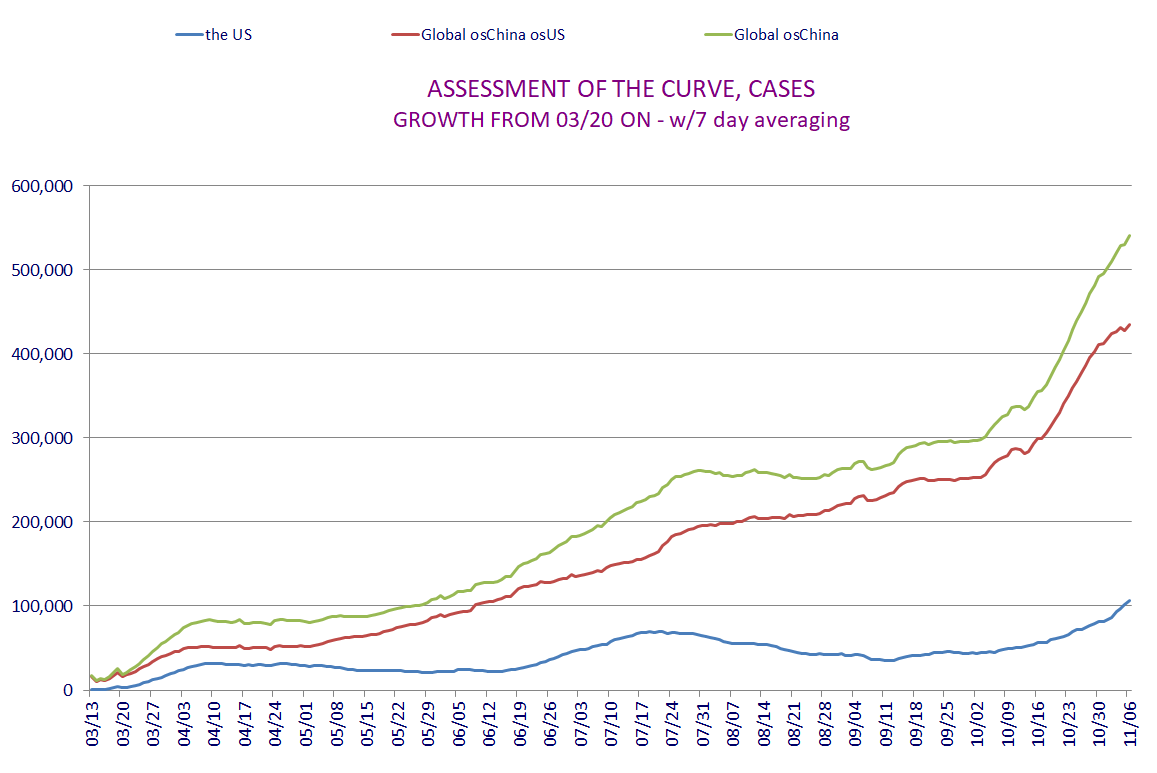
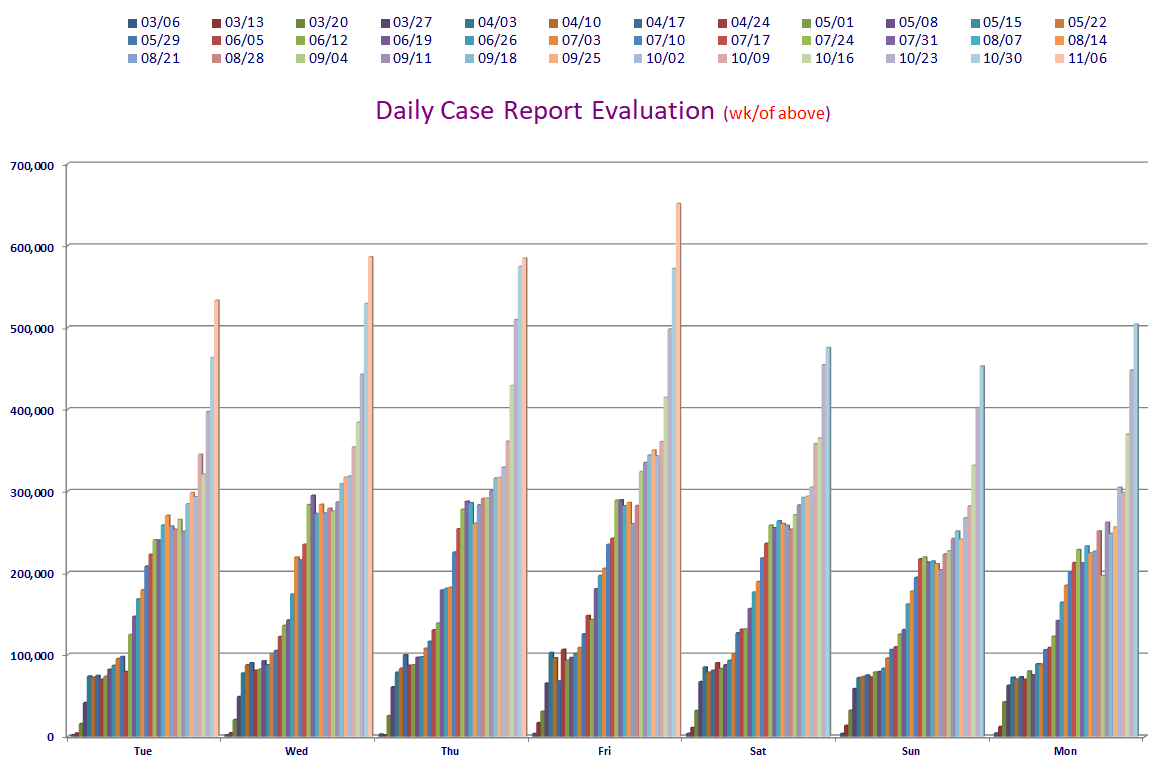
Daily Case Report Evaluation
I'll be keeping tabs on the daily tallies for days of the week for a while. Folks have
noticed some patterns of larger and smaller data entry on certain days, and on Fridays
sometimes the numbers get noticeably larger because of it.
And we now know Thursdays have potential to break out also. Yikes!
IMO Let's check out the numbers and a chart.
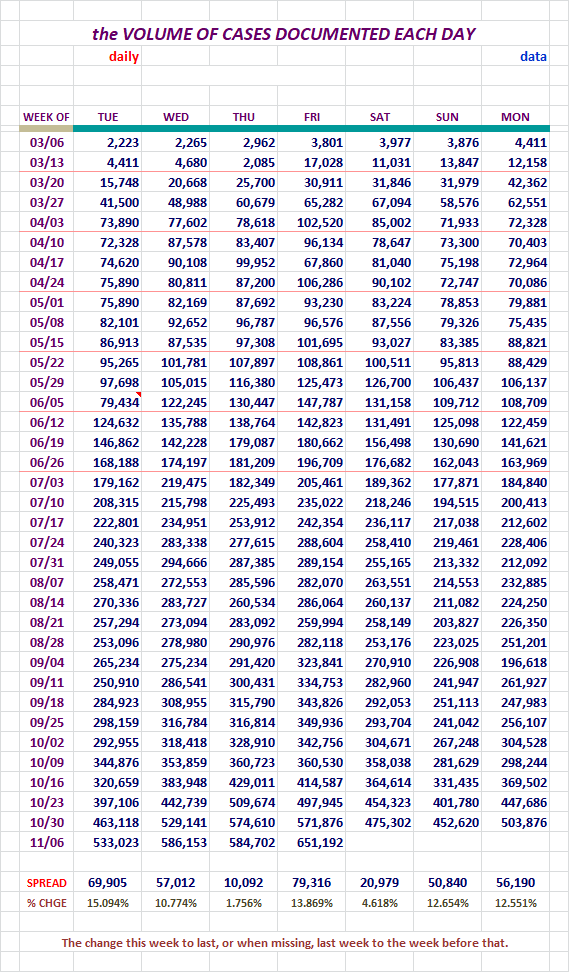
Please take note of the new tally line down below the numbers up above.
I'm now showing the case number change and percentage of this week's number
to last weeks number. If a number hasn't been entered yet this week, the
spread will cover the week before.
On Friday we had the highest day yet, at 651,192.
Section: 07
The Top 200 Counties in the U. S., by Number of Cases
This little report lists 200 Counties in the United States in declining Case numbers.
There is also a listing that is alphabetical. This report list only the entities
and the number of Cases in the two different sorts.
It will also be available as a downloadable Excel file in Section 12.
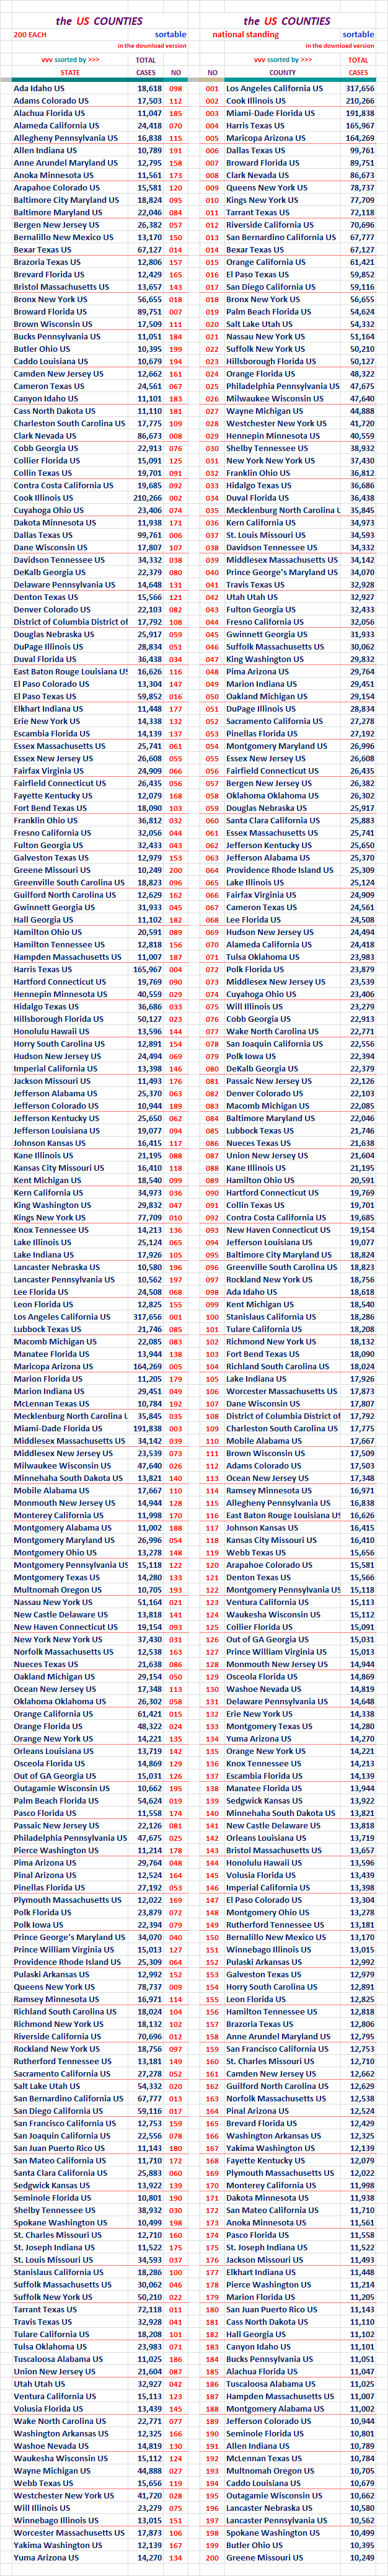
For months Puerto Rico was showing up with the Counties. That stopped in early July
if memory serves me well.
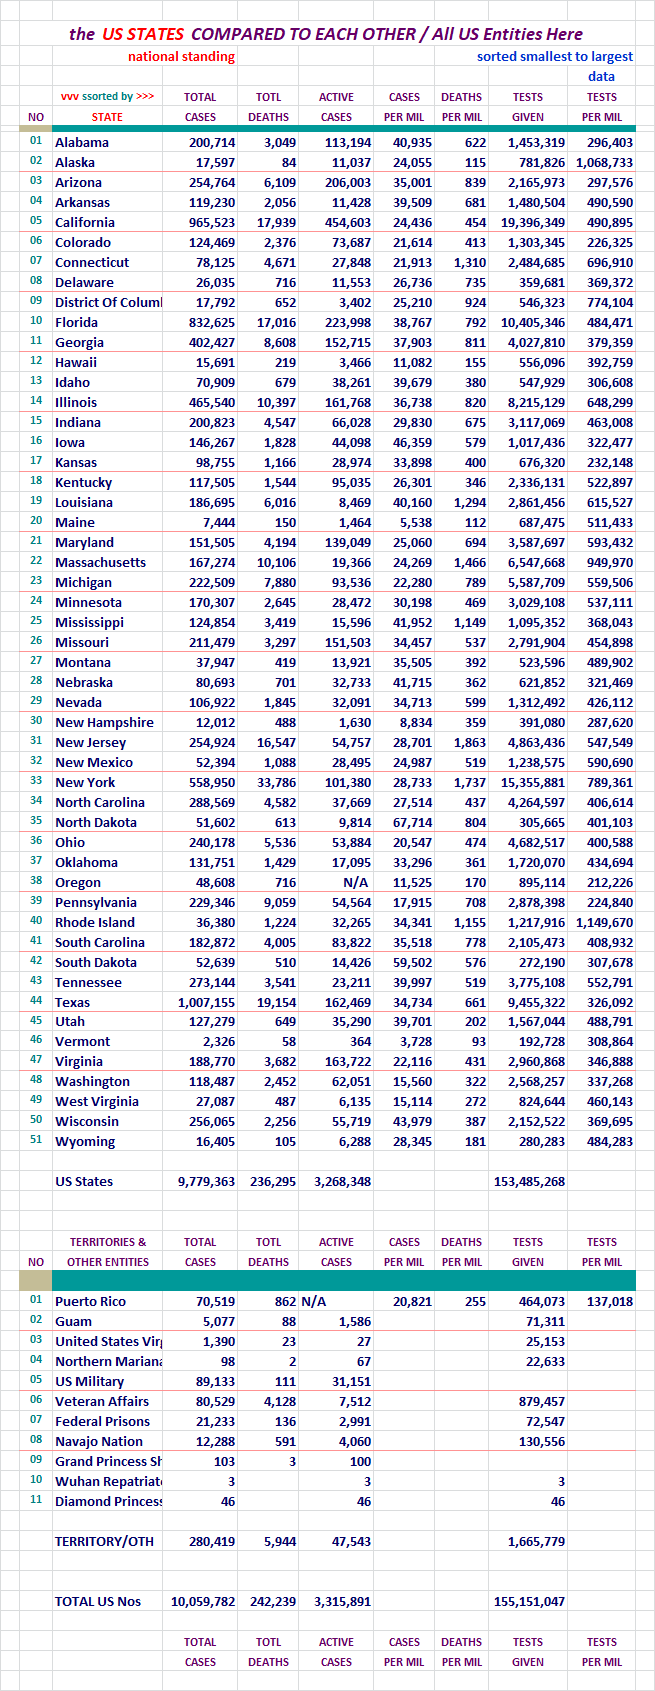
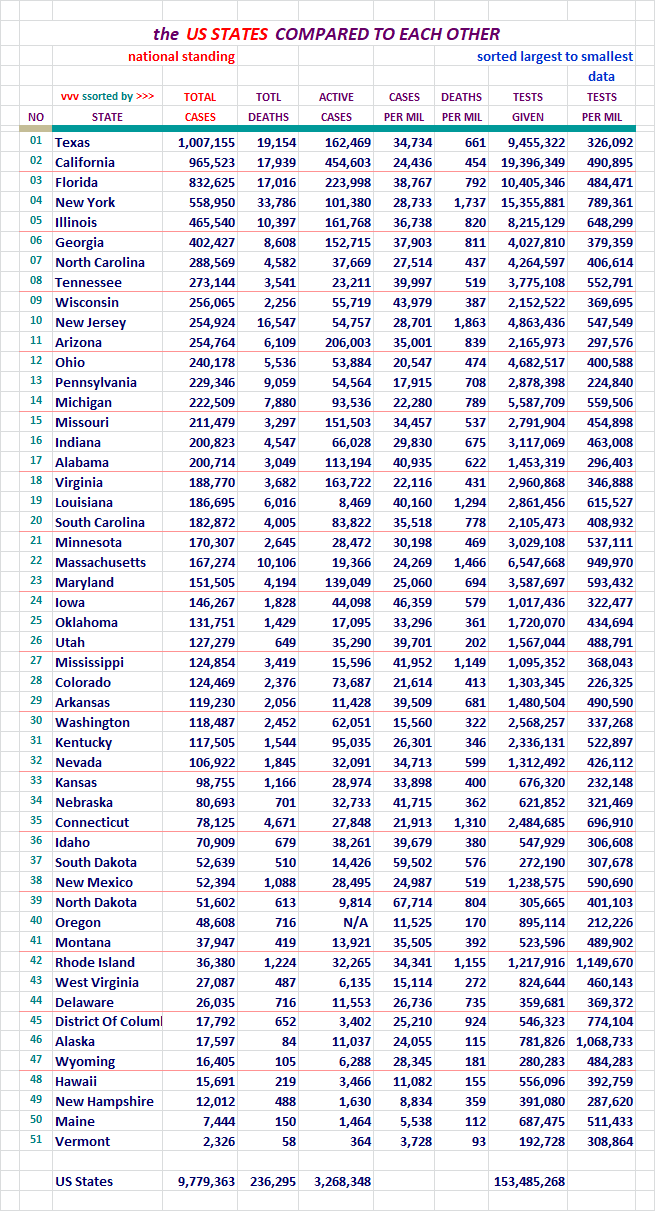
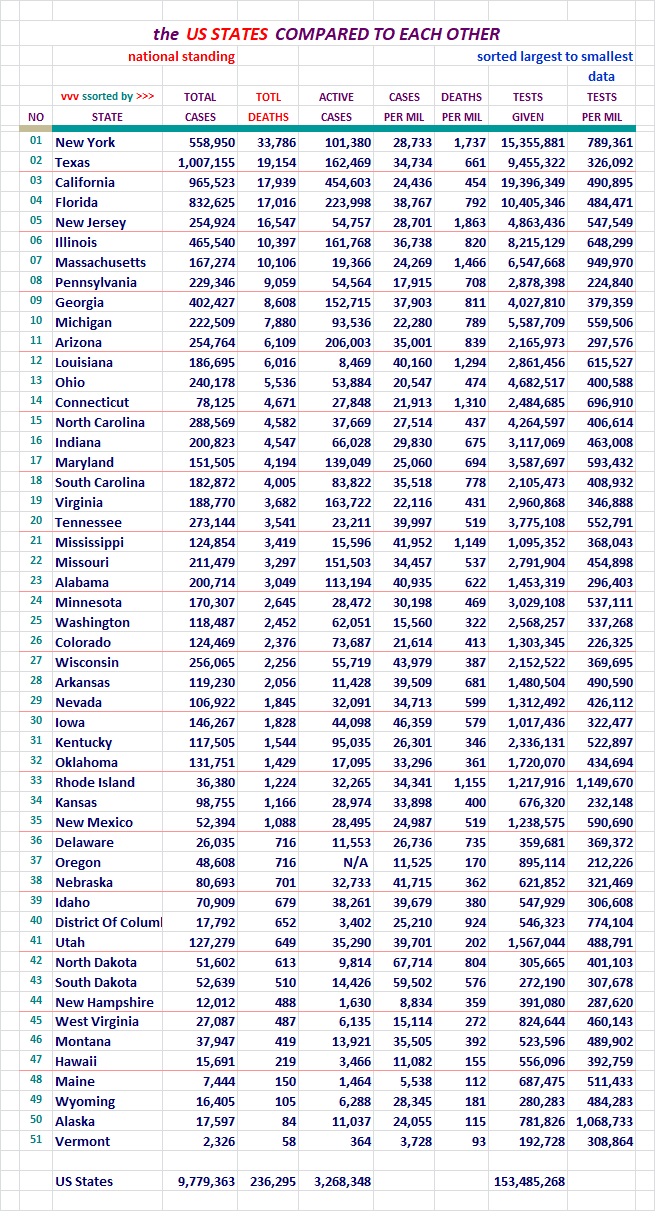
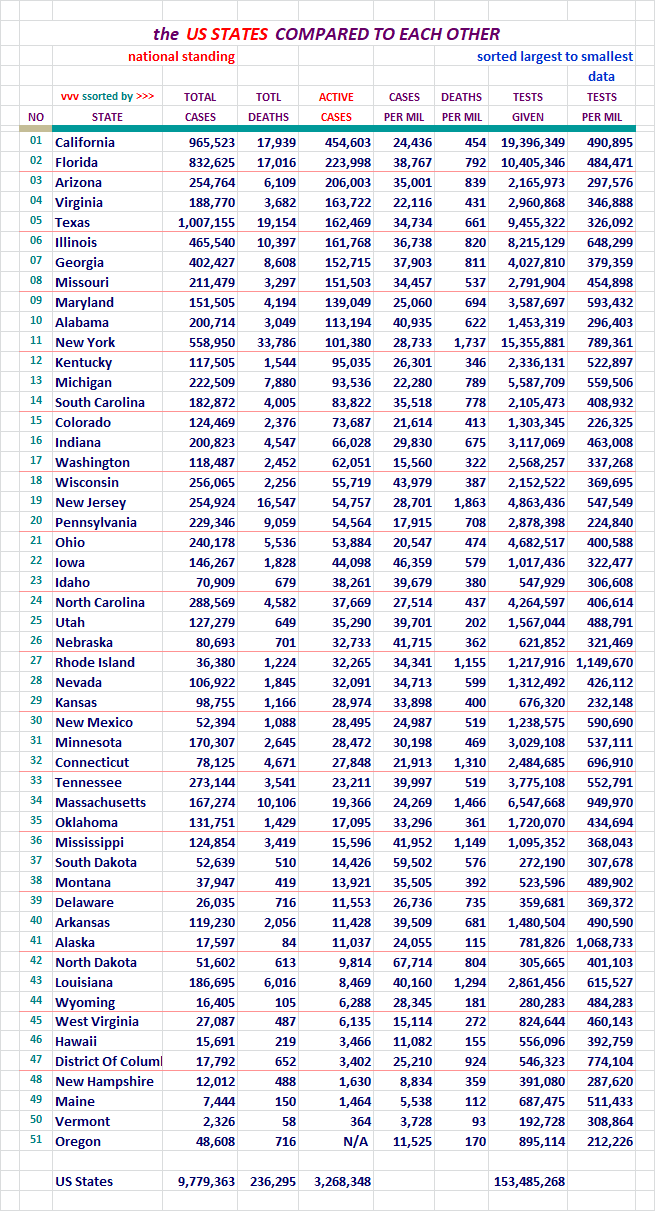
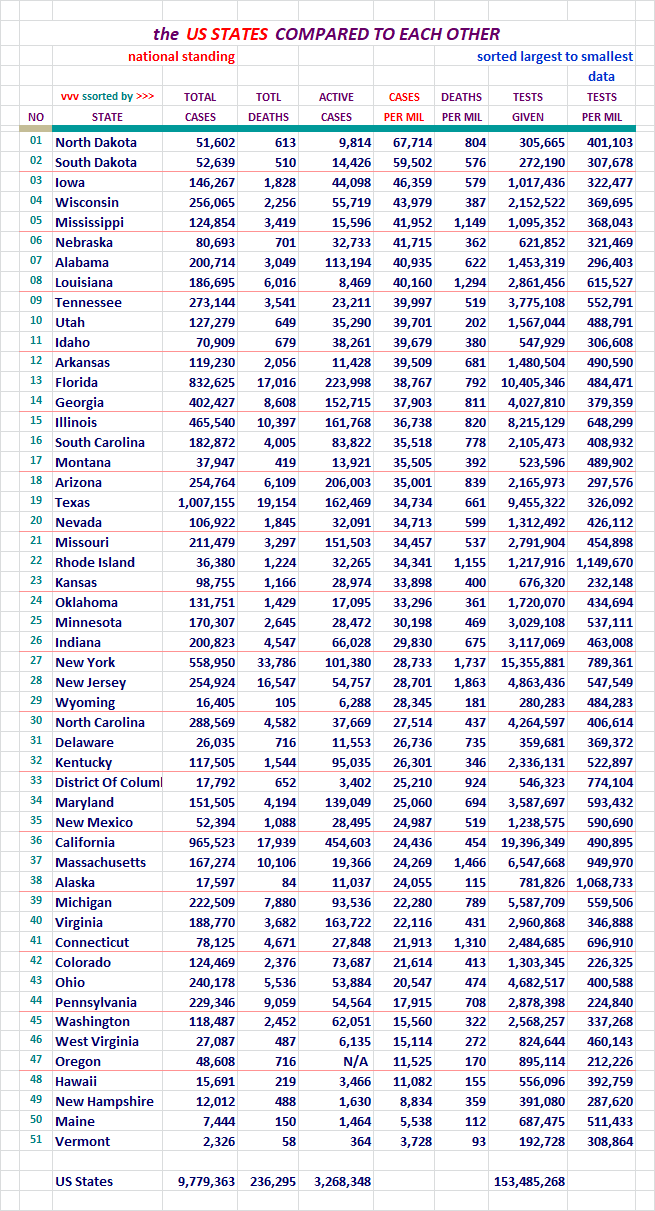
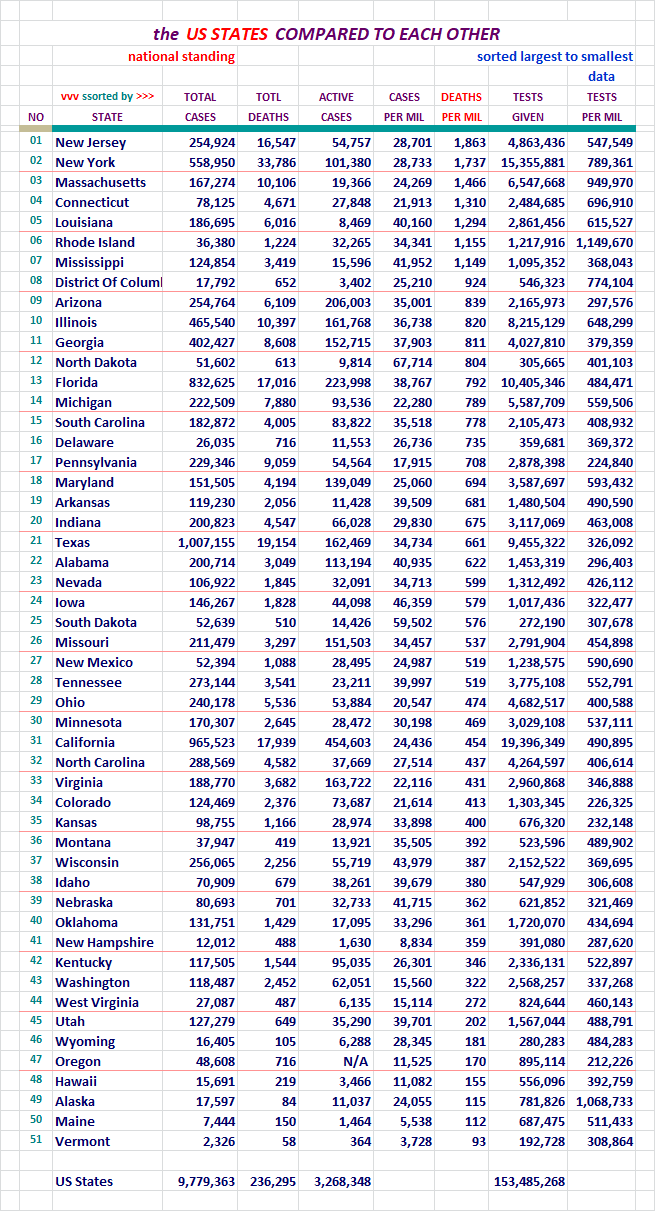
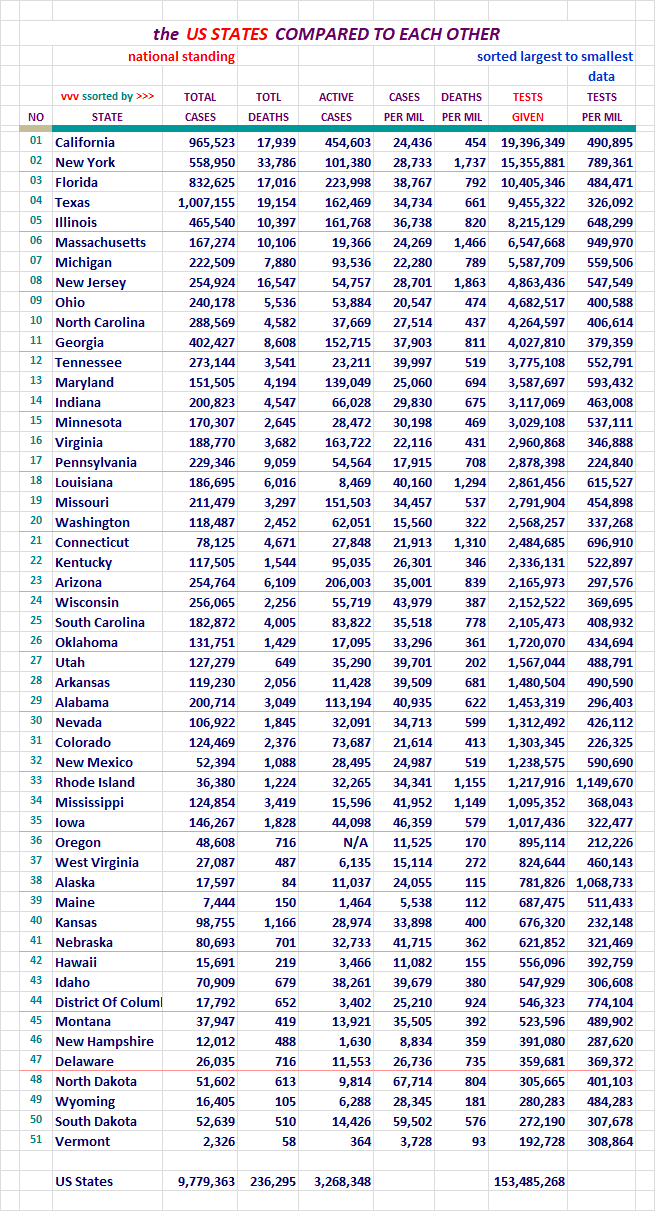
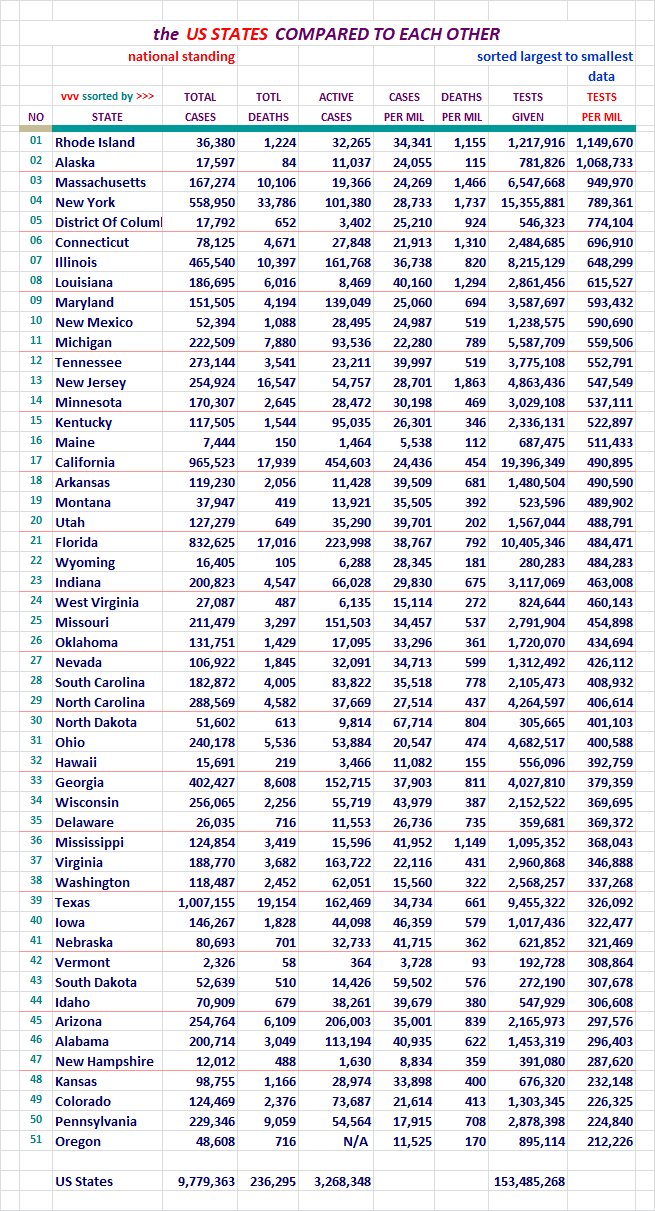
Section: 08
States of the Union and the District of Columbia, Compared to Each Other
Each of these pages is sorted differently. Look at the red header above
the columns to see which column was used for the sort on any given page.
For your review...
For your review...
For your review...
For your review...
For your review...
For your review...
For your review...
For your review...
For your review...
If this area interests you, please use this LINK to the source, and review
the lengthy description and explanation of it's development process.
There are two reports. The presentation above comes from the second one,
and the detailed segmented information below it, may interest you.
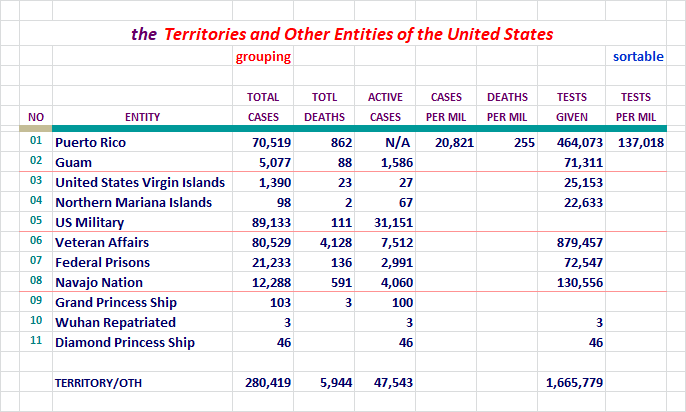
These can now also be found under the states on the Alphabetical list. The
states and these entity's numbers should be combined to match that of the
U. S. figures each day.
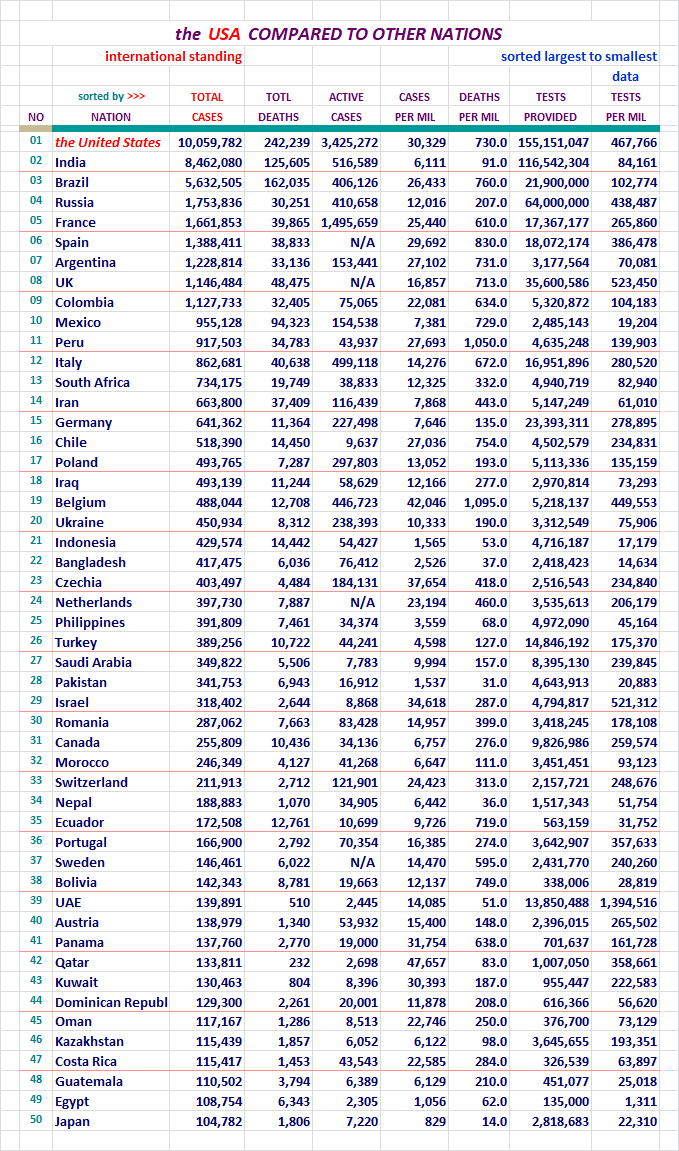
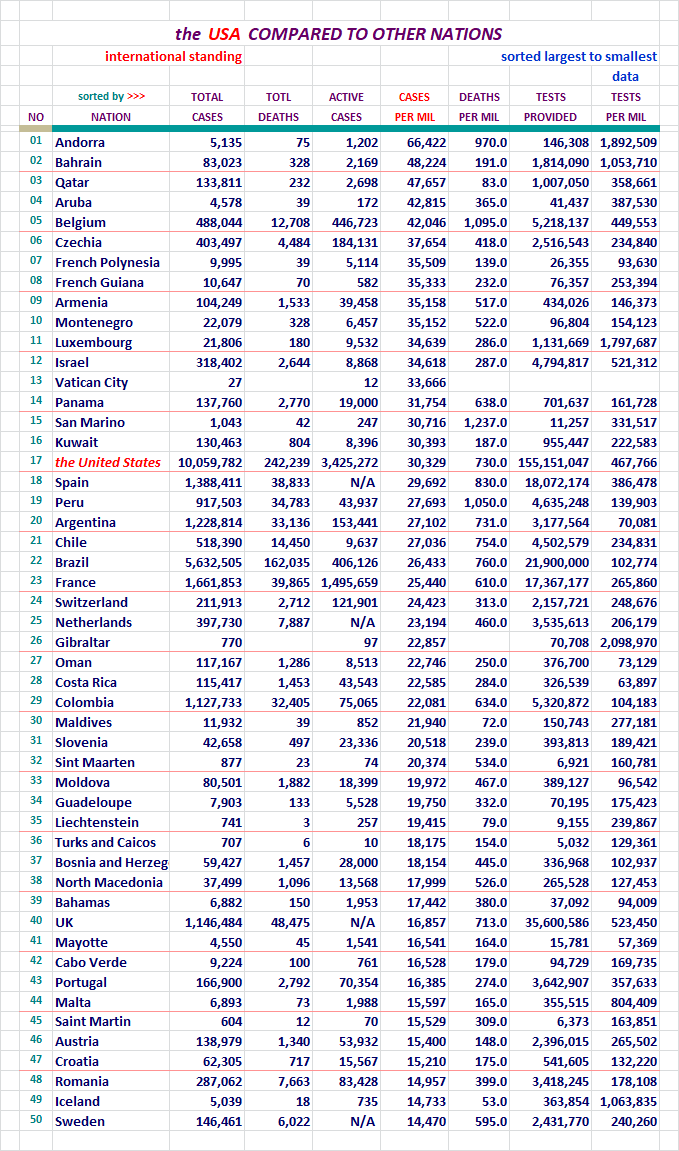
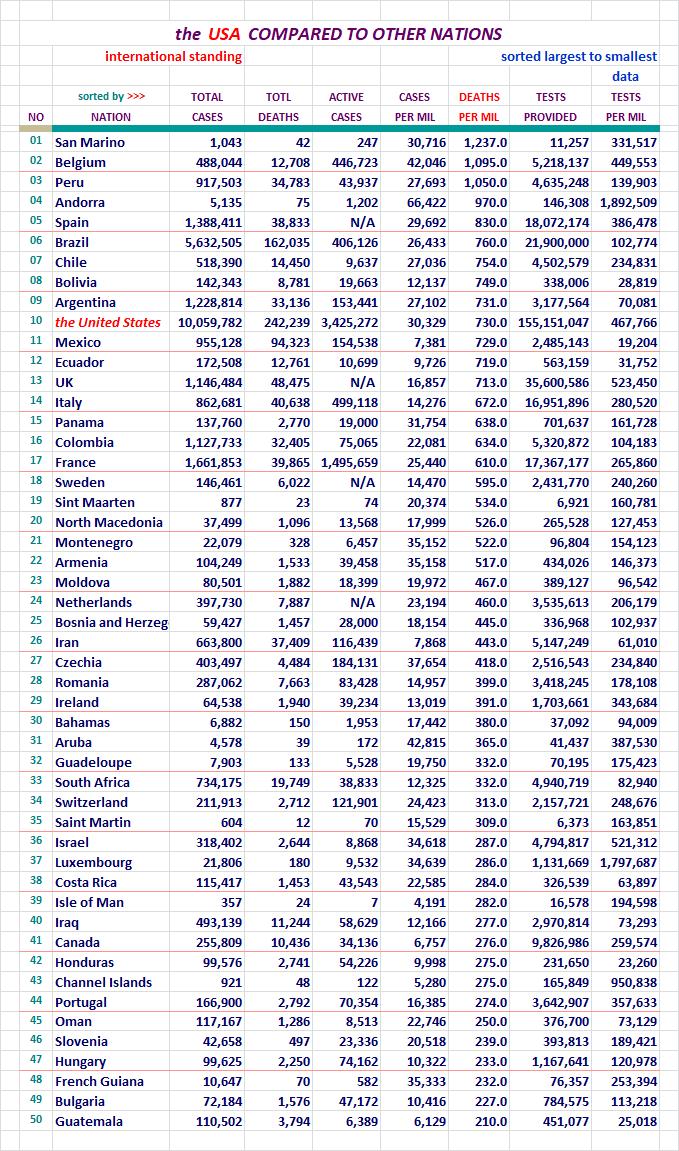
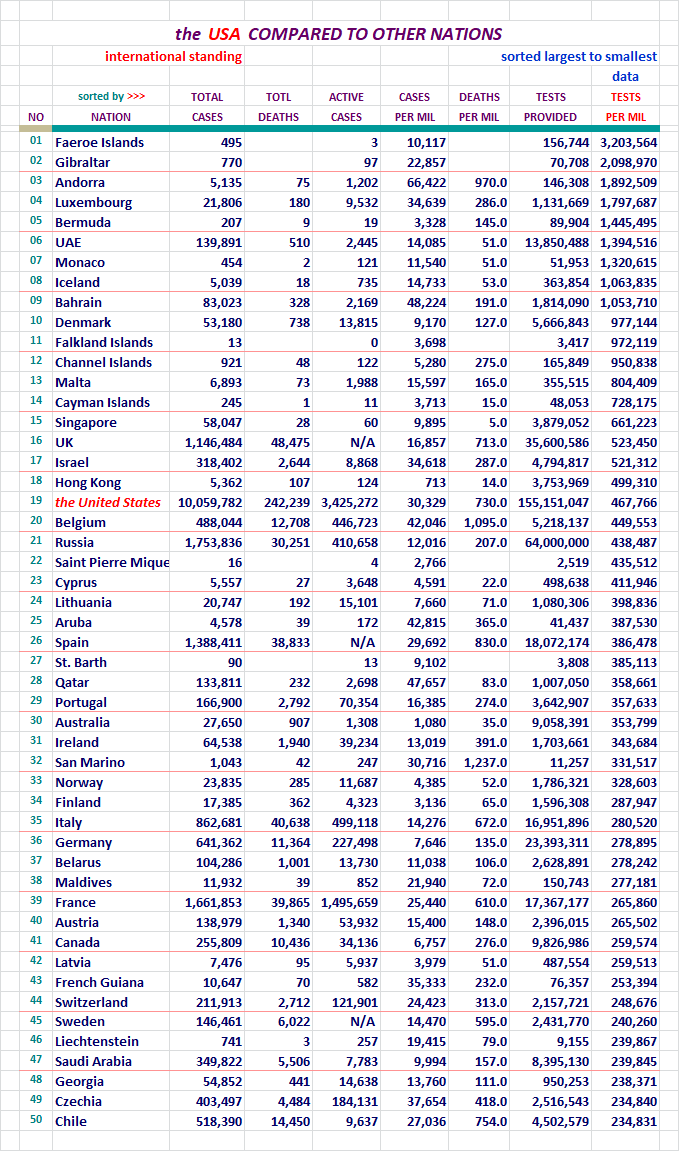
Section: 09
The United States, Where it Ranks With Other Nations?
Each of these pages is sorted differently. Look at the red header above
the columns to see which column was used for the sort on any given page.
The U. S. will be highlighted red here so we can find it easily in the list.
There was 215 nations on this list last night now. I didn't want to post
seven lists with 215 nations on it, so I picked the top 50. Coincidentally,
one report category had the U. S. at 41st, so it wasn't showing up on the
list with the 31 top nations on it. That wasn't the reason why I extended the
list length, but it did work out well.
I work on the nations right next to the states on my spreadsheet. The
states with the District of Columbia come in at a total of 51 lines.
I decided to keep the international reports near that length, and 50
was good enough. Here we go... for your review.
For your review...
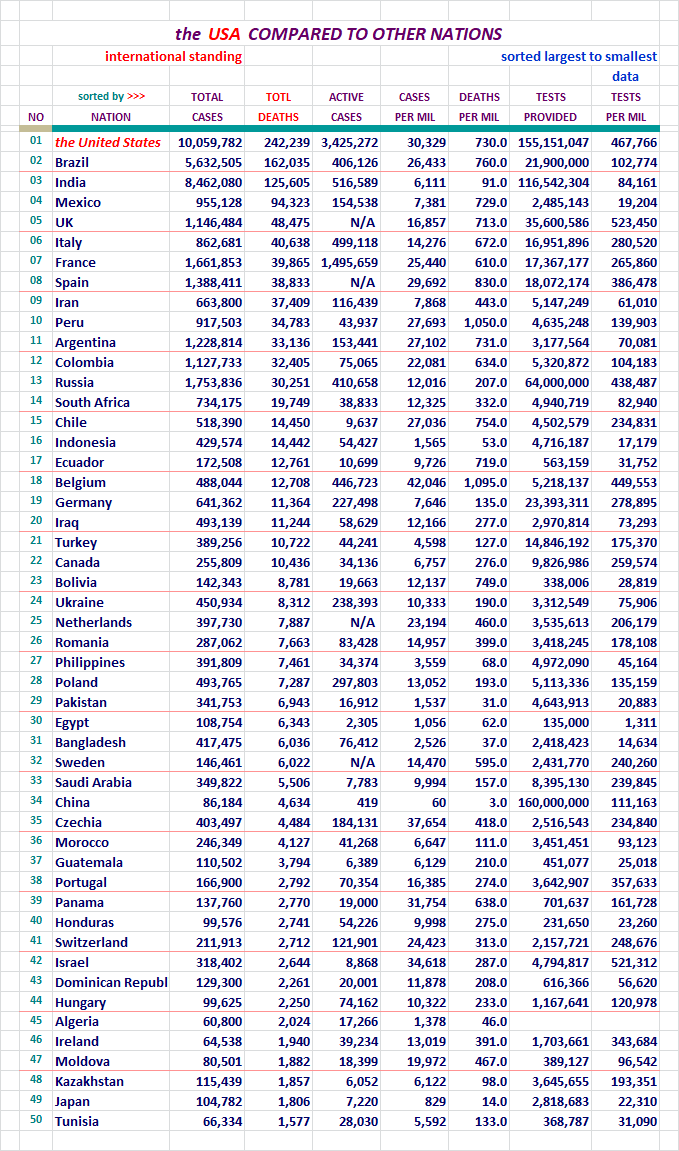
For your review...
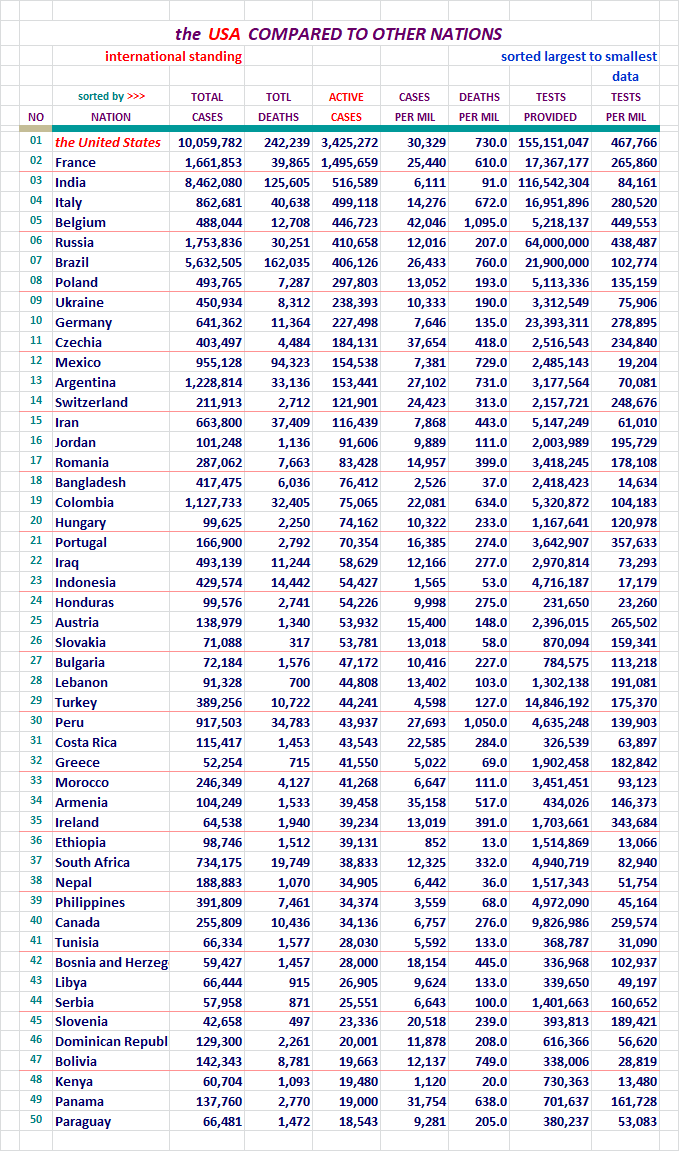
For your review...
For your review...
For your review...
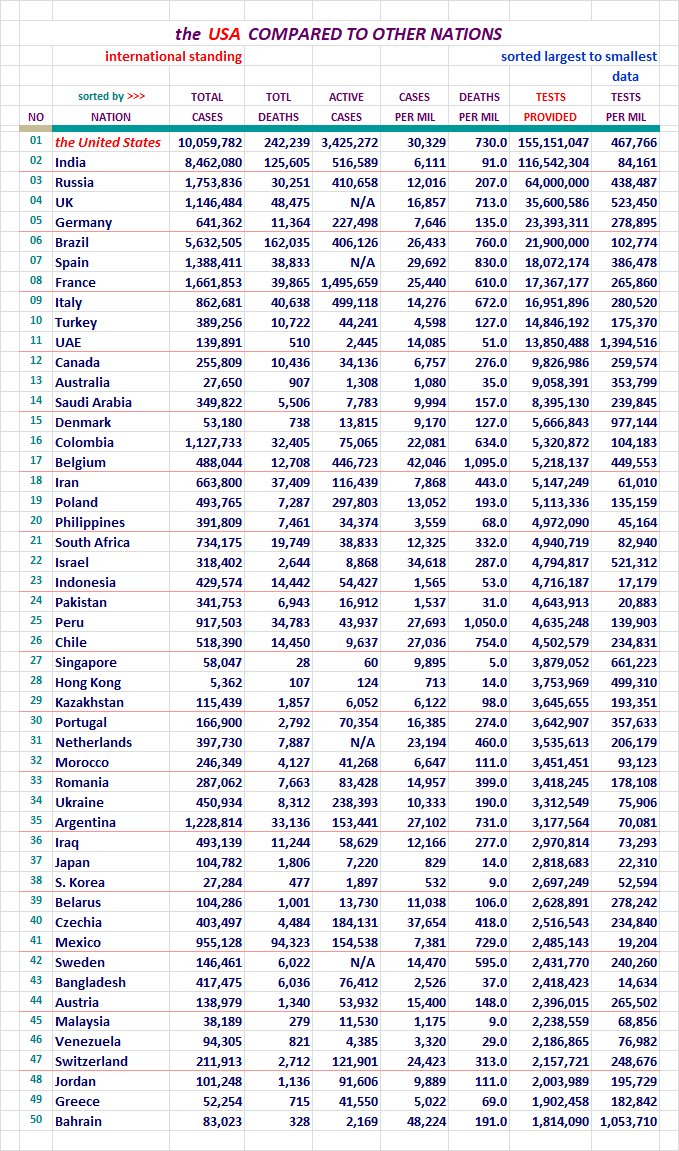
Around 06/23, China started putting out it's testing numbers. I thought
they were suspect. The number they put out was 90,410,000. Ours and most
everyone else's numbers are specific. For instance on 06/28, our number of
of tests at the ned of the day was 32,592,368. That specificity separates it
from the number China put out. It was rounded to the 10 thousandth place. In
addition, China did not update that number until 09/02/20. On that date they
raised the number to 160,000,000. As of October 3rd, 2020, they haven't updeded
it again. So I do not inlude China in the Nation's Comparison Sort regarding
Testing, and any place that reports out global testing numbers for a top level
comparison.
Please note that global testing on the Dashboard was only deducting China's
90,410,000 figure from 09/02 through 10/02/2020. I should have been
deducting the 160,000,000 figure, and all global figures during that period
were 69,590,000 tests too high.
We remained in 19th place yesterday.
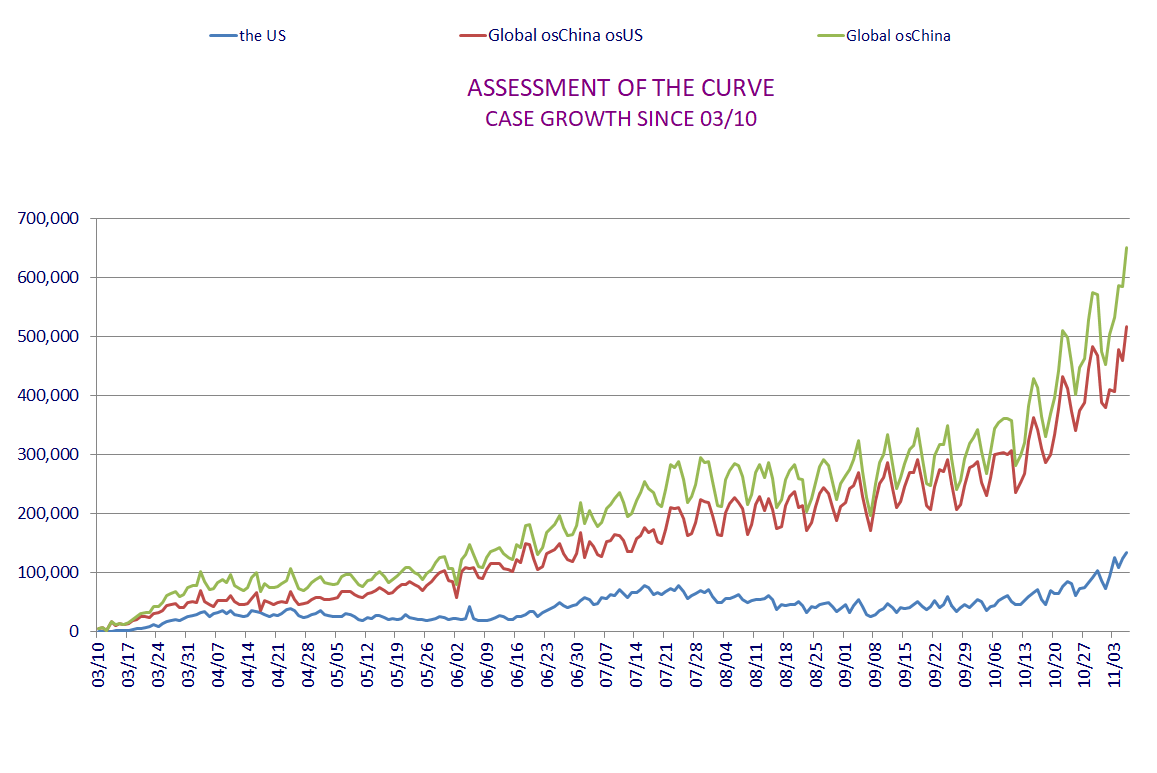
Section: 10
Here is what it is all about. From January 20th to the present.
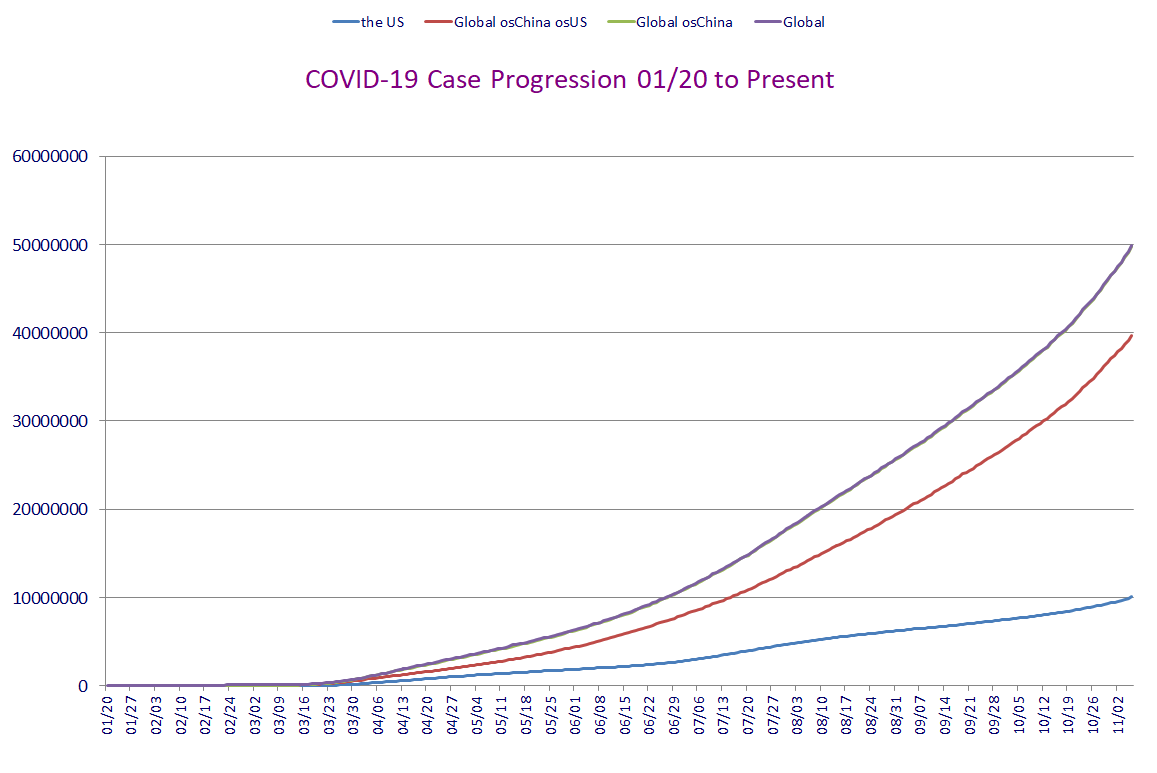
This concludes our look back at yesterday's data. Take care...

Section: 11
Data for this Report Sourced From:
LINK WorldoMeters
LINK Johns Hopkins University
The Center for Systems Science and Engineering (CSSE)
LINK United States Center for Disease Control - Provisional Numbers
Listed in the order of current utilization...
LINK You are Invited to Review My COVID-19 Spreadsheet (XLSX)
There is not an XLS version available for distribution at this time.
Section: 12
Other Features:
LINK US Counties200, States & DC51, Territories & Other Entities11, Nations219,
and the CDC Provisional Counts53
Five Excel Spreadsheet datasets you can sort for your own studies...
Section: 13
Links to other resources:
I cannot vouch for these sites. Please use your own judgement.
LINK Adventist Health Coronavirus Resource Hub - Scroll down for useful info
LINK Antibiotic Vitamin, the (Vitamin D)
Good article on Vitamin D's likely role in prevention of infection. Thanks Blam.
LINK CDC Data for Download - Scroll down - Excel required. Includes death stats.
LINK CDC National Center for Health Services
Provisional deaths as determined by review of vital documents. Much lower...
LINK CDC Secondary Data and Statistics - Portal Entry / Look around
LINK Coronavirus (COVID-19) Map
LINK Coronavirus infection risk may be reduced by Vitamin D
by Former CDC Chief Dr. Tom Frieden
LINK Coronavirus Spread Quickly Around the World in Late 2019, Study Shows
the University College London Genetics Institute
LINK COVID-19 Deaths Broken Out by Thirds, 05/07/20 Map of US Counties
Very revealing display of Concentrated Death Zones - thanks hoosiermama
LINK COVID-19 First U.S. Case, Treatment, features Remdesivir
New England Journal of Medicine article
LINK Cytokine Storm, med Actemra, Physician near death saved
LINK Diamond Princess Review at 634 Case Point of Eventual 712
LINK Hydroxychloroquine Article: International Poll
Daily Mail Reports, Most Effective Treatment According to 6,000 Physicians
LINK Hydroxychloroquine Has about 90 Percent Chance of Helping COVID-19 Patients
the Association of American Physicians and Surgeons, reports 91.6% of patients improved clinically
LINK IHME - Institute for Health Matrix and Evaluation
LINK National Institutes of Health - Cornavirus (COVID-19)
LINK Nasal Irrigation is the Key, COVID-19 Related
LINK New York City - interesting breakdown, borough, age, sex
LINK On the Origin of CCP Virus, A Documentary Movie (turn up the sound)
Epoch Times: I highly recommend this very well documented report.
LINK Rt COVID-19
Calculates and displays the Rt Factor for each state. Thanks FreedomPoster.
LINK World Health Organization

We’re cured! Whoo-hoo!
What’s this Covid you speak of?
Pennsylvania Nursing Home (LTC) death stats for November 7.
Data from PA Department of Health swept as of midnight November 6-7
LTC deaths = 5906 (increase of 3, maybe*)
Total deaths = 9015 (increase of 40, believable)
Cumulative LTC deaths as percentage of total = 65.5%
*”Maybe” because yesterdays LTC subset was greater than the total. The press breathlessly reported that new “cases” aka positive tests exceeded 4000 for the first time....OMG...except that IF all the numbers are correct the mortality rate is just 1.0% or slightly under. 99% of the “cases” do NOT die.
Over the week before the election, I did see some things I
didn’t like, but then I saw silly moves too that couldn’t
have helped the Left, and actually made things look better
momentarily.
So I’m not convinced they played games one way or the other.
That being said, if they were gaming things, Trump may not have been the only goal.
It may be that this is being blown up further at
this point to aid the Leftists in total control.
They can kill off business for their reset plans. They
can keep people at home. They can control movements.
This is what Leftists like to do.
“:^)
Thank you.
COVID what is it?
Thank you so much for condensing this data.
Short of a miracle, I foresee continued uncontrolled spreading.
This will lead to another round of shutdowns.
Only if the American people put up with it. Basic mathematics favors “us” over “them”. Vastly.
Uncontrolled spreading will lead to herd immunity.
The time for “containment” via “contact tracing” ended in March; the time for “containment” via lockdowns ended in April.
Those who want to bunker with Biden until their is a “safe and effective” vaccine are welcome to do so.
Let the rest of us alone!
“Short of a miracle, I foresee continued uncontrolled spreading.
This will lead to another round of shutdowns”
Absolute BS
It is to you and the rest of us here, for all the good that
will do us.
And over on CBS, they waited until NOW to run a piece on 60 Minutes about how Trump’s plan to use the military to deliver 300 million COVID-19 vaccine doses would work...
Maybe I am looking at this incorrectly?
Using the latest data on Worldometers, as I write this, the US has 243,756 fatalities from (or at least partially triggered by) COVID-19, and 6,482,816 recoveries. That works out to 3.624% fatalities out of 6726572 known resolved cases.
Because of the large number of asymptomatic cases, many of which go uncounted, I am willing to accept that 4x the number of known resolved cases are in the form of unaccounted infections (cases). I’ll go even further and assume NONE of those uncounted cases result in a COVID-19 triggered fatality. This results in a simply calculated infection fatality rate of 0.725%.
I further estimate that last number to be “too high” for projection into the future, as a good part of it comes from early on in the pandemic, and we have better treatments now. How high it is, I don’t know. If someone could pull out from the data the numbers of resolved cases and fatalities for just the last two months, a more accurate infection fatality rate projection into the future could likely be estimated.
Now, I am under no illusions as to how long recovered case immunity from COVID-19 may last — it IS a coronavirus, after all. In any event, to attain true “herd immunity” in the US, even on a temporary basis, we need to have, oh, maybe 300 million people as resolved cases in a year or so, assuming no vaccine. I think that’s a reasonable number assuming little to no mitigation.
Even if the infection fatality rate drops as low as 0.2% — this assumes 300 million cases in one year does not swamp the health care system in some periods — this results in 600k fatalities in a year. I find that much “extra” death of my countrymen and women difficult to accept, and I think it is a conservative estimate. It is also almost double what we have averaged so far.
Wouldn’t you know it. Thanks for the mention.
And over on CBS, they waited until NOW to run a piece on 60 Minutes about how Trump’s plan to use the military to deliver 300 million COVID-19 vaccine doses would work...
Needs to be added to the VERY long list of the MANY GREAT President Trump accomplishments/policies/ideas.
IFR is 0.65% per multiple studies released since May. We’ll have safe and effective vaccines in hand this year with ~150 million doses available by Q1 next year. We’re nearing the end of this thing, thanks to President Trump.
If you are familiar with all those studies (I’ve only seen a couple*), then there should be a downward trend in the IFR since May. Is there?
The IFR simply CAN’T be a fixed number while treatments are improving. That said, my 0.725% includes a lot of early cases, so, if it IS 0.65% presently, I’m pretty happy with my guesstimate.
*I’ve seen no study that gives me great confidence in the accuracy of the actual infection rate itself.
My real point, however, was unstated. I wanted to see if certain posters picked it up: Trying to achieve “herd immunity” via infections would be a very costly tactic.
IMO, your assessment of the coming vaccines is correct.
Disclaimer: Opinions posted on Free Republic are those of the individual posters and do not necessarily represent the opinion of Free Republic or its management. All materials posted herein are protected by copyright law and the exemption for fair use of copyrighted works.