Free Republic
Browse · Search
News/Activism
Topics · Post Article

To: expat_panama

That shows 500 billion of sales value. How does that relate to 16 trillion GDP. Does the chart factor inflation?

I’m asking because I don’t know.


55 posted on 12/06/2016 8:16:30 AM PST by Jay Thomas (If not for my faith in Christ, I would despair.)
[ Post Reply | Private Reply | To 52 | View Replies ]


To: Jay Thomas
500 billion of sales value. How does that relate to 16 trillion GDP. Does the chart factor inflation?

Whoa, fabulous questions --learned a lot!

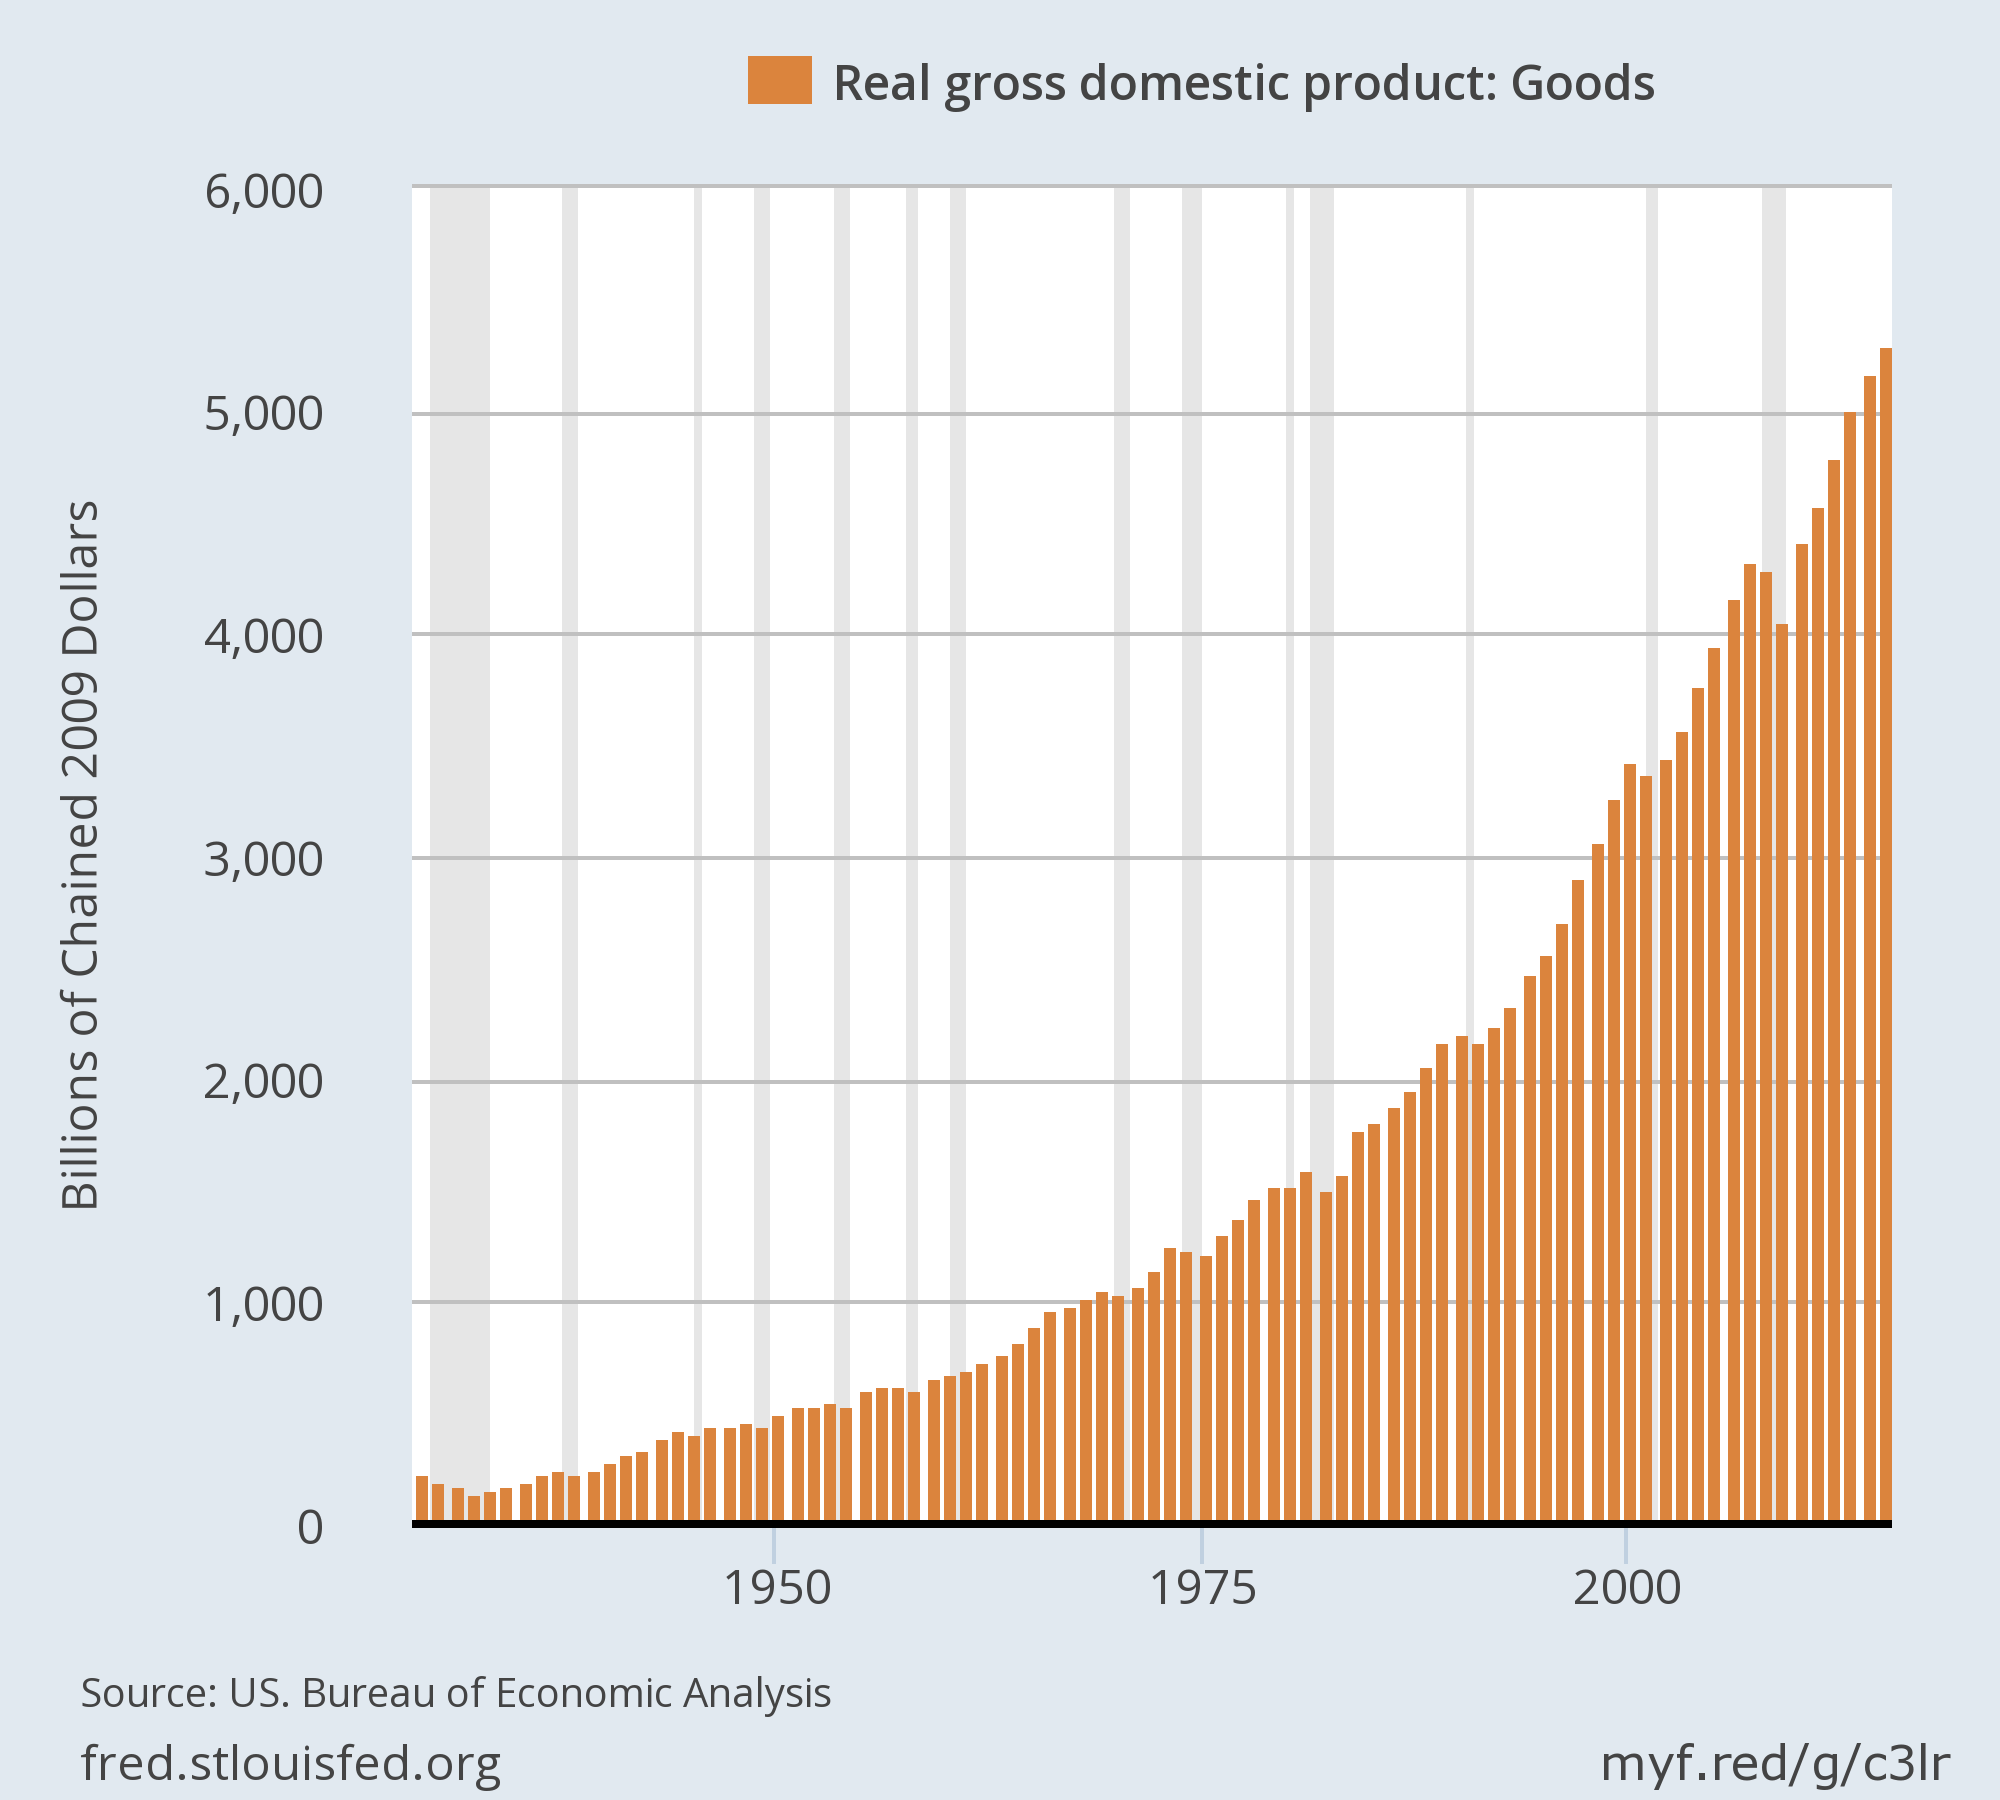
<---   Here's the GDP numbers on goods production using inflation adjusted 2009 dollars.

When I saw how it came out ten times the sales numbers I had to dig a bit and as far as I can tell the production numbers double count all the costs along the way (from raw matls, to refining, parts manufacturing, assembly, etc.) but the sales is the dollar amount of the final transaction.

That's my guess, it's hard to beat the info out of these clowns.


Anyway, fwiw all this stuff comes from the Fed data site; for the gdp I wandered a bit w/ the BEA site which is where the fed gets their GDP numbers but for me the Fed's site is easier to use for making a graph.

57 posted on 12/06/2016 10:56:30 AM PST by expat_panama
[ Post Reply | Private Reply | To 55 | View Replies ]

Free Republic
Browse · Search
News/Activism
Topics · Post Article


FreeRepublic, LLC, PO BOX 9771, FRESNO, CA 93794
FreeRepublic.com is powered by software copyright 2000-2008 John Robinson