Two inches a month? Wow, that's incredible. San Jose, CA had a serious subsidence problem in the late 1800s through the mid 1960s when ground water recharging was resumed. The land did not bounce back as the article points out. Land in San Jose dropped eight feet!
Our worst-ever rate was 8 inches per year, only one-third of the current worst rate. This is bad.
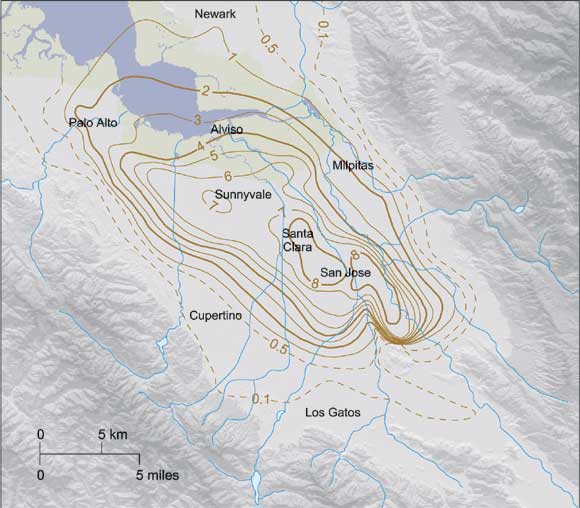
The contour lines on this map of the Santa Clara basin mark equal amounts of land subsidence for the period 1933 to 1967, measured in feet. Additional subsidence occurred before 1934, so the contours only show a portion of the total change. Contours from Poland and Ireland, USGS Professional Paper 497-F (1988)
The map is interesting showing the subsistence is along the general valley
One wonders if the valley is not the result of long term subsistence
Then there is the south end where the contour lines nearly merge. that means a sharp gradient but I can’t interpret what means. Something important seems to be in process in that region