Skip to comments.
States by Economics and Voting (Investment & Finance Thread)
Weekly investment & finance thread ^
| Sept. 7, 2014
| Freeper Investors
Posted on 09/07/2014 12:50:08 PM PDT by expat_panama
Day before yesterday we were checking out this BEA map of the U.S. that was colored/labled by GDP and it got us on to the redstate/bluestate divide.
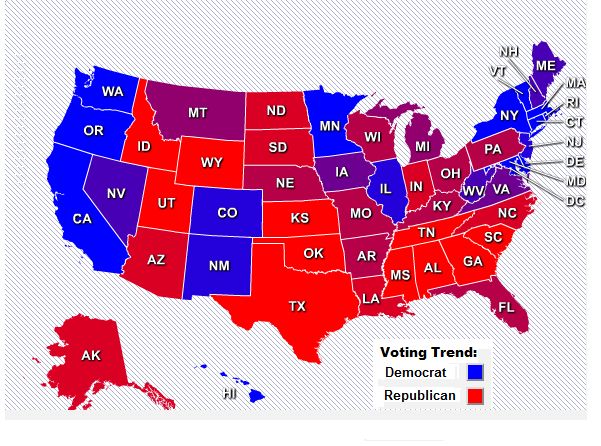 Naturally (as expected) small gov't low tax policies generally flowed with growing economies but what snagged us were the anomalies --Alaska did so poorly yet West Virginia soared. Seems we can overcome that by ourselves and get all the state numbers for GDP from the BEA along w/ employment states by state from the BLS --and then toss them into online mapping websites (I used iMapBuilder Online). Got to just love this info age!! Starting w/ Wikipedia's table of state voting patterns we can have an index (data here) that gives us the standard red/blue state plot: [click image to enlarge]>>> |
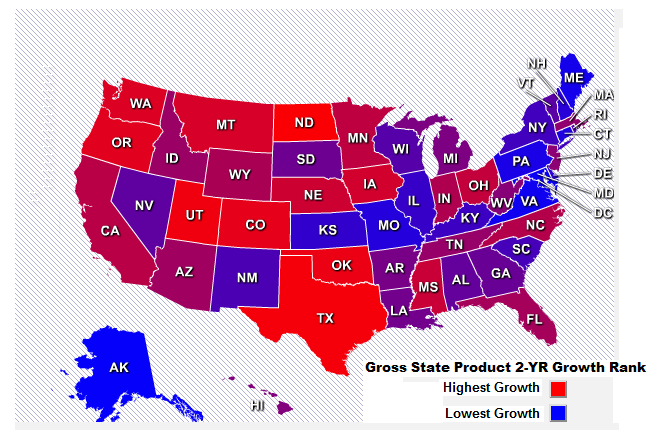 For state economic growth, many of us were skeptical of the BEA's 2013 map so this one on the left is ranking two years of growth. The econ and voting maps are close but they're definitely not identical. The left coast economies show up as strong while Alaska comes out as a low growth state. OK, so while GDP is important it's not everything -- |
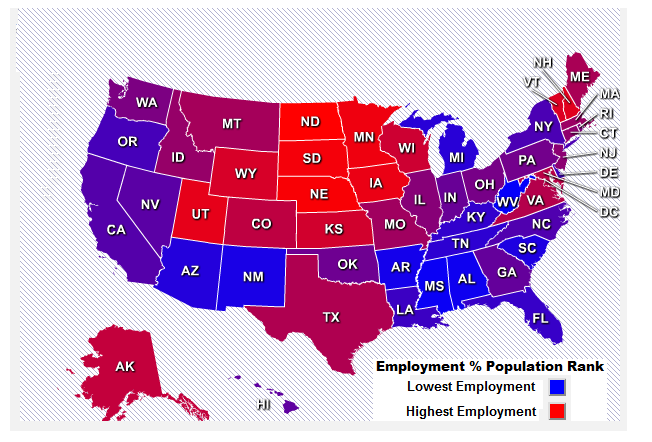 --emploment matters too. Lots of people have seen this headline unemployment map from the BLS showing unemployment by state, but the shrinking workforce goes by state just like it's gone nationwide --that low unemployment rate just means folks gave up job hunting. We need to see the job market in terms of the total population, so here's state employment as a percent of total working age non-institutional groups. mho is that while nothing's solid, we've definitely got trends and voting patterns do show up in economic strength. Don't get me wrong, we all know this is correlation and not causality --it's just as easy to say economies ruined by the right are now making people vote liberal. Uh-huh. |
At any rate the numbers are all out there and this map stuff is easy enough to do --they can even show world maps or state by county maps. What I like is being able to spot how cultural/regional patterns are going w/ the data; one more edge on knowing where things are going and we all need all the help we can get in that department....
TOPICS: Business/Economy; Government; News/Current Events
KEYWORDS: economy; financial; stockmarket; wallstreet
Navigation: use the links below to view more comments.
first previous 1-20, 21-40, 41-60, 61-71 last
To: expat_panama
Rules change when you are not #1 and left yourself vulnerable. Period.
61
posted on
09/11/2014 8:01:34 AM PDT
by
Chgogal
(Obama "hung the SEALs out to dry, basically exposed them like a set of dog balls..." CMH)
To: expat_panama; Wyatt's Torch; Lurkina.n.Learnin
62
posted on
09/11/2014 8:09:33 AM PDT
by
Chgogal
(Obama "hung the SEALs out to dry, basically exposed them like a set of dog balls..." CMH)
To: Chgogal
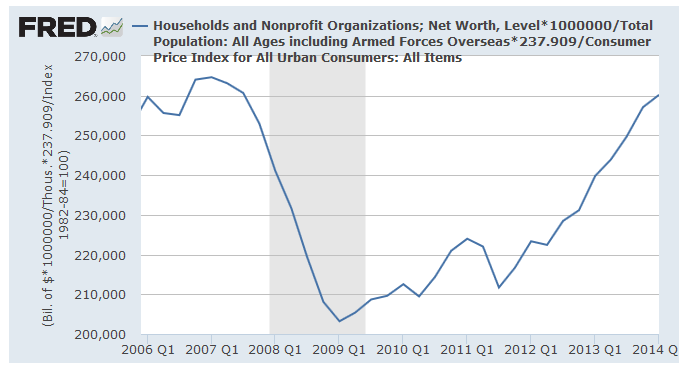
Another mainstream media theme has been that the surging stock market, driven by the Federal Reserve’s monetary interventions, has provided a boost to the overall economy. However, as I have suggested previously, given that the bulk of the population either does not, or only marginally, participates in the financial markets, the “boost” has remained concentrated in the upper 10%. The Federal Reserve study breaks the data down in several ways, but the story remains the same.The median value of financial assets for families has fallen sharply since the turn of the century.
LOL, I was thinking 1900 not 2000. That first dip is the dot.com bust. I have friends who lost 95% of their wealth. They had to go back to work!!! Then 9/11 came, then 9/2008 and finally 11/2008. You have to admit the US is doing OK considering all the hits we took.
63
posted on
09/11/2014 8:53:01 AM PDT
by
Chgogal
(Obama "hung the SEALs out to dry, basically exposed them like a set of dog balls..." CMH)
To: Chgogal
The “rich” get richer but they are the ones who invest. And the ones who don’t, don’t participate...
All of this is exacerbated by a federal government that is doing its best to choke off all avenues of growth.
IMHO the economy is as “good” as it is (~2%) thanks to: accomodative Fed policy, the shale revolution, and productivity due to right sizing post Lehman.
To: Wyatt's Torch; Chgogal
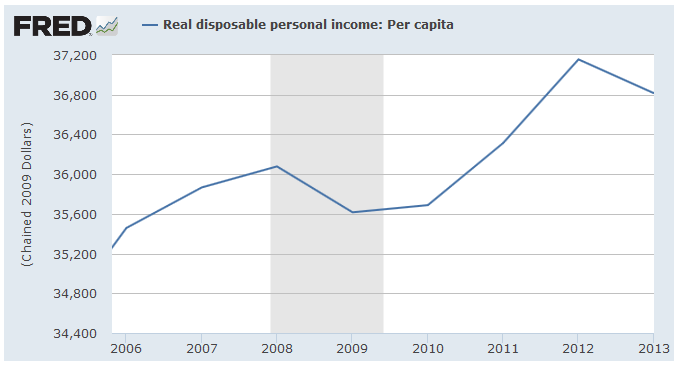
The “rich” get richer...Everyone says that and as far as I can tell the main reference source cited is that well, everyone says that! OK, so real incomes are up on average by $737 annually, but real average American net worth is down $4,441 each. Those total average numbers are clear and based on areas of study (bank audits, GDP, etc.) that the working-for-a-living crowd has been able to work with for decades.
A problem I got w/ this income-inequality line is that very few of the advocates have hard numbers that 'splain what they mean--and what little they do got are from census.gov where not only is the methodology specious but the results are so twisted/perverted that they don't even agree w/ the Fed, the BLS, or the BEA.
To: expat_panama
This chart in the link posted in the post I replied to is what triggered that comment:

To: Wyatt's Torch
It is still “forecasting.”
Back when I toiled for wages, one of my duties besides selling was to estimate costs for the machinery fabrication we produced. We were in our Monday Morning Meeting (MMM) when one of the bosses blurted out. “Cut the bullshit Abbott!! Exactly how much will it cost us to build it?”
My reply: “I don’t know. If I KNEW, it would be called “knowing” instead of “estimating. And if I knew, I would be working for myself and getting rich.”
67
posted on
09/11/2014 10:55:53 AM PDT
by
abb
("News reporting is too important to be left to the journalists." Walter Abbott (1950 -))
To: abb
LOL! My first CEO told me, “the one thing I know is that your forecast is wrong. Every forecast is wrong. Let’s just work to minimize the error.” 20 years later I still live by that. Best advice I have ever gotten on forecasting/planning.
To: Wyatt's Torch; Chgogal
Right, and I'm definitely grateful to
Chgogal for the heads up on
the Lance Roberts piece because now I know about
the fed's SCF --which is exactly what I'm talking about. When the fed tot's up say, deposit accounts, the numbers are super easy to find and download. The SCF files are a mess and my guess is that the reason for the mess is that the topic is a hot-button faction battleground right in there w/ global warming.
For decades the census.gov has worked with income distribution and their results supported the same old leftwing rich>richer+poor>poorer line --but the results were based on data that contradicted themselves as well as those of other agencies. In the mean time all I can say is it's just like global warming; the burden of proof is on the advocate and so far he's failed to present a credible case.
To: A Cyrenian; abb; Abigail Adams; abigail2; AK_47_7.62x39; Aliska; Aquamarine; ...

Happy Friday everyone! Stock indexes have been up in mixed volume another day and futures see more mixed trade. Metals continue yesterdays slump into this morning. Big Friday document dump--
Retail Sales
Retail Sales ex-auto
Export Prices ex-ag.
Import Prices ex-oil
Mich Sentiment
Business Inventories
-- elsewhere...
To: Chgogal
the US is doing OK considering all the hits we took. Sometimes it's like the used car salesman's "it's in great condition considering the shape it's in".--but I know what you mean and you're absolutely right. Doesn't pay to underestimate America's power, those that have came to regret it.
Navigation: use the links below to view more comments.
first previous 1-20, 21-40, 41-60, 61-71 last
Disclaimer:
Opinions posted on Free Republic are those of the individual
posters and do not necessarily represent the opinion of Free Republic or its
management. All materials posted herein are protected by copyright law and the
exemption for fair use of copyrighted works.
FreeRepublic.com is powered by software copyright 2000-2008 John Robinson
