Additional various data and stats from recent years:
Rank | City | Percentage of City Population |
GLB Population | ||||||||||||||||||||||||||||||||||||||||||||||||||||||||||||||||||||||||||||||||||||||||||||||||||||||||||||||||||||||||||||||||||||||||||||||||||||||||||||||||||||||||||||||||||||||||||||||||||||||||||||||||||||||||||||||||||||||||||||||||||||||||||||||||||||||||||||||||||||||||||||||||||||||||||||||||||||||||||||||||
---|---|---|---|---|---|---|---|---|---|---|---|---|---|---|---|---|---|---|---|---|---|---|---|---|---|---|---|---|---|---|---|---|---|---|---|---|---|---|---|---|---|---|---|---|---|---|---|---|---|---|---|---|---|---|---|---|---|---|---|---|---|---|---|---|---|---|---|---|---|---|---|---|---|---|---|---|---|---|---|---|---|---|---|---|---|---|---|---|---|---|---|---|---|---|---|---|---|---|---|---|---|---|---|---|---|---|---|---|---|---|---|---|---|---|---|---|---|---|---|---|---|---|---|---|---|---|---|---|---|---|---|---|---|---|---|---|---|---|---|---|---|---|---|---|---|---|---|---|---|---|---|---|---|---|---|---|---|---|---|---|---|---|---|---|---|---|---|---|---|---|---|---|---|---|---|---|---|---|---|---|---|---|---|---|---|---|---|---|---|---|---|---|---|---|---|---|---|---|---|---|---|---|---|---|---|---|---|---|---|---|---|---|---|---|---|---|---|---|---|---|---|---|---|---|---|---|---|---|---|---|---|---|---|---|---|---|---|---|---|---|---|---|---|---|---|---|---|---|---|---|---|---|---|---|---|---|---|---|---|---|---|---|---|---|---|---|---|---|---|---|---|---|---|---|---|---|---|---|---|---|---|---|---|---|---|---|---|---|---|---|---|---|---|---|---|---|---|---|---|---|---|---|---|---|---|---|---|---|---|---|---|---|---|---|---|---|---|---|---|---|---|---|---|
population | |||||||||||||||||||||||||||||||||||||||||||||||||||||||||||||||||||||||||||||||||||||||||||||||||||||||||||||||||||||||||||||||||||||||||||||||||||||||||||||||||||||||||||||||||||||||||||||||||||||||||||||||||||||||||||||||||||||||||||||||||||||||||||||||||||||||||||||||||||||||||||||||||||||||||||||||||||||||||||||||||||
1 | San Francisco | 15.4% | 94,234 | ||||||||||||||||||||||||||||||||||||||||||||||||||||||||||||||||||||||||||||||||||||||||||||||||||||||||||||||||||||||||||||||||||||||||||||||||||||||||||||||||||||||||||||||||||||||||||||||||||||||||||||||||||||||||||||||||||||||||||||||||||||||||||||||||||||||||||||||||||||||||||||||||||||||||||||||||||||||||||||||||
2 | Seattle | 12.9% | 57,993 | ||||||||||||||||||||||||||||||||||||||||||||||||||||||||||||||||||||||||||||||||||||||||||||||||||||||||||||||||||||||||||||||||||||||||||||||||||||||||||||||||||||||||||||||||||||||||||||||||||||||||||||||||||||||||||||||||||||||||||||||||||||||||||||||||||||||||||||||||||||||||||||||||||||||||||||||||||||||||||||||||
3 | Atlanta | 12.8% | 39,805 | ||||||||||||||||||||||||||||||||||||||||||||||||||||||||||||||||||||||||||||||||||||||||||||||||||||||||||||||||||||||||||||||||||||||||||||||||||||||||||||||||||||||||||||||||||||||||||||||||||||||||||||||||||||||||||||||||||||||||||||||||||||||||||||||||||||||||||||||||||||||||||||||||||||||||||||||||||||||||||||||||
4 | Minneapolis | 12.5% | 34,295 | ||||||||||||||||||||||||||||||||||||||||||||||||||||||||||||||||||||||||||||||||||||||||||||||||||||||||||||||||||||||||||||||||||||||||||||||||||||||||||||||||||||||||||||||||||||||||||||||||||||||||||||||||||||||||||||||||||||||||||||||||||||||||||||||||||||||||||||||||||||||||||||||||||||||||||||||||||||||||||||||||
5 | Boston | 12.3% | 50,540 | ||||||||||||||||||||||||||||||||||||||||||||||||||||||||||||||||||||||||||||||||||||||||||||||||||||||||||||||||||||||||||||||||||||||||||||||||||||||||||||||||||||||||||||||||||||||||||||||||||||||||||||||||||||||||||||||||||||||||||||||||||||||||||||||||||||||||||||||||||||||||||||||||||||||||||||||||||||||||||||||||
6 | Sacramento | 9.8% | 32,108 | ||||||||||||||||||||||||||||||||||||||||||||||||||||||||||||||||||||||||||||||||||||||||||||||||||||||||||||||||||||||||||||||||||||||||||||||||||||||||||||||||||||||||||||||||||||||||||||||||||||||||||||||||||||||||||||||||||||||||||||||||||||||||||||||||||||||||||||||||||||||||||||||||||||||||||||||||||||||||||||||||
7 | Portland | 8.8% | 35,413 | ||||||||||||||||||||||||||||||||||||||||||||||||||||||||||||||||||||||||||||||||||||||||||||||||||||||||||||||||||||||||||||||||||||||||||||||||||||||||||||||||||||||||||||||||||||||||||||||||||||||||||||||||||||||||||||||||||||||||||||||||||||||||||||||||||||||||||||||||||||||||||||||||||||||||||||||||||||||||||||||||
8 | Denver | 8.2% | 33,698 | ||||||||||||||||||||||||||||||||||||||||||||||||||||||||||||||||||||||||||||||||||||||||||||||||||||||||||||||||||||||||||||||||||||||||||||||||||||||||||||||||||||||||||||||||||||||||||||||||||||||||||||||||||||||||||||||||||||||||||||||||||||||||||||||||||||||||||||||||||||||||||||||||||||||||||||||||||||||||||||||||
9 | Washington | 8.1% | 32,599 | ||||||||||||||||||||||||||||||||||||||||||||||||||||||||||||||||||||||||||||||||||||||||||||||||||||||||||||||||||||||||||||||||||||||||||||||||||||||||||||||||||||||||||||||||||||||||||||||||||||||||||||||||||||||||||||||||||||||||||||||||||||||||||||||||||||||||||||||||||||||||||||||||||||||||||||||||||||||||||||||||
10 | Orlando | 7.7% | 12,508 |
2012
A Gallup report published in October 2012 by the Williams Institute reported that 3.4% of US adults identify as lesbian, gay, bisexual or transgender. Minorities were more likely to identify as non-heterosexual; 4.6% of blacks, 4.0% of Hispanics and 3.2% of whites. Younger people, aged 18-29, were three times more likely to identify as LGBT than seniors over the age of 65, the numbers being 6.4% and 1.9%, respectively.[18][19]
The U.S. census has never asked Americans about their religion or religious beliefs.[1] Thus, the data here comes from Gallup, which polled Americans about their religious beliefs since 1948. Blank means that there is no data available for a given year. All of the percentages here are rounded, so 0% could actually mean 0.01% to 0.49% if one would be able to see the entire number.[2]
The percentage of Protestants in the United States has decreased from over two-thirds in 1948 to less than half by 2011. This decline in Protestant immigration has corresponded to the relaxation of immigration restrictions pertaining to mostly non-Protestant counties. The percentage of Catholics in the United States increased from 1948 all the way to the 1980s, but then began declining again. The percentage of Jews in the United States has decreased from 4% to 2% during this same time period. There has been very little Jewish immigration to the U.S. after 1948 in comparison to previous years. The number of people with other religions was almost nonexistent in 1948, but rose to 5% by 2011, partially due to large immigration from non-Christian countries. The percentage of non-religious people (atheists, agnostics, and irreligious) people in the U.S. has drastically increased from 2% to 13%. The number of Americans unsure about their religion and religious beliefs stayed roughly the same over the years, always hovering at 0% to 4%.[2]
Over the last 19 years, some of the more traditional Protestant denominations/branches experienced a large decline as a percentage of the total American population. These include Southern Baptists, Methodists, Presbyterians, Episcopalians, and Other Protestants. The only Protestant branch that significantly increased its percentage share over the last 19 years is non-denominational Protestanism. The Protestants who were unsure about which branch of Protestanism they believed in also drastically declined as a percentage of the U.S. population over the last 19 years.[2]
|
Boston is #91 out of 96. I’m sort of surprised we’re not lower.
A non denominational Christian isn’t a Protestant?
83% percent of Americans identified themselves as Christians (Catholics or Protestants), but only 49% of these individuals described themselves as absolutely committed to Christianity. http://www.barna.org/congregations-articles/103-barnas-annual-tracking-study-shows-americans-stay-spiritually-active-but-biblical-views-wane?q=salvation
49% of adults identify themselves as attenders of Protestant churches, while 23% say they attend the Catholic segment. ^
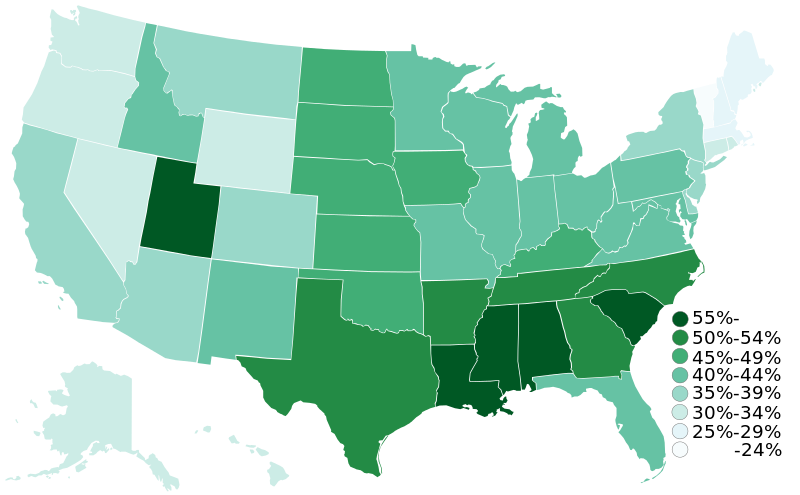
States with highest ratio of religious adherents (http://ext.nazarene.org/rcms/stateswithhighestratioadherents.html Association of Religion Data Archives www.TheARDA.com):
1 Utah 74.7%
2 North Dakota 73.2%
3 District Of Columbia 73.2%
4 South Dakota 67.8%
----------------------------
4 States with lowest ratio adherents
48 Alaska 34.3%
49 Nevada 34.3%
50 Washington 33.0%
51 Oregon 31.3%
State ranking according to survey response as to religion being an important part of peoples daily lives. (highest to lowest): * Mississippi: 85% * Alabama: 82% * South Carolina: 80% * Tennessee: 79% * Louisiana: 78% * Arkansas: 78% * Georgia: 76% * North Carolina: 76% * Oklahoma: 75% * Kentucky: 74% * Texas: 74% * West Virginia: 71% * Kansas: 70% * Utah: 69% * Missouri: 68% * Virginia: 68% * South Dakota: 68% * North Dakota: 68% * Indiana: 68% * Nebraska: 67% * New Mexico: 66% * Pennsylvania: 65% * Florida: 65% * Maryland: 65% * Ohio: 65% * Iowa: 64% * Minnesota: 64% * Illinois: 64% * Michigan: 64% * Delaware: 61% * Wisconsin: 61% * District of Columbia: 61% * Idaho: 61% * Arizona: 61% * New Jersey: 60% * Wyoming: 58% * Colorado: 57% * Hawaii: 57% * California: 57% * Montana: 56% * New York: 56% * Connecticut: 55% * Nevada: 54% * Rhode Island: 53% * Oregon: 53% * Washington: 52% * Alaska: 51% * Massachusetts: 48% * Maine: 48% * New Hampshire: 46% * Vermont: 42%. Overall nationwide mean of 65% http://www.gallup.com/poll/114022/State-States-Importance-Religion.aspx
The Eastern United States is the only region of the country where Protestants account for less than half (44.1%) of the population. Catholics are the best represented religious tradition in this region; claiming 35.1% of the population. 5.5Baylor Institute for Studies of Religion - American Piety in the 21 Century September 2006 . Baylor Institute for Studies of Religion - American Piety in the 21 Century September 2006 . http://www.baylor.edu/content/services/document.php/33304.pdf
The West has the highest percentages of religiously unaffiliated people (17.6%) and people in other religious traditions (10.3%) of any U.S. Region. Baylor Institute for Studies of Religion^
According to a Barna research report issued October 11, 2010, The 10 most unchurched cities where around four out of ten adults have not been to a religious worship service in the last six months are San Francisco (44%); Portland, Maine (43%); Portland, Ore. (42%); Albany NY (42%); Boston (40%); Sacramento (40%); and Seattle (40%); Spokane (39%);, New York (38%); Phoenix (38%); Tucson (37%). . http://www.barna.org/faith-spirituality/435-diversity-of-faith-in-various-us-cities
The cities (measured in the Barna research as media markets) with the highest proportion of residents who describe themselves as Christian are typically in the South, including: Shreveport (98%), Birmingham (96%), Charlotte (96%), Nashville (95%), Greenville, SC / Asheville, NC (94%), New Orleans (94%), Indianapolis (93%), Lexington (93%), Roanoke-Lynchburg (93%), Little Rock (92%), and Memphis (92%). ^
73% of the populations of Charlotte and Shreveport held scripture in high regard, versus only 27% of the residents of Providence, Rhode Island (the most Catholic state) and San Francisco (the most homosexual large city). ^
64% of Birmingham and 54% of Charlotte said they strongly agreed that a person has a responsibility to share their beliefs with others, versus only 14% of residents of Providence R.I. and 17% of Bostonians agreed. ^
The highest percentages of residents who describe themselves as Christian are typically in the South, including: Shreveport LA (98%), Birmingham (96%), Charlotte (96%), Nashville (95%), Greenville, SC / Asheville, NC (94%), New Orleans (94%), Indianapolis (93%), Lexington (93%), Roanoke-Lynchburg (93%), Little Rock (92%), and Memphis (92%)
73% of the populations of Charlotte and Shreveport held scripture in high regard, versus only 27% of the residents of Providence, Rhode Island [the most Catholic state] and San Francisco [the most homosexual large city]. ^
The lowest percentages of self-identified Christians inhabited the following markets: San Francisco (68%), Portland, Oregon (71%), Portland, Maine (72%), Seattle (73%), Sacramento (73%), New York (73%), San Diego (75%), Los Angeles (75%), Boston (76%), Phoenix (78%), Miami (78%), Las Vegas (78%), and Denver (78%). Even in these cities, however, roughly three out of every four residents align with Christianity. ^
The highest percentage of souls who tended toward being atheist or agnostic were in Portland, Maine (19%), Seattle (19%), Portland, Oregon (16%), Sacramento (16%), and Spokane (16%) ^
Commitment to evangelism (agree strongly that a person has a responsibility to share their beliefs with others) saw the greatest percentage of endorsement by residents of Birmingham (64%) and Charlotte (54%), in contrast to residents of Providence (14%) and Boston (17%). ^
Also, you may want to see extensive chart of statistical correlations
2012 voting (Blue=Obama; Red=Romney
2007 Religious Demographic maps (Evang. Cath. etc.)
Ping of interest
Probably because it is a college town. These kind of people tend to believe that the Bible is a myth and Keynesian economics and global warming is real.
I must be missing the point - what does Bible-Minded mean?
Daniel...you never fail to provide statistics that many Christians find absolutely fascinating...I have quite a few bookmarked.
Notice the correlation in the statistics, the least Bible minded and liberal area of the country, the Northeast, is heavily Catholic, and always vote Democrat. Whilst the most Bible minded areas of the country, the south and midwest, are heavily Protestant, and vote Republican.
Yet FR, an obviously Catholic site, its Religious section flogging Protestants in one thread after another, is a very conservative site. Go figure.
#32
The least Bible-oriented markets include a mix of regions, but tend to be from the New England area. Easily the lowest Bible-minded scores came from Providence, RI (9%) and Albany, NY (10%). To put this in perspective, the most Bible-minded markets are five times more likely to have residents who qualify as Bible-minded than is true in these two Northeastern cities.
Ping to read and digest later.
Snort. There's a church on every corner around here. I don't buy it. Even Las Vegas has many more church-goers than, say, San Francisco or Seattle.
My daughter lives in LA and there are some absolutely enormous churches there that have VERY active ministries and outreaches.
Bible minded or not, there is a lot of evangelism going on.
lots of info here I don’t wanna lose.
so bttt... and bookmarked
Now if only Knoxville could just get a Conservative daily news media outlet such as a newspaper or TV station. The market should be there as the consumer base is there. The daily paper is mostly left leaning with a Denver area Editor & Scripts owned. Usually the only positive Conservative news in the paper is posted in the comments to follow by readers after the articles.