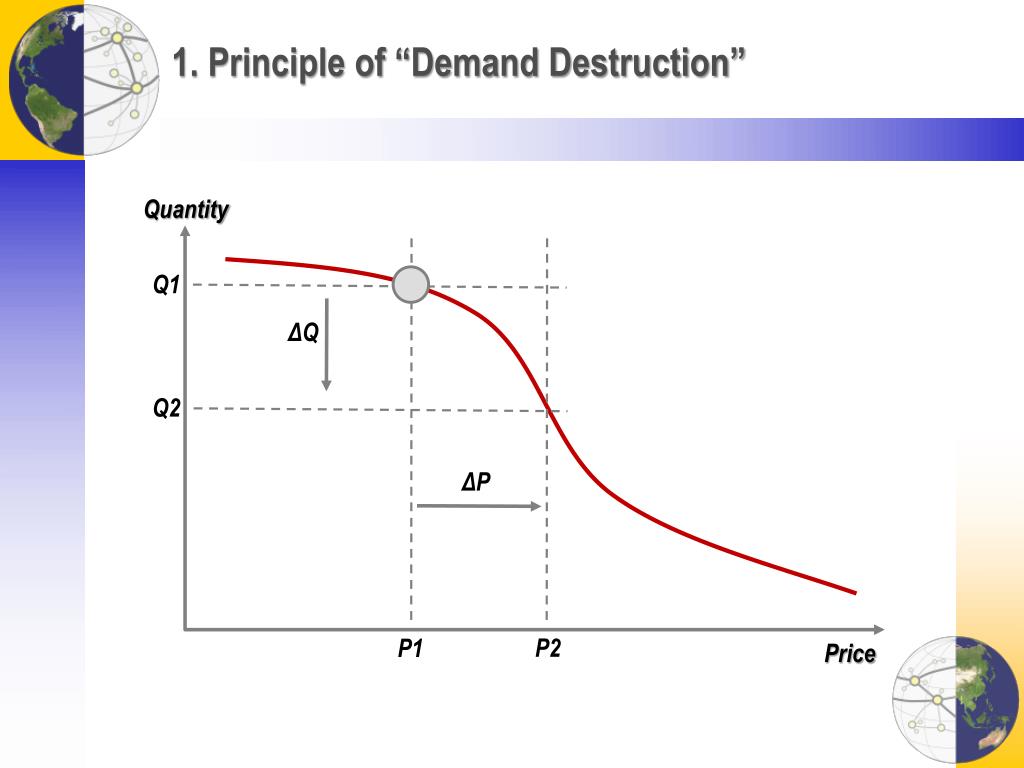
Yeah, Demand destruction. The shape in that chart is the tell that it refers to typical products that are known as having elastic demand. Oil and gas have inelastic demand, which requires a different chart that’s much less “curvy” shall we say.
Govts control the vast majority of worldwide oil/gas supplies. Private companies control a very small amount. And what do govts crave? Income. They will defend energy prices.