Posted on 11/07/2020 11:01:54 AM PST by nickcarraway
Benford’s law, often known as Newcomb-Benford law, is an observation about the frequency distribution of leading digits of unconstrained numeric data in the real world.
The intuition behind the law dates to the 1880s when an American Scientist, Simon Newcomb started to discover a pattern among the log tables. He noticed that people usually have a lot of markings on numbers starting with small digits like 1 and 2. He didn’t research much about his observation, so after 50 years, Benford continued his research on this phenomenon and found out many interesting things by applying it to populations, length of rivers etc. Let’s see how to apply Benford’s law and what are the possible applications of it.
Figure 1: Probability to follow Benford’s Law
The above given formula will give you the appropriate likeliness about the occurrence of digits to comply with Benford’s Law. The probabilities are as follows:
d P(d) 1 30.1% 2 17.6% 3 12.5% 4 9.7% 5 7.9% 6 6.7% 7 5.8% 8 5.1% 9 4.6% If the selected set of first digits do not follow the above probability distribution, then either the dataset is too small, or someone has tried to manipulate it. Even 1% of manipulation in the real data will flag some fraudulent activities as it will violate the probability distribution given above. This law can be applied to anything and everything that is a result of an unconstrained process. Not all set of numbers can be used with Benford’s Law. For example, telephone numbers.
The law can be the first step of filtration of any unconstrained dataset to make sure that the data has not tampered. Below are some of the applications of the Benford’s Law.
Financial Data:
The financial world relies a lot on the Benford’s law, to identify frauds. It could be applied to loan data, stock prices, tax returns etc. Most of the datasets will follow the probability distribution and if not, either someone has manipulated the data or maybe the dataset is too small.
Election Data:
You could take the number of votes for a party from different cities and try to compare it to the probability distribution. This could be a good check to understand if the party has tried to buy votes or pressurised people to vote for them.
Image Forensics:
In times, where tutorials to create a Deep Fake are openly available on the internet, it becomes difficult to rely on evidence when it comes to proving the crime. Benford’s law acts as an amateur filtration step to authenticate the image. For e.g., try taking an image with your phone and apply the Benford’s law to the pixel intensities, you’ll notice the same probability distribution as the law. But if you add a filter to the image and save it, it will violate the law as it’s no longer an original image. The same process can be done to spot fake videos. This filter makes it difficult for amateur defaulters to fool the law.
Twitter Bot Identification:
A researcher in the US, wanted to understand the use of the Benford’s Law so she started looking at the number of friends you have on your Twitter account and also the number of friends your friends have on their account. For e.g., scrapping out the number of friends you have on your account and the number of friends that your friends have on their account. Having done this she found out that most of the people were following the Benford’s law but there were also accounts that didn’t follow the distribution. After having a closer look at those accounts, she understood that those were bots. Carrying on her research she exposed an entire network of bots on Twitter. These bots could be used to manipulate elections and send fraud messages to people.
Conclusion:
The law is so simple yet very powerful and beholds the ability to spot frauds within seconds. There are a lot of applications of it and researchers are actively looking for the possible applications, but the question is, “Why everything follows the Benford’s law?”. I’ll leave this to you, to explore.
The problem with this is that it’s an observation, not a provable law. One could argue that if the data set were large enough and truly random there would be more instances of deviation from the “law”.
I got a D in Statistics in college. Sorry.
You simply don’t know what in hell you’re talking about, you’re blowing smoke.
Benford’s Law is valid.
It has to do with the fact that when you’re counting things,
you go through the 1 in the lead digit first, then 2 in the lead digit, then 3,...
like, if you’re counting to 100, you first count ALL the teens before you even start on any number in the twenties.
And you have to finish all the twenties (”twenty-one, twenty-two, twenty-three, ...”) before you can start counting anything in the thirties.
And so on.
Well, a lot of the time you finish whatever you’re counting before you ever get to 80 or 90, say.
So, on *average*, you’re going to have a LOT more buckets, where “1” came up as the first number, than anyone else.
“But,” you ask, “what if you get to over 100? Doesn’t that change things?”
Yep. It makes the ones show up even MORE.
Count with me.
ONE hundred.
ONE hundred and one.
ONE hundred and two.
ONE hundred and three.
ONE hundred and four...
Yep. Add another 100 “1”s to your pile before you reach 200.
And so on.
What if it’s 1000?
Yep, same thing.
And THAT’s why in random counts, the first digit is most often a 1.
is not the purpose of scorecard (the vote manipulating software) to take this into account so it can not be exposed by bedford’s law?
Can you tell us in english what these graphs mean?
I've been studying this for the past few hours and reached some understanding (also have a BS in math and decades of experience with software development, and am rather math oriented).
Its about artificially vs naturally generated numbers.
For example if a computer program was written to generate a thousand random numbers between 1 and 999 evenly distributed, then we would indeed expect the first digit to be 1 only a ninth of the time, just like we would expect 9 to be 1 a ninth of the time.
(an aside the computer program really can't generate true random numbers, it simply simulates doing so by using some arbitrary data and running a function on it, that would be predictable if one knew the starting data and function)
However with naturally occurring counts of things in nature the law is quite demonstrable and holds well, because such things have a different kind of distribution that matches it.
As to voting precinct totals, they are partly like this natural distribution, and partly constrained by such things as tendencies in sizes of the precinct. Such numbers do tend to match Benford's law, but not as precisely as accounting sums usually do. For example if precincts all had about 2000 potential voters and a candidate was attracting about 40% of voters evenly across all such precincts, they would end up with a lot of the first digit being 8. Still there is enough variance in precinct size, party preference, and enthusiasm to make such assumptions unrealistic, and the numbers will tend to be far more naturally distributed without such an obvious pattern. Its just that the curve is not as precise as it is for some other things.
Seeing histograms from other elections as I researched this it became clear that the debate is about precision. Even papers that argued against using Benford's laws to detect election fraud were not talking about histograms as insane as we are seeing in this article for Biden in the districts that are under suspicion.
Sorry for confusion but meant this article: https://gnews.org/534248/ in my last post.
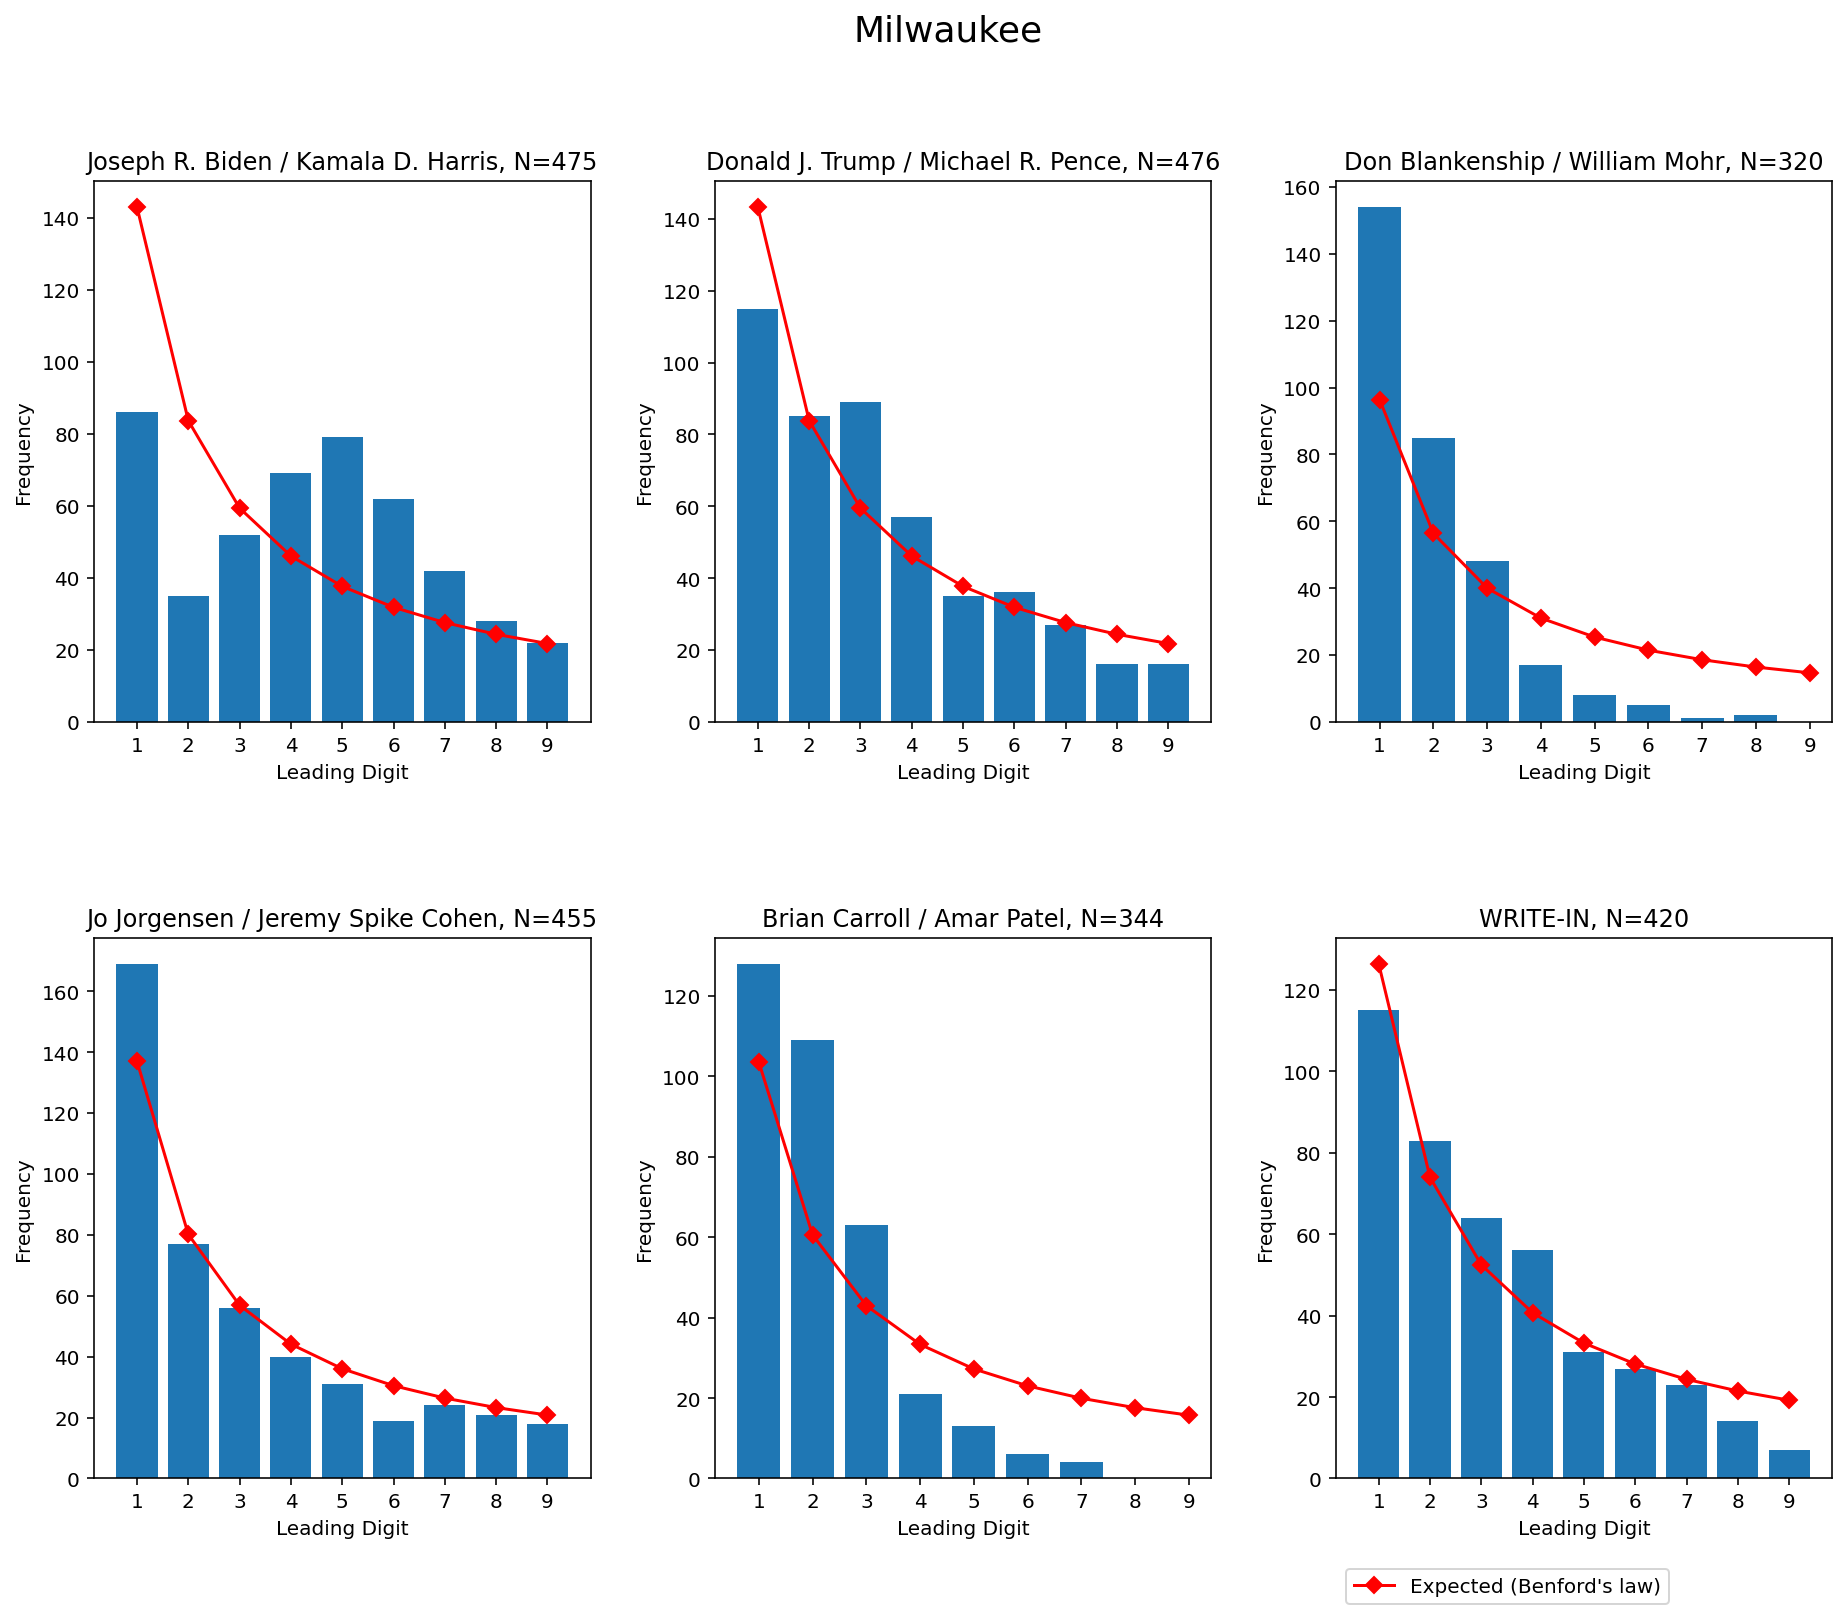
Yep. Each graph is a bar chart, the digits 1...2...3...4...5...6...7...8...9. That's the x-axis, along the bottom.
The bar chart, shows how many TIMES, that digit, was the first number in a count of votes.
Those are the blue rectangles. To find the count, trace from the top of the blue rectangle over to the Y-axis, the vertical line.
So in the lower left, that's the inddpendent candidate, Jo Jorgensen.
So the digit 1 shows up 163 times (that's how high the blue rectangle is).
The digit 2 shows up 78 times.
And so on.
The red line on the graph is the prediction of Benford's Law.
The shape is right -- you have a LOT for 1, and it curves smoothly down.
Now look at Biden's graph -- it's all screwy, it's got a big hill in the middle. People trying to fake counts, often choose 4, 5, and 6 a lot, because "they're near the middle" and so, instead of being clever and covering up the fake like they think, they stick out like a sore thumb.
Trump's got a bit of deviation too; but that might be from votes being thrown OUT by crooked counters or machine *ahem* "glitches".
Thanks for that. I am wondering ..is there a formal proof to Benford’s Law, on why certain (not all) naturally occurring numbers follow that distribution ? I read that height, weight, IQ etc don’t follow that distribution. Or if not a formal proof, is there some explanation ?
Thanks, should tell the Rudy where to look for the fraud.
I read that height, weight, IQ etc don’t follow that distribution.
“No one has an IQ of 11”
Sure they do.
that is an excellent explanation.
References to https://gnews.org/534248/ are BLOCKED by Facebook, if you try to post the link.
Likewise, if you Tweet https://gnews.org/534248/, you will get a “Your account has been locked.” for 12 hours. I’ve two more hours to go to access Twitter!
Dem voters do. But the standard deviation on that is +\/- 0.000000000003, so it doesn't affect the range.
But this is dealing with a mathematical ideal distribution of this sort. It might differ from a real world distribution, just as the volume of a two foot diameter sphere might differ from a sphere shaped container made to be about two feet in diameter. If you pour water in the sphere and pour it out you will likely get close, but not precisely the amount of water reflecting the volume.
Likewise, how much data collected in the natural world actually matches the kind of distribution Benford's Law is based on is not a matter of mathematical proof, and has to be shown scientifically by experimenting with real data. And for a lot of kinds of numbers this confirms they seem to follow this kind of distribution (or if they don't, the way they vary for it tends to follow the distribution of digits fairly closely).
As for election data in particular, there is a good summary on the Wikipedia page, which I will copy here before somebody changes it:
Election data Walter Mebane, a political scientist and statistician at the University of Michigan, was the first to apply the second-digit Benford's law-test (2BL-test) in election forensics.[34] Such analyses are considered a simple, though not foolproof, method of identifying irregularities in election results and helping to detect electoral fraud.[35] A 2011 study by the political scientists Joseph Deckert, Mikhail Myagkov, and Peter C. Ordeshook argued that Benford's law is problematic and misleading as a statistical indicator of election fraud.[36] Their method was criticized by Mebane in a response, though he agreed that there are many caveats to the application of Benford's law to election data.[37]
Benford's law has been used as evidence of fraud in the 2009 Iranian elections.[38] An analysis by Mebane found that the second digits in vote counts for President Mahmoud Ahmadinejad, the winner of the election, tended to differ significantly from the expectations of Benford's law, and that the ballot boxes with very few invalid ballots had a greater influence on the results, suggesting widespread ballot stuffing.[39] Another study used bootstrap simulations to find that the candidate Mehdi Karroubi received almost twice as many vote counts beginning with the digit 7 as would be expected according to Benford's law,[40] while an analysis from the University of Columbia concluded that the probability that a fair election would produce both too few non-adjacent digits and the suspicious deviations in last-digit frequencies as found in the 2009 Iranian presidential election is less than 0.5 per cent.[41]
Amid allegations of electoral fraud in the 2016 Russian elections, an article co-written by Kirill Kalinin and Mebane in The Washington Post observed that the mean of the second digit of the number of voters in each of the country's 96,869 electoral precincts, to four significant figures, was equal to the expected mean (4.187) per Benford's law. In addition, the mean of the last digit of the votes in each precinct for the triumphant party, United Russia, was equal to the expected mean (4.5) per Benford's law. On the basis of other
But note I have read the study by Joseph Decker etc who were critical of applying the law to elections, but they were, well frankly, full of it. They did raise some issues that are real, but totally overstated the problems with it and did ridiculous analysis designed not to work.
Sure they do.
Yup - send a bright kid to Communist College or a Journalism school and their brains are replaced with dogmatic lies. But that's considered a feature, not a problem.
So thank you, Trumpy Bear! Biden says "Follow the science" so may he be hoisted on this petard along with the investigations.
Disclaimer: Opinions posted on Free Republic are those of the individual posters and do not necessarily represent the opinion of Free Republic or its management. All materials posted herein are protected by copyright law and the exemption for fair use of copyrighted works.