
Posted on 10/17/2020 8:06:35 PM PDT by DoughtyOne
PING LIST - Please contact me as needed...
COVID-19 Update # 213
As of 10/16/2020 23:15 PDST United States CDC - Provisional Numbers
As of 00/00/2020 23:45 PDST Johns Hopkins University - Capture Nations Informaton
As of 00/00/2020 23:45 PDST Johns Hopkins University - Capture Counties Information
As of 00/00/2020 23:46 PDST Johns Hopkins University - Process JHU Data
As of 00/00/2020 23:59 PDST WorldofMeters - Document Core Numbers
As of 00/00/2020 23:59 PDST WorldofMeters - Capture Nations Information
As of 00/00/2020 23:59 PDST WorldofMeters - Capture States Information
As of 00/00/2020 00:00 PDST WorldofMeters - Data Processing begins...
As of 00/00/2020 ??:?? PDST Publish COVID-19 Update - 00/00/00
Thank you for stopping by to check out the COVID-19 Update.
Here you can find...
Section: 01 Commentary, Special Reports, COVID-19 Update Info, & System Notes
Section: 02 the United States Situation
Section: 03 the Global Community Situation Outside China
Section: 04 the Global Community Situation Including China with reservations
Section: 05 the Mortality Report
Section: 06 Miscellaneous Reports of Interest
Section: 07 the United States, Counties (alphabetical / case no descending)
Section: 08 the United States, States Ranking, Provisional Numbers, & Territories
Section: 09 the United States, Ranked with Other Nations
Section: 10 the End of this COVID-19 Update
Section: 11 Data Sources and a Link to My Own Spreadsheet
Section: 12 Linked Spreadsheet: Counties, States, Provisional, Territories, & Nations
Section: 13 Links to Other Resources
Section: 01
Commentary, Special Reports, and COVID-19 Update Information3
Interesting Tid-bits (hopefully)
Fatalities and New Cases in the United States
Fatalities rose by 53 cases from the previous day, to come in at 927
yesterday. That was a 1.87% increase from the same day the week before.
New Cases rose by by 5,691 from the day before, to come in at 71,963
yesterday. That was an 18.53% increase from the same day the week before.
This 71,963 was the highest number of New Cases we have declared on one day
in over two and a half months. On 07/24, we declared 78,501 cases. We have
had some 71,000+ days in between, but not high enough to beat yesterday's
number.
Fatalaties and New Cases on the Global Scene
Fatalities rose by 151 cases from the previous day, to come in at 6,210
yesterday. That was a 5.54% increase from the same day last week.
New Cases dropped off by 14,448 cases from the day before, to come in at 414,587
yesterday. This was a 14.99% increase from the same day the week before.
Mortality Rate Milestone in the United States
Mortality rates is something I do not address regularly. I have kept them
since the onset of the disease, for the United States, Globally Outside China
and Globally as a whole.
The reason I don't touch on them, is that they have been wildly high. At
each phase of the COVID-19 situation, the Mortality figures have lagged
behind the declaration of New Cases, and the reports of recoveries. As
things wind down, the rates I show have dropped significantly.
I wanted to touch on them today, because we just went sub 4.00%. I know
that is still very high, but I use this metric as a marker rather than a
real indicator of the overall Mortality rate.
Let's see what I mean by an indicator. On 01/27/2020, the Global Mortality
rate was 62.94%. This was calculated by taking the Falalities plus the
Recoveries, and dividing that sum by the number of Fatalities. These were
the outcomes. The Mortality figure was the percentage of outcomes that
were resolved by a Fatality.
Today the Global Mortality figure has dropped from 62.94% on 01/27/90, to
3.60% today, using this formula. The Global scene was several months ahead
of us. Then came the Global Scene without China. It's highest Mortality Rate
figure was 33.15% on 03/20/2020. Today it is also 3.60%.
Our high figure was 77.55% on 03/11/2020. Yesterday it dropped below 4.00%
for the first time to come in at 3.98%.
I do not provide these to tell you what the actual mortality rates are. I
provide them to let you know how much better a position we are in now, than
in those early days when New Cases were coming in faster than Recoveries
could keep up.
Section: 02
The Following Addresses the Numbers Here in
the United States of America
Here we go...
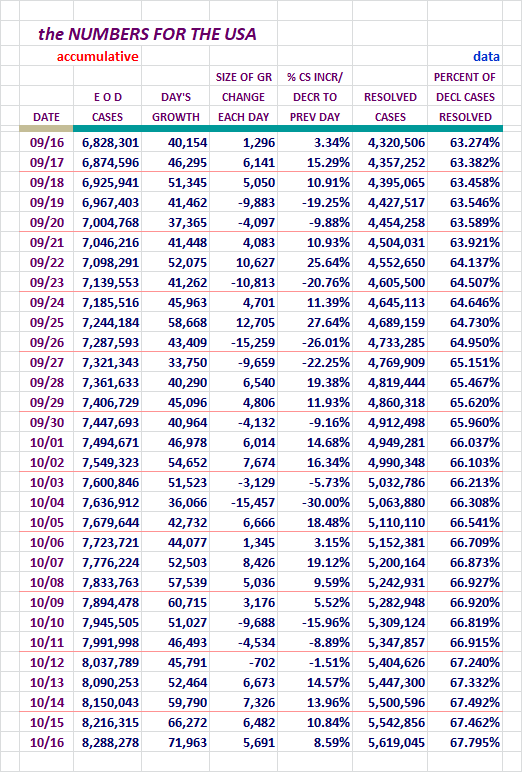
New Case Declarations rose by 5,691 cases yesterday.
This was our highest daily New Case declaration since 07/24/20. At the
present time our rising numbers appear to be the start of a third wave.
I am using our Active Cases as the key.
While Testing is robust in the United States, it isn't at the highest
level we have seen.
Please take note of the Resolved Percentage level on the right.
It bobbed back up a bit yesterday.
It's significant enough now to take note of it daily.
Concept of adding in Active Cases and Serious Critical here, courtesy of amorphous
Here are more of our numbers...
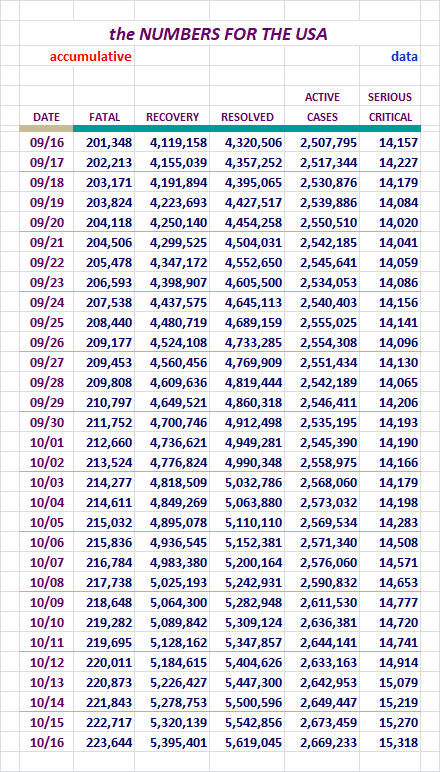
Active Cases dropped off by a little over 4,200 cases. We have seen up
and down days recently.
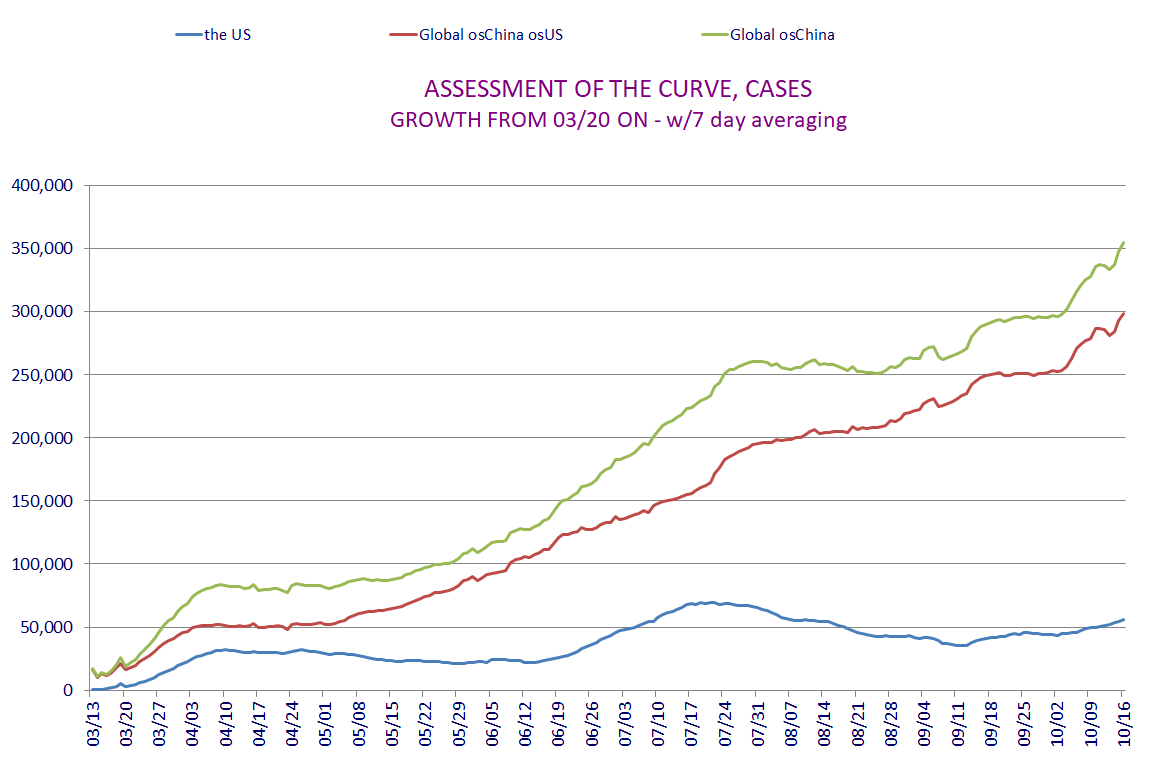
Our Slice of the COVID-19 Pie
The growth of our slice of the pie has been decreasing recently.
Here are the numbers I've been tracking, Globally Declared and Active Cases.
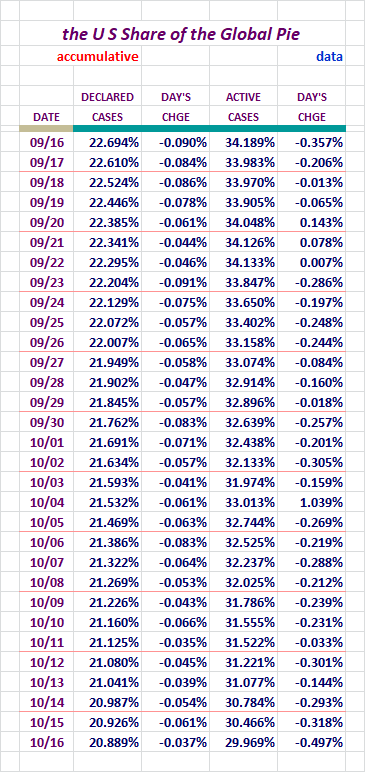
This area is looking better day by day.
Active Cases in the United States / Chart
Unlike some of the other charts here, we should see a good rise and
fall at some point withone.
Note that this presents the single, seven, and fourteen day averaging versions.
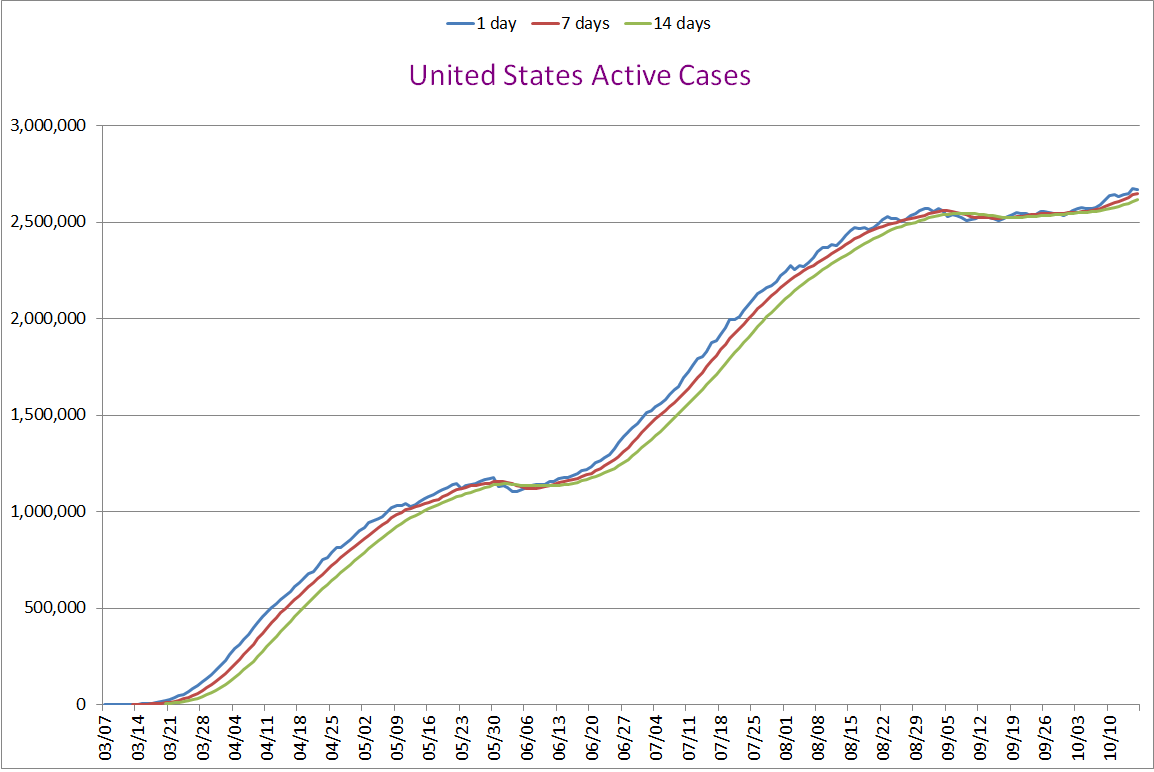
Remember, these are not new Declared Cases. These are remaing Active Cases.
The Active Case area is a very indicative of what is going on in any
location on this timeline. We can see how things have flattened twice here.
I don't particularly care for what happened last time, and I'm hoping it
won't happen again.
I think you can see the reason for my saying it looks like we may be seeing
evidence of the early days of a third wave. Hopefully things will cool off
and we'll drop instead. I can only address what it looks like at this moment.
The question is, where do we go from here? Are we positioning for a third
wave or are we going to start moving down in earnest? We'll soon find out.
In the last few days before yesterday, Active Cases had risen a little. I'm
concerned about a third wave right how. Globally the cases are hot, and our
numbers are up a little also. Right now our average daily cases are higher
than they have been in seven seeks. I'm not sure how far beyond that it goes back.
Fauci has let it be know, he still thinks were on the first wave. He may be
right. I'm not sure what the scientific requirements are to declare a wave
over. If it settles down, that seems like an end to me, and the chart looks
for all the world like a second wave to me. Now I'm seeing troubling signs.
Testing and New Case Figures
Requested by stocksthatgoup
Some folks have shown an interest in seeing the COVID-19 Test figures compared
to the New Cases being declared. The following Data addresses that. The size
of it just doesn't seem reasoned to me.
Why/how could the posive portion of the popoulace vary ass much as 2.0% from day
to day? I could a lot easier see a 2.0% trend over three or four days. One day?
Nah.
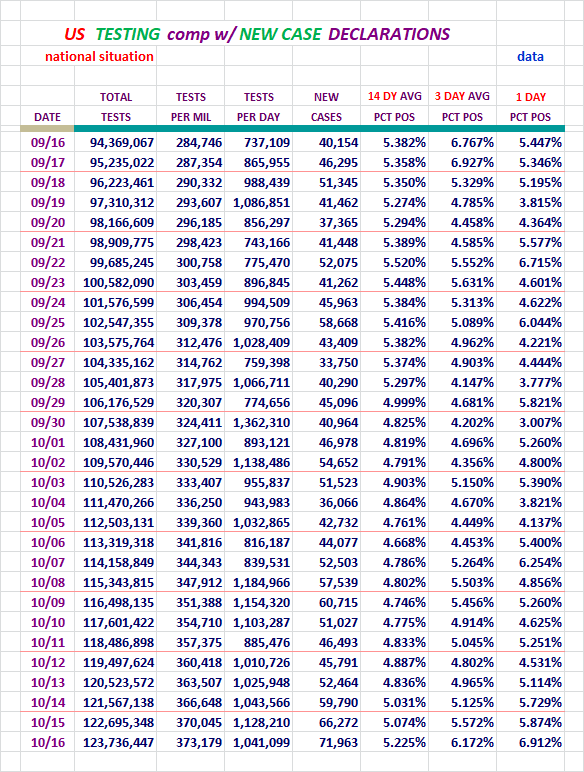
Testing fell off a bit yesterday. It's not at it's highest levels, so the
number of new cases should be seen as a result of higher than normal testing.
Our Positive Percentage of Testing has been rising. You can see where we
have been, and I don't like where it looks like we're headed. For some
reason we are seeing elevated numbers of people testing positive in the
population base right now.
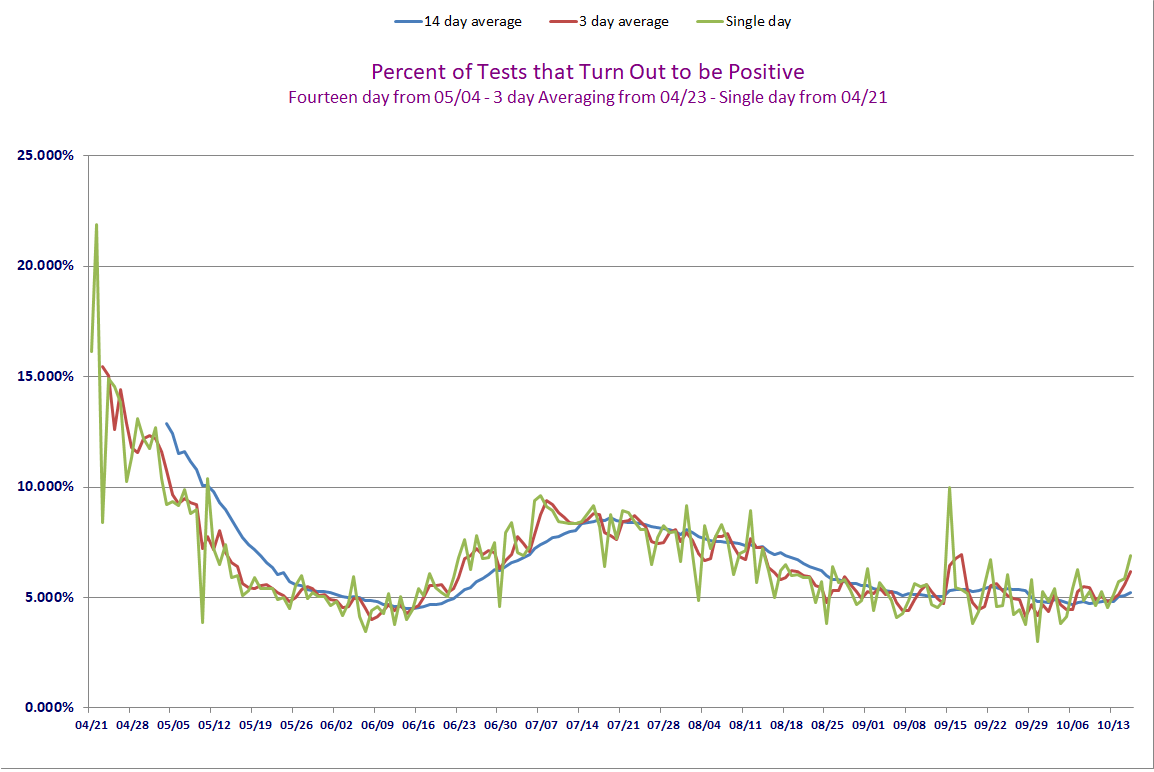
The chart has moved almost imperceptively upward at this time.
The U. S. Stats / w 10 Day Averaging / Fr: 03/17
Requested by: Texas Eagle
This data and chart presents things in a little different way. In the
chart it is easy to see the relationship of these numbers. I may be wrong
not to do so, but I don't plan to put much weight in those figures for a
few days until they normalize.
The Chart will use the data all the way back to 03/17, but the data displayed
here will only go back one month.
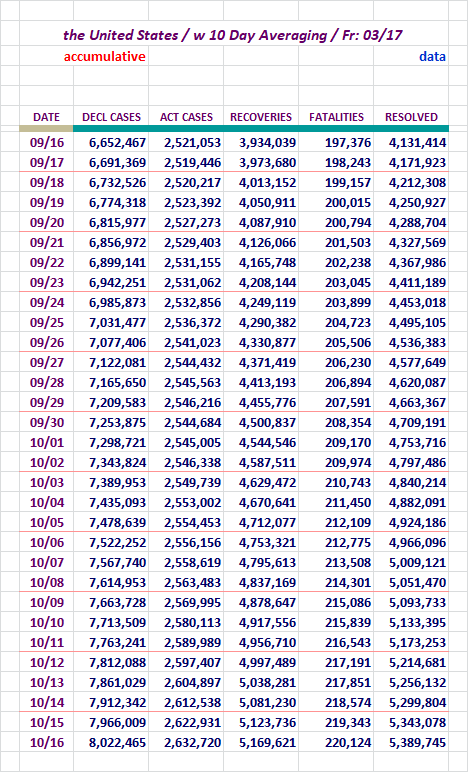
Here is the chart to watch.
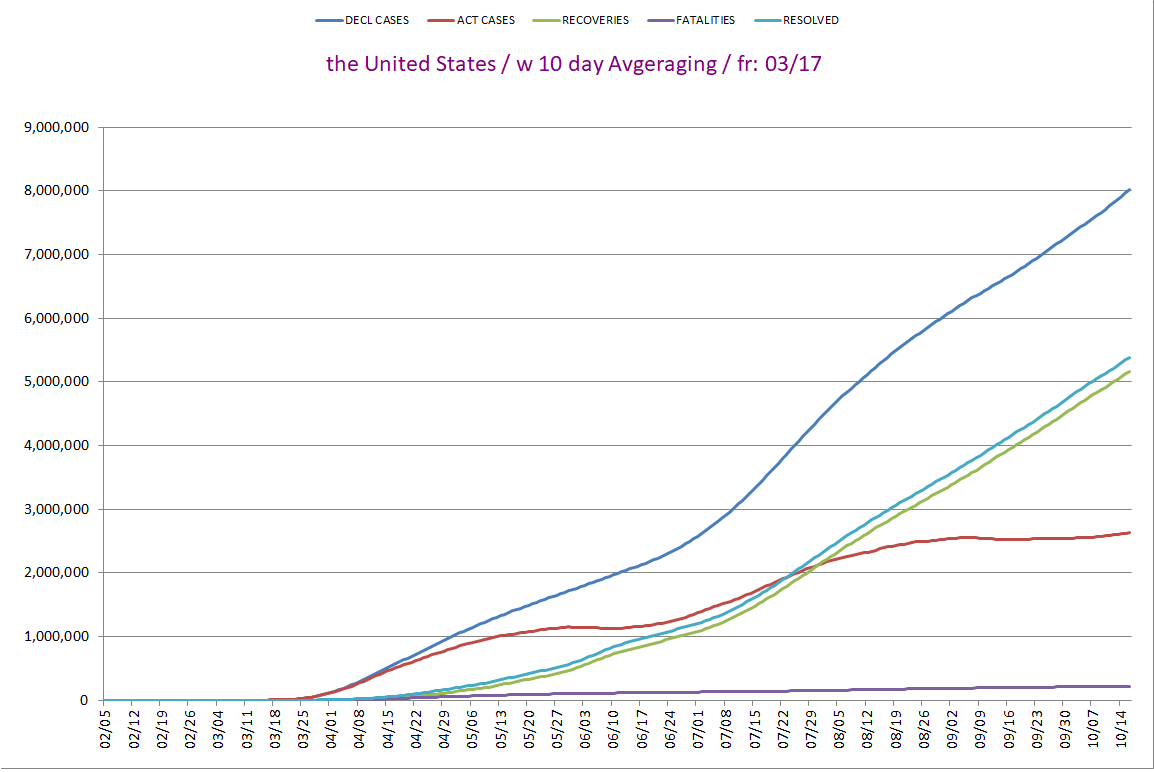
The New Case Declarations line is moving on up.
The Active Case line had flattened out, but now we're seeing an increase.
If this weren't a ten day averaging line, we might see more of an
increase in it's trajectory.
I have been saying I wasn't too happy with the Recoveries and Resolved Cases
lines there. At the present time they don't seem moving toward flattening any
longer. They may show some strengthling almost imperceptibly.
Compare to the rise of Recovered and Resolved cases on the Global Scene to see
a different more healthy trajectory. These look lethargic by comparison, but a
a little less so.
You can right click view to see the Global Chart enlarged.
United States Movers and Shakers...
I will present the U S States with the most New Cases and New
Fatilities rankings.
Here we go...
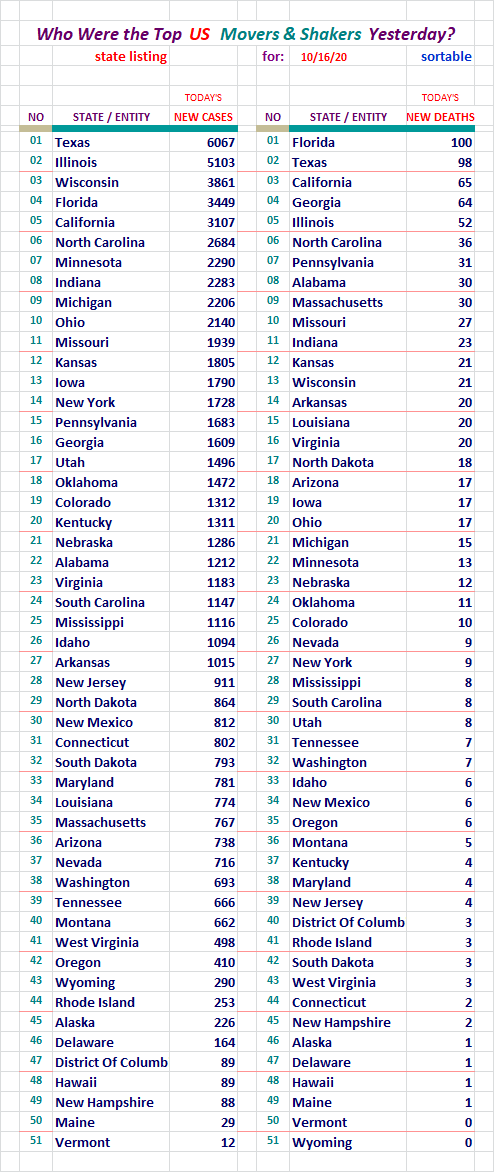
Texas and Florida took the top positions yesterday.
Section: 03
The Following Addresses the Global Numbers
without Mainland thereChina
Here is the first set of Data for the Global Outside China
Territories
New Case Declarations fell off yesterday, so the New Case number for the
day was down 14,437 from the record high the previous day.
The Resolved Percentage fell off a little again.
Fatalities, Recoveries, Resolved, Active Cases, and
Serious/Critical Cases - Globally, Excluding M/L China
Concept of adding in Active Cases and
Serious/Critical here, courtesy of amorphous
Here we go...
Active Cases rose in accordance with the large number of New Cases
declared yesterday. Serious/Critical cases rose up 600 cases.
That is a very big number for this metric. Not good.
How is the Global Community Outside China Doing,
Without U. S. numbers?
Let's see...
The middle/important number here fell off from the previous day yesterday.
Lets face it, this was still a mammoth of a New Cases day.
After the record day before, yesterday fell off. It was still over
400,000 New Cases declared on the Global Scene.
I don't like where the United States' blue column resides now.
The blue line depicting New Cases, is trending up steadily.
The Active Cases outside China Globally / Chart
As in the United States' version of this, we should see a good rise and fall at
some point these two.
Note that these present the one day and then 7 and 14 day averaging versions.
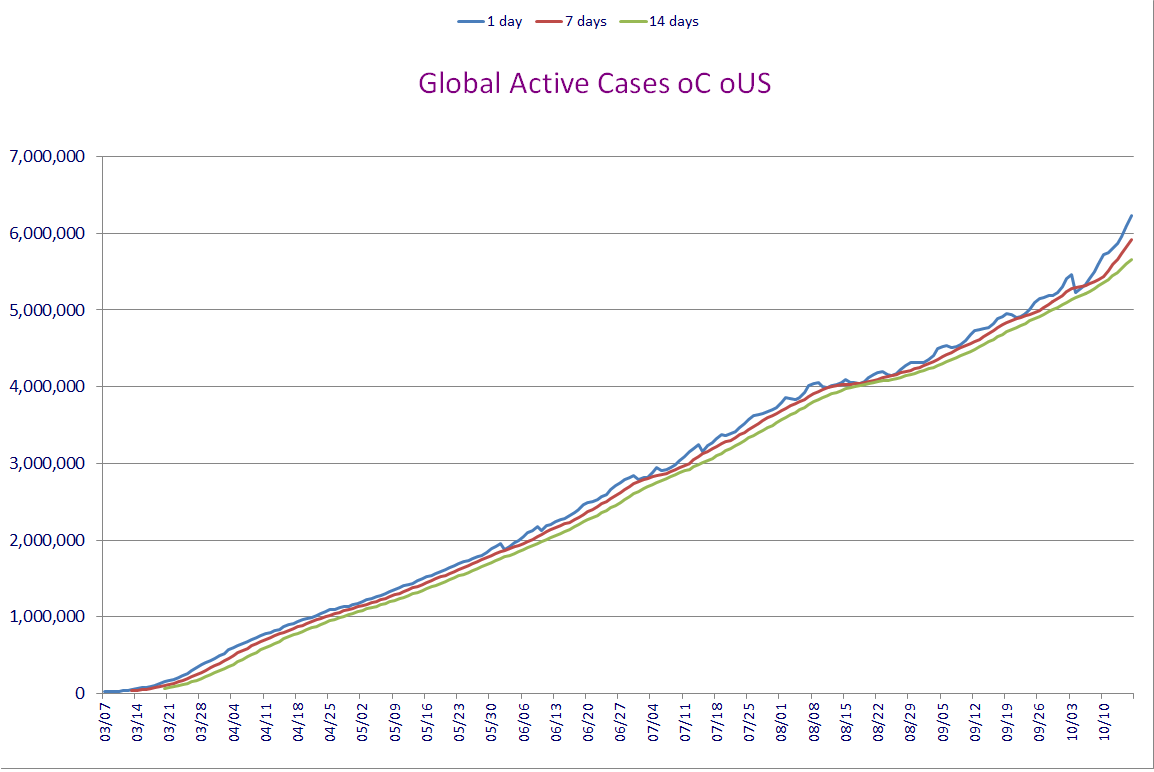
There is pressure for these charts to show an up tick. Both are showing it
more clearly each day.
Special Section on France, Germany, Italy, Spain, and the U. K.
Case growth.
Jim Noble mentioned he'd like to see the US numbers added here. I added them
in on 06/21/2020. I did not add them to the chart because it would have
dwarfed the European nations chart lines. (they would have been reduced to
about 15% of their normal size)
Let's Look at Some Numbers in Five Day Increments:
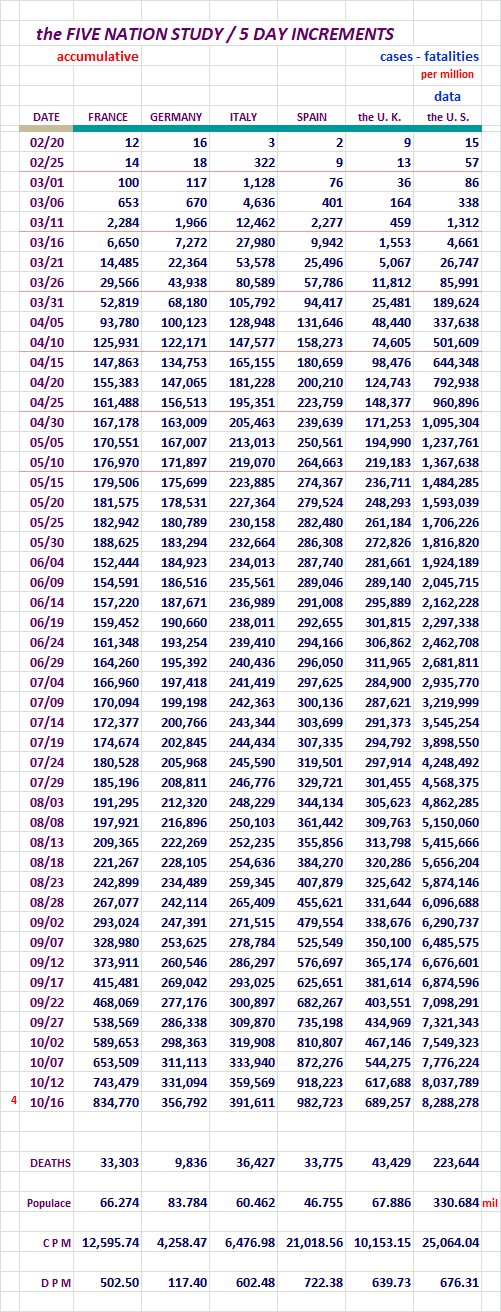
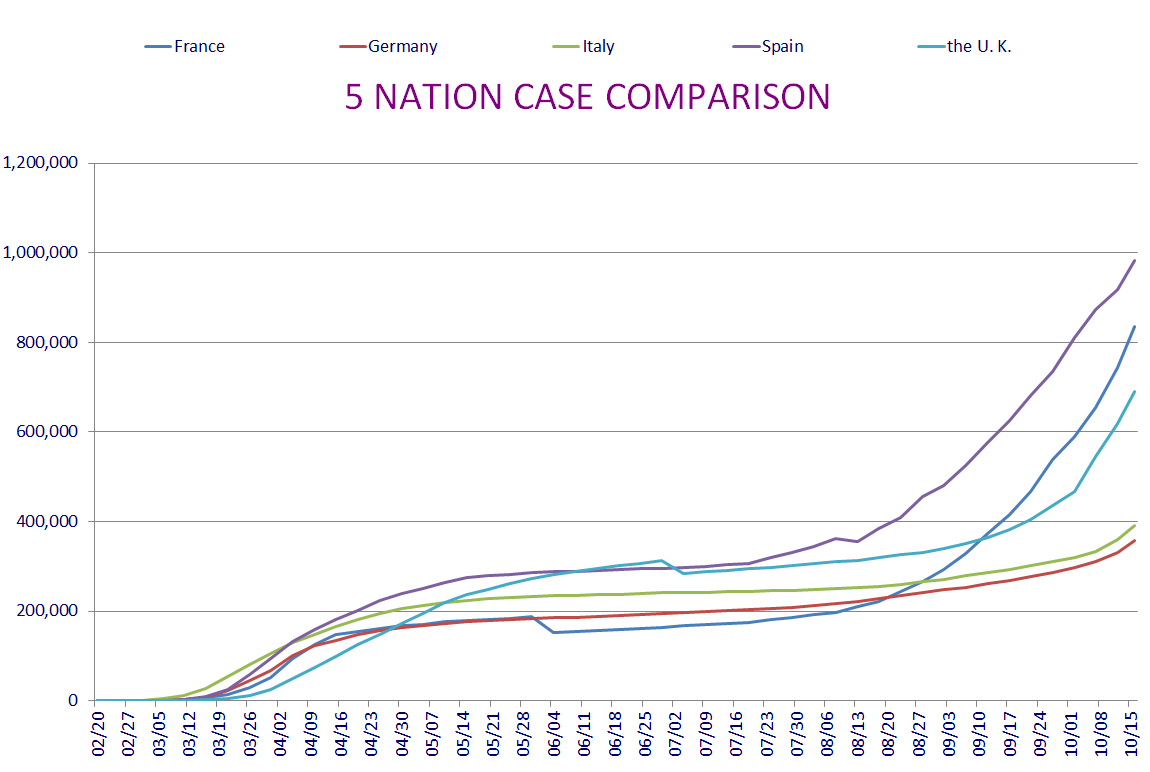
I had been giving Spain some credit for what looked like a better direction.
Today I have to address what has happened in the last day or so, and how
that hope for Spain has turned to remorse that it didn't sustain my hope
for it.
France is still going up at a rapid rate and the United Kingdom is now on
the elevated rise program. Drat!
To be honest, it looks like all these nations are showing an inclination to
move up.
Sweden and It's Neighbors, Who Has the Best Tactic Against COVID-19?
Sweden is doing its own thing with regard to isolating. I think most people
are aware of it by now.
Here are some numbers to help us look at this issue.
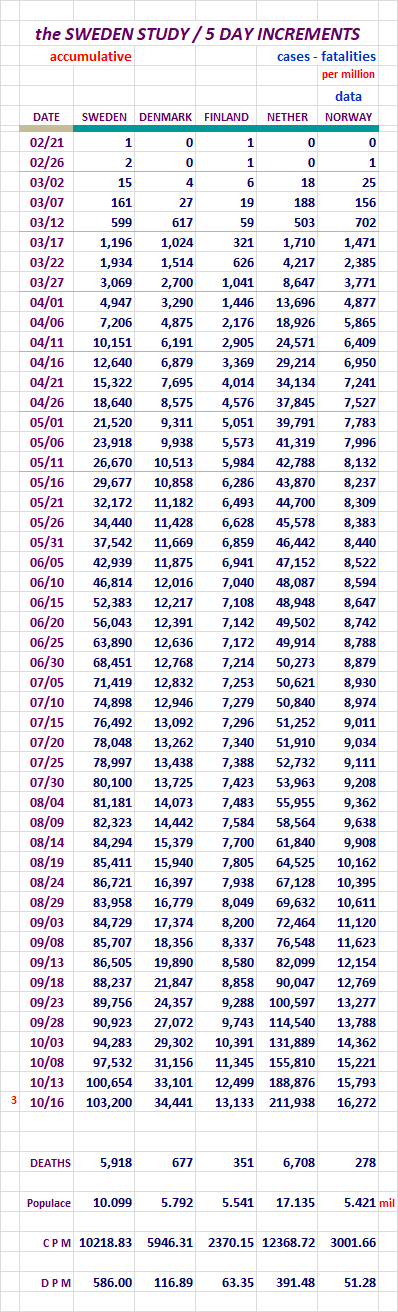
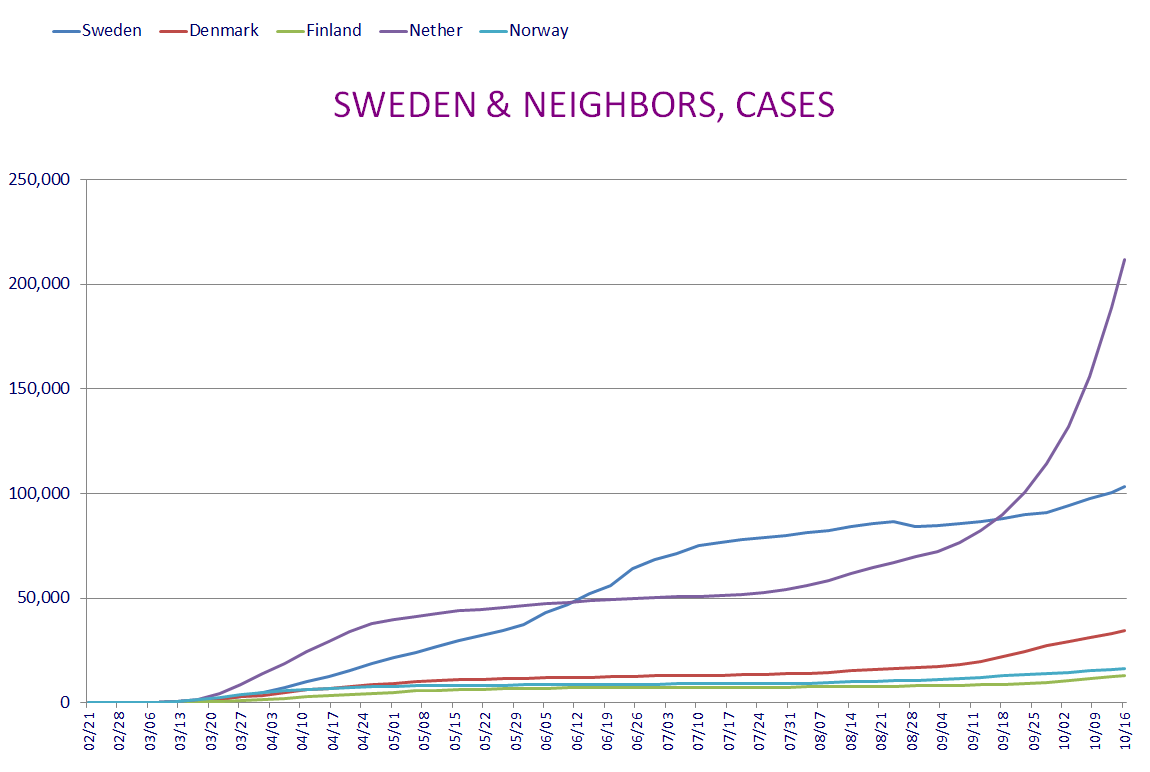
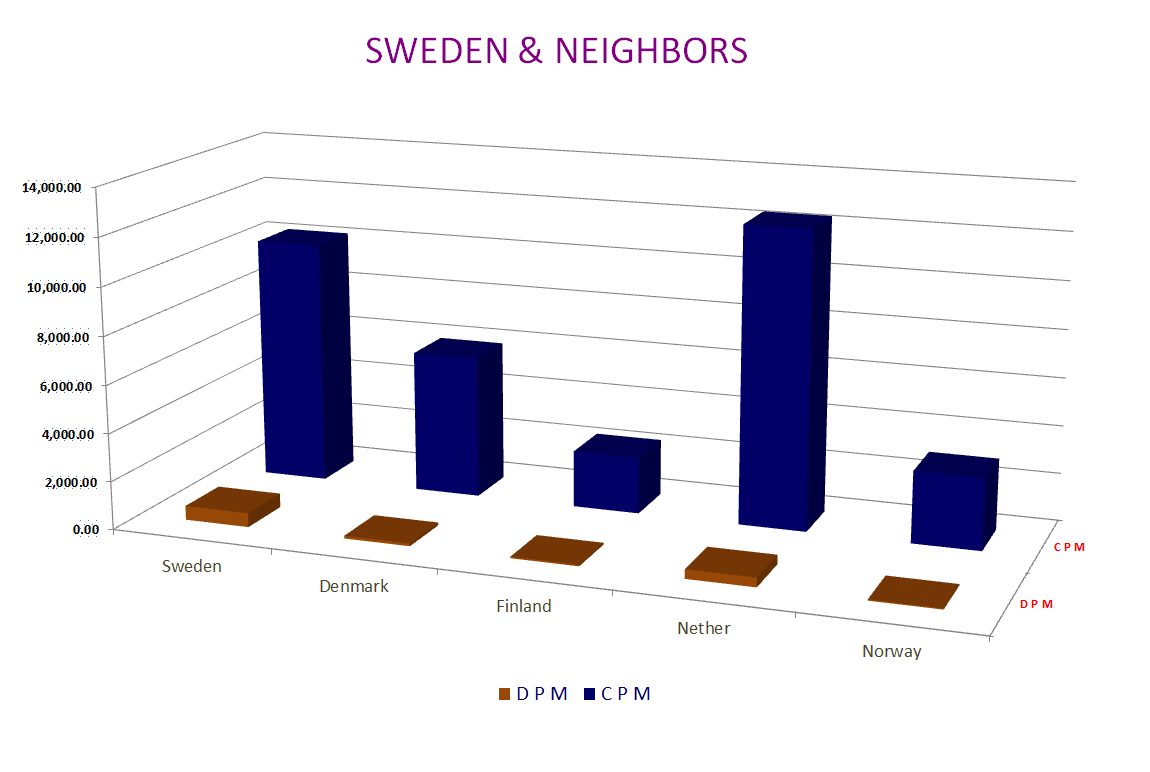
Sweden has flattened out a bit after that correction a while back.
The Netherlands is just going ballistic. From 03/20 to 07/31, it rose
over time. In the 2.5 months since then I has more than tripled that
07/31 figure.
We do need to keep it in perspective though. While the raw numbers do show
the Netherlands to be going orbital, the per million figures are still a lot
less than Sweden's.
What I like to do, is compare a nation to itself though, and it's not looking
good against its own earlier numbers.
We are also seeing a dynamic building, where the Netherlands numbers are going
so high, they are pushing down the other nation's lines on the chart. If
the top nations were around 100,000, 100,000 would be at the top of the
chart. When one nation goes to 200,000, it forces the 100,000 nation down
halfway in the chart. I suppose that's a good thing though isn't it.
Global Movers and Shakers...
I will present the top fifty nations with the most New Cases and New
Fatilities.
Here we go...
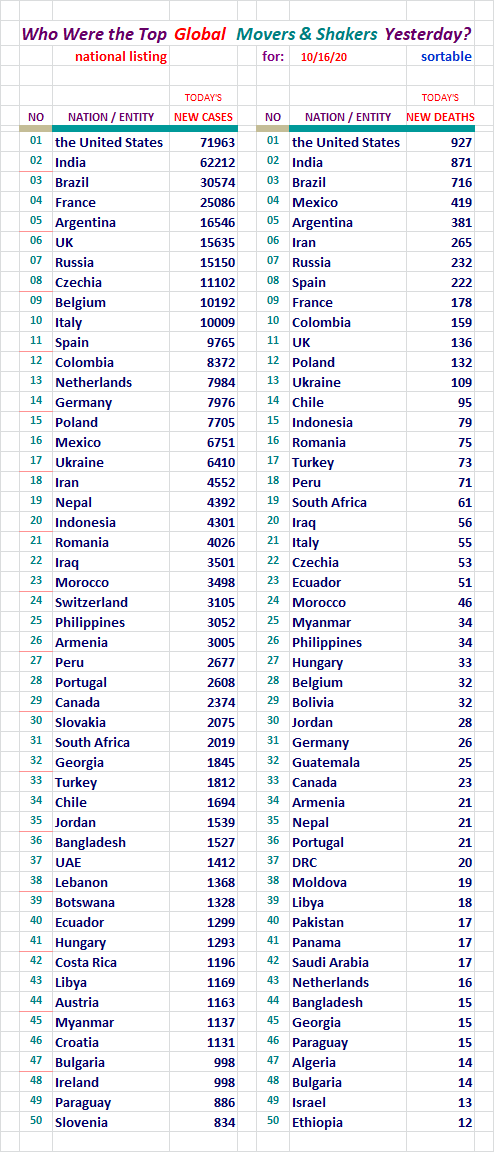
The United States took the two top spots here the day before yesterday.
We haven't done that in some time as I recall. Then we did it again
yesterday.
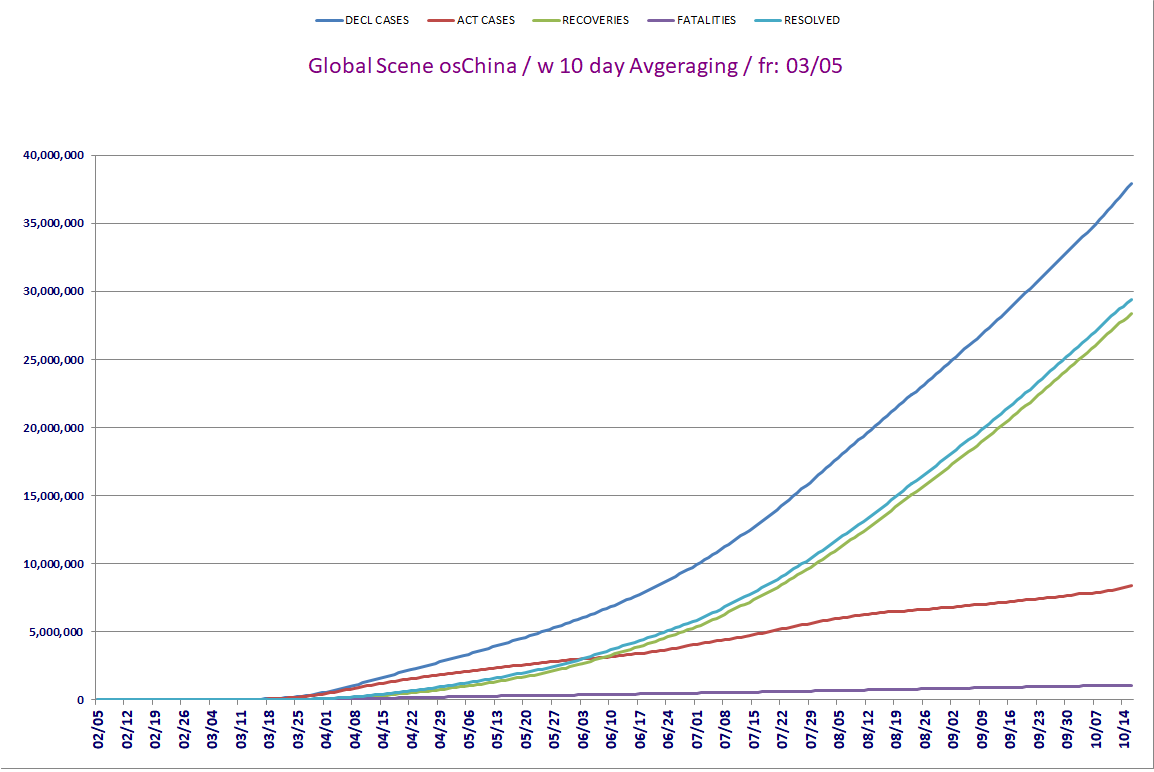
Global osChina Stats / w 10 Day Agveraging / Fr: 03/05
Requested by: Texas Eagle
This data and chart presents things in a little different way. In the
chart it is easy to see the relationship of these numbers.
The Chart will use the data all the way back to 03/05, but the data
displayed here will only go back one month.
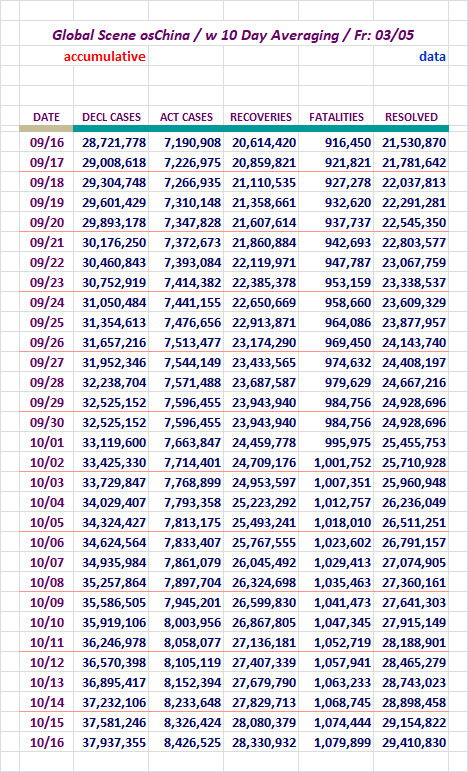
Here is the chart to match.
The Active Case chart line seem to be flattening more the other day, but
as I generally adivse, the next few days did tell, and the flattening
didn't materialize. Some days a single day can depict a false indication
and I believe that's what happened here.
In the United States chart like this one, the Recoveries, and Resolved
Case lines have not shown near the strength as is revealed here with these
upward bound lines.
That chart is provided here, in a small version, but you can see it full size
if you right click view.
Section: 04
The Following Addresses the Global Numbers
including Mainland China*
Mainland China's numbers are 0.003% of today's total global numbers.
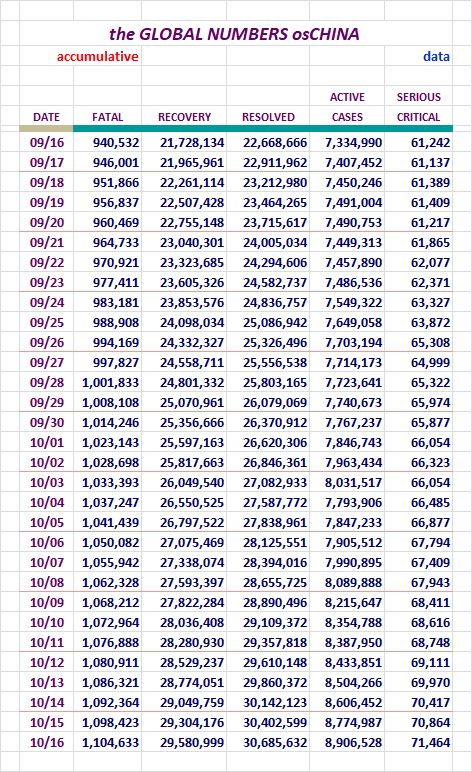
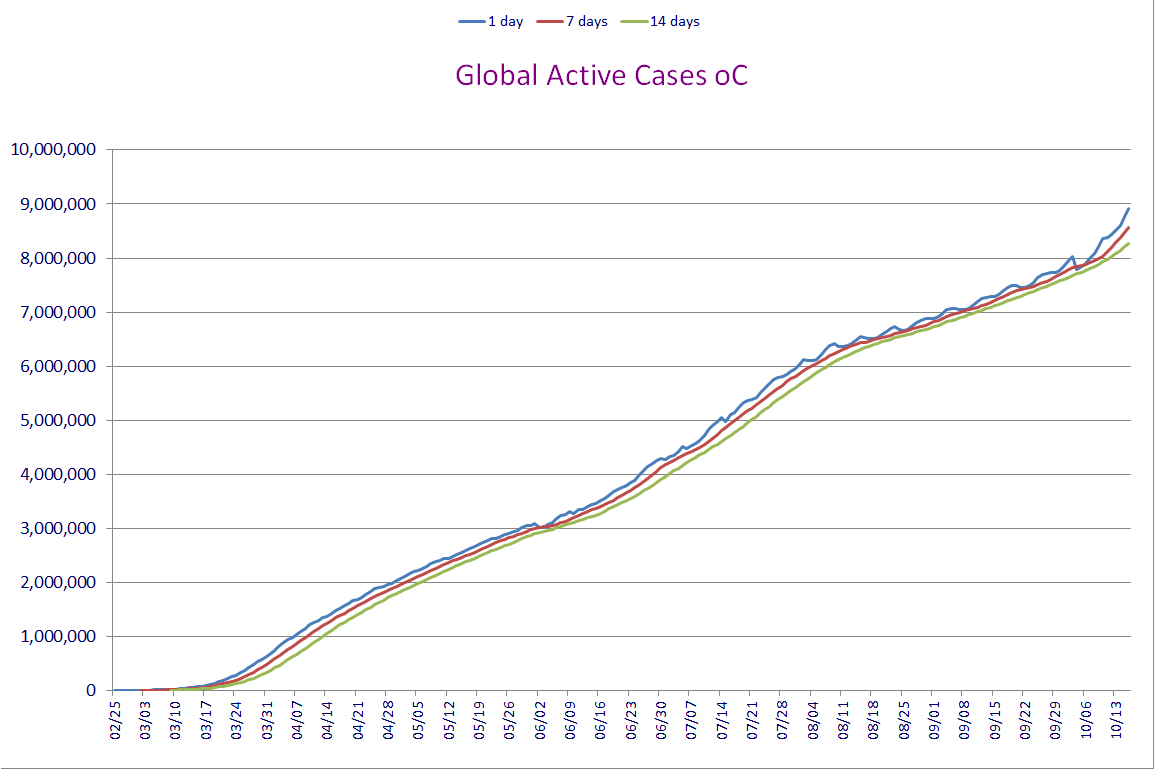
A Look at Declared, Resolved, and Active Cases, Includes M/L China
End of day figures follow:
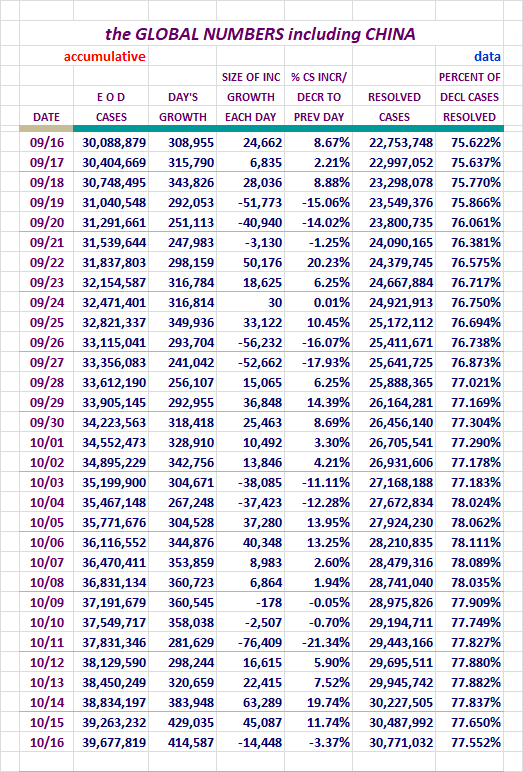
We wound up at 77.552% for Resolved Cases yesterday Globally. We slipped
down a bit. As the new wave of cases grow, this number won't fare well.
Fatalities, Recoveries, Resolved, Active, and Serious/Critical
Cases Globally, Including M/L China
Concept of adding in Active Cases and
Serious/Critical here, courtesy of amorphous
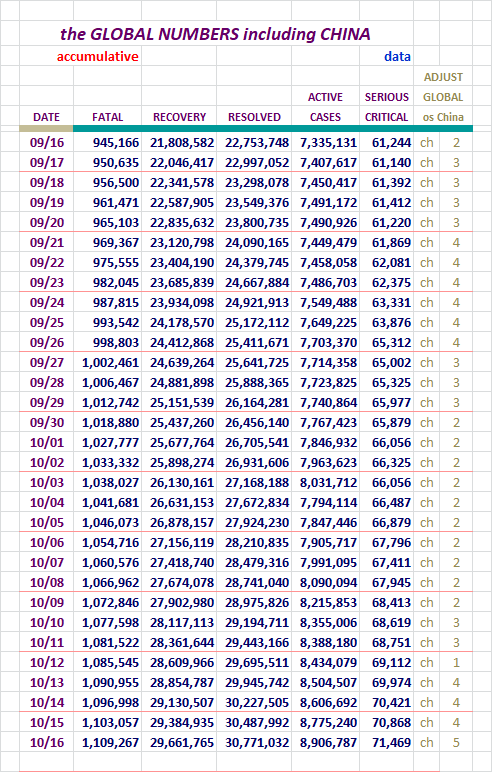
Active Cases rose up normally for this period of the week, and in line
with the massive number of New Cases.
Serious/Critical cases rose about 447 cases. That's a large amount.
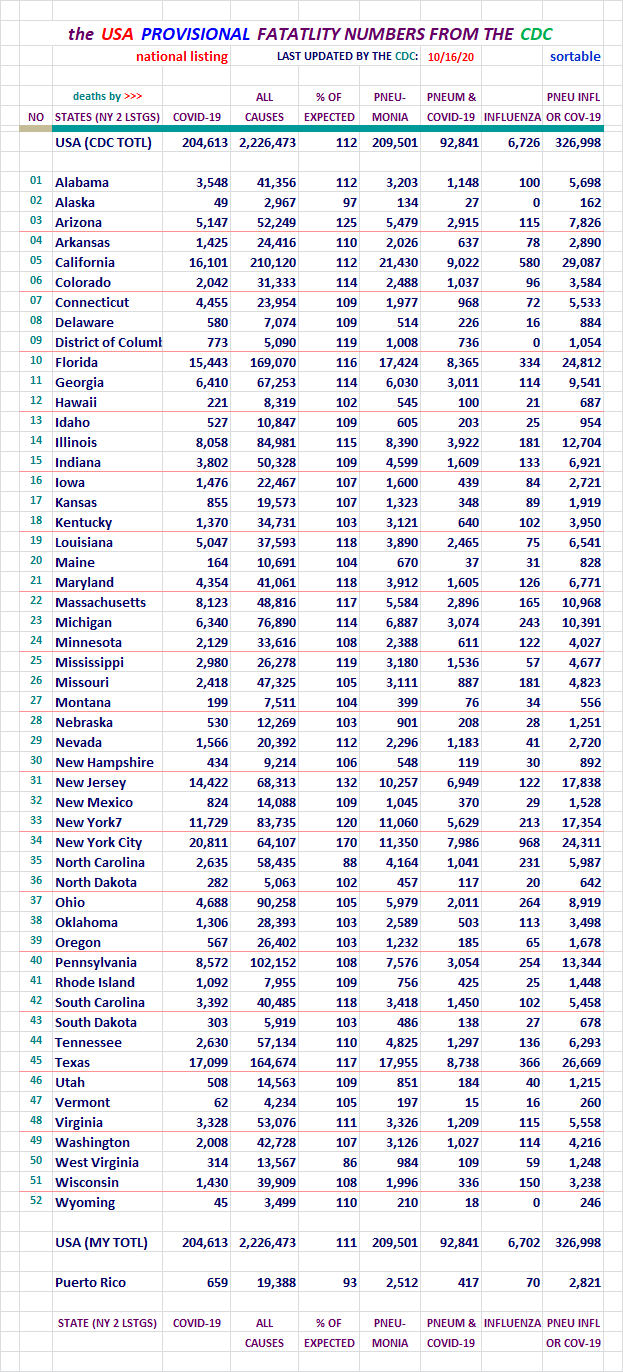
Section: 05
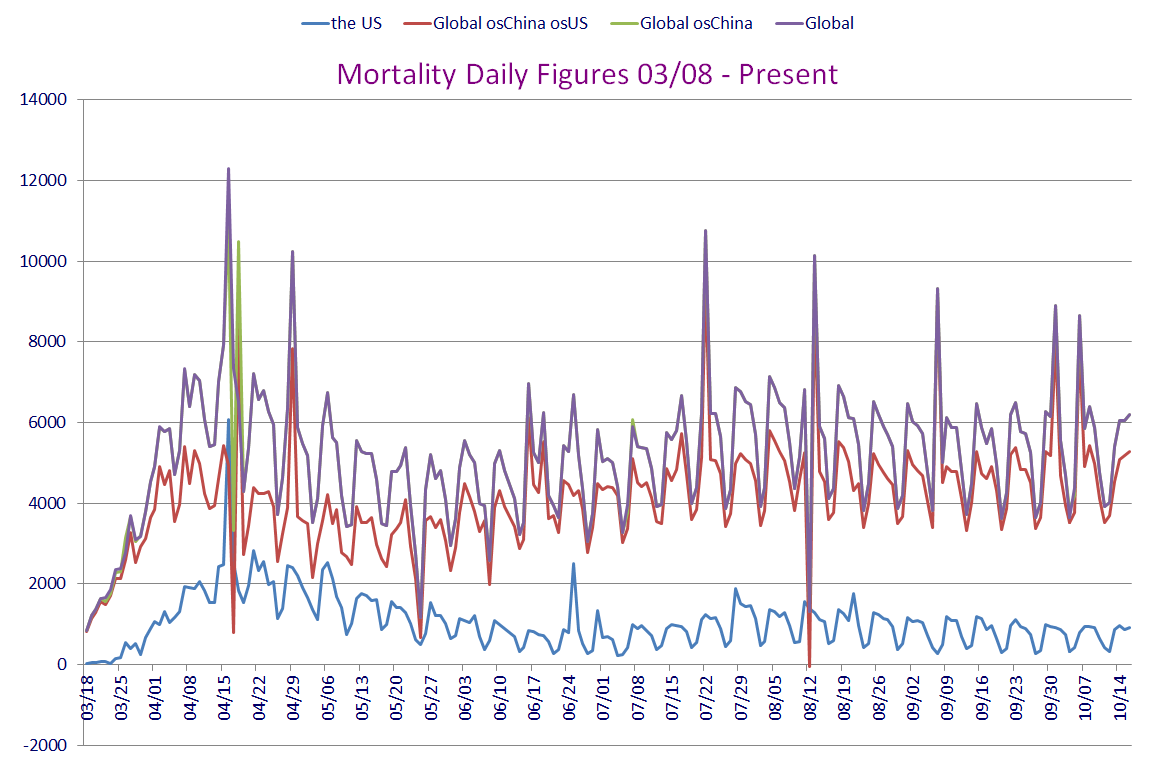
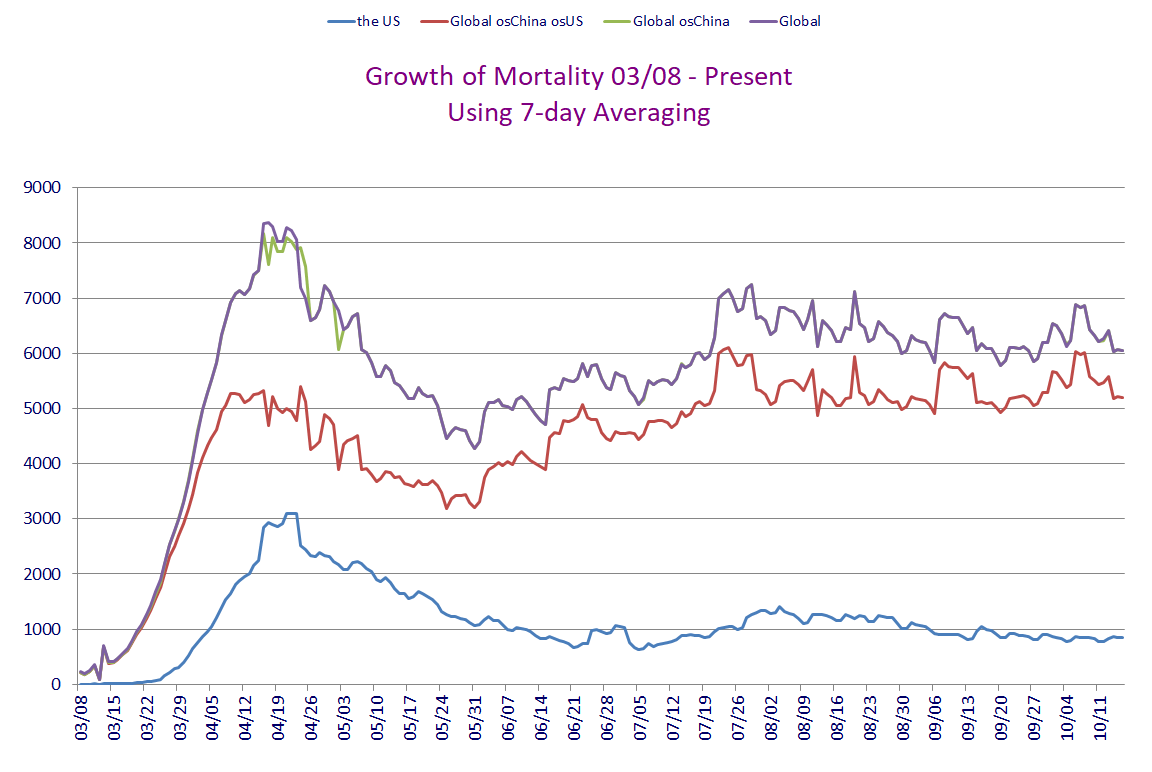
the Mortality Report
Here is the data for four entities...
Here are the figures for the growing case totals for four entities.
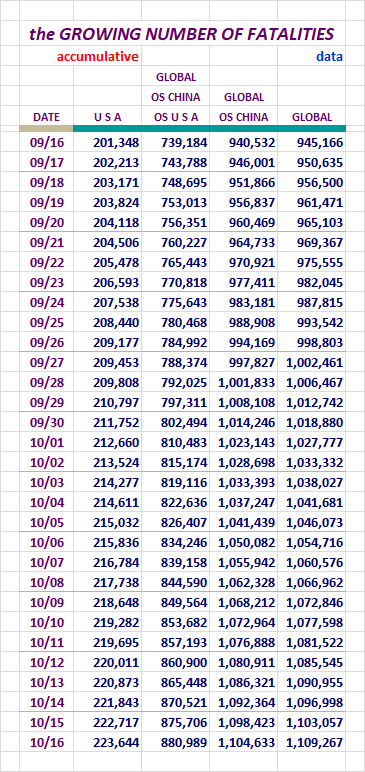
We hear all sorts of stories about how these figures are wildly off. The CDC
has studied them and seems to think they may actually be on the low side of
things. I am providing the CDC Provential Numbers down below. Not sure if
anyone has a rock solid number. I doubt it is possible. This is what is
reported out by WoM and JHU. Check out the CDC numbers too.
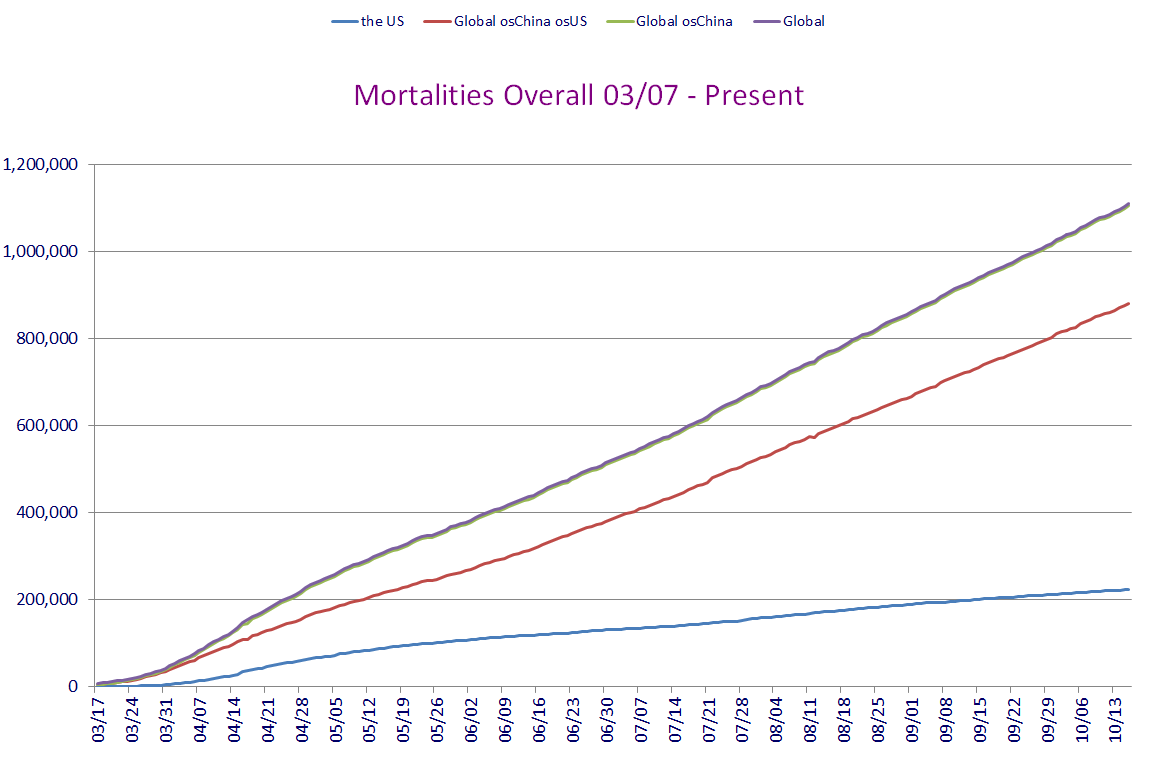
Charts like this one only show growth. That's why I recently took the advice
of a FReeper and added in a new chart for the U. S. and Global outside China
regions.
Here are figures revealing the daily growth for those four entities.
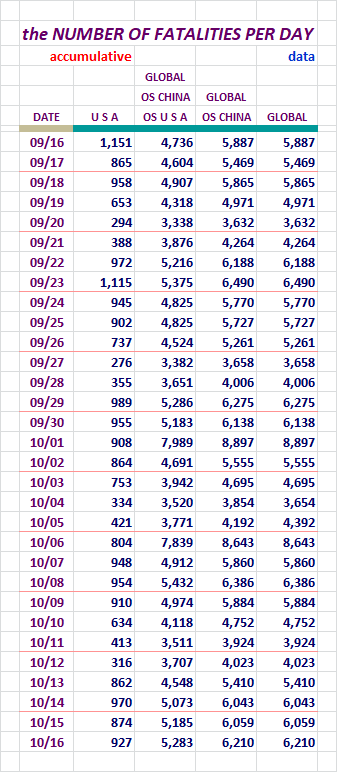
Fatalities rose across the board yesterday.
Since the beginning of COVID-19's activity in the U. S., higher New Cases were
soon followed by elevated Fatalities. If we have gone to school on the data
of this disease, we know who should avoid exposure the most. So if the
demographic that has little to fear from the disease is out there getting
infected, it may not be a bad thing at all. If the Fatalities remain low,
vastly higher cases may simply increase the rapidity of the saturation of the
people in public who have already fought it off. And that may facilitate the
end of the disease. I'm sure others know this, but I did want to explain why
my thinking has fluctuated over time regarding these dynamics.
Here, let's look at data for the United States broken out by itself.
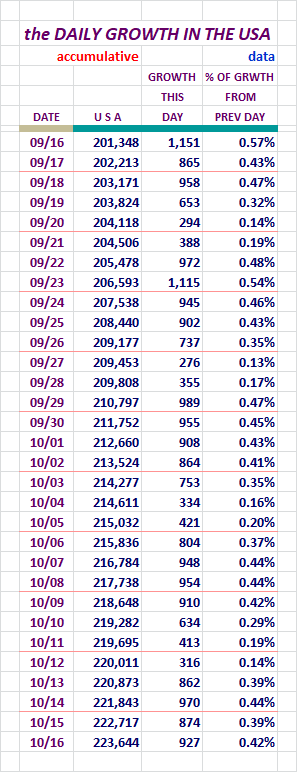
This 927 figure was high, but we don't seem to be seeing a mad rush to
numbers higher than 1,000. Lets hope that continues to be the case.
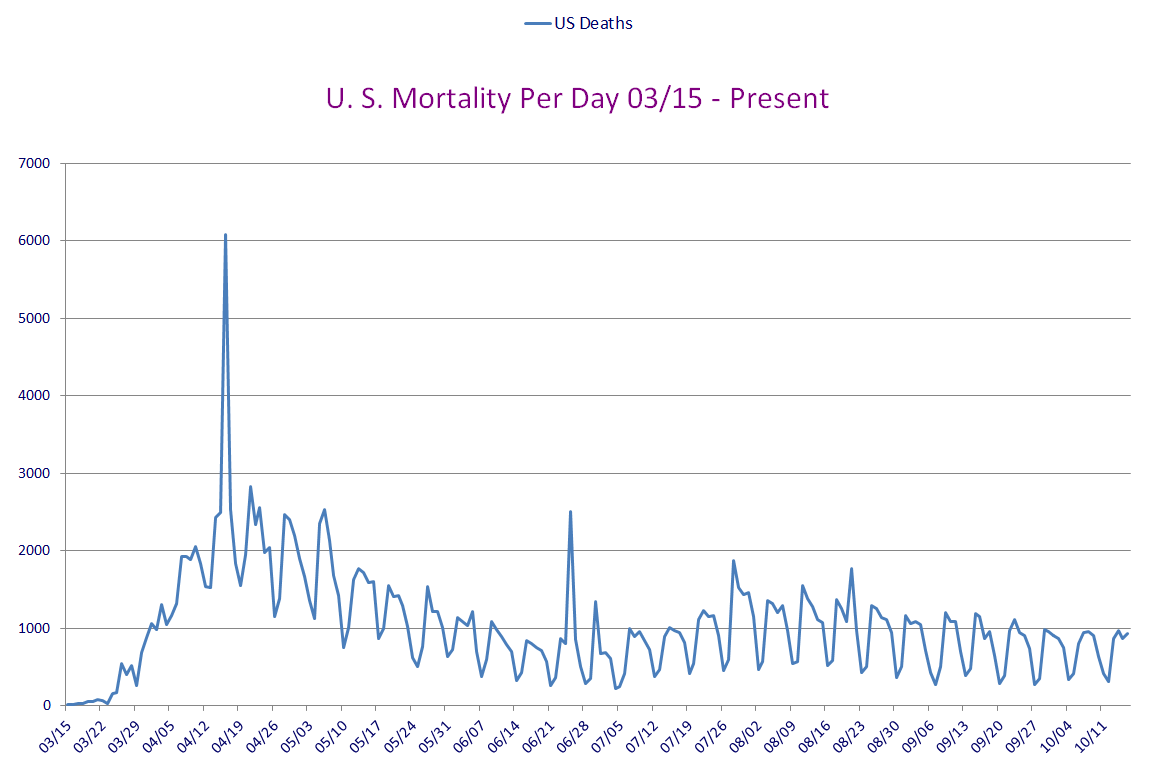
Seems like we've settled into a Ground-Hog day situation here, living the same
COVID-19 day over and over and over...
Section: 06
Population Saturation
Here are figures revealing how many people in each population base represent one
case. I'm also showing what percent of each population base is infected at this
time.
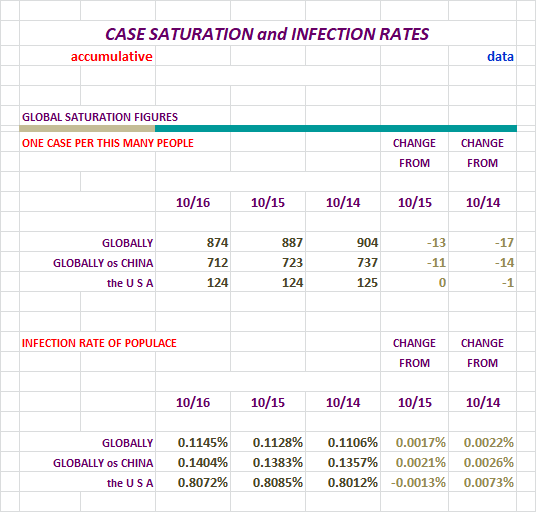
This area hasn't looked too good lately. We looked marginally better
yesterday, but we're still up over the 0.8000% mark. Not good...
Nations With Lots of Cases
At the end of the day yesterday, there were:
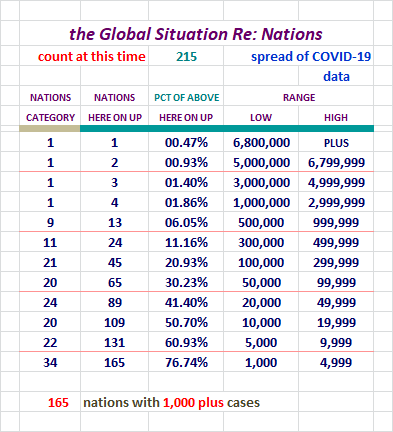
I expanded the levels here yesterday. We had nations who were seeing serious
growth, and their levels weren't showing up very well at the top.
Over 50% of the 215 nations we're tracking now, have declared over 5,000 cases,
but they have far lees of them still Active. Over 25% of the nations we're
tracking have delared over 50,000 cases along the way. None of them have
anything near their declared amount remaining active. Keep that in mind.
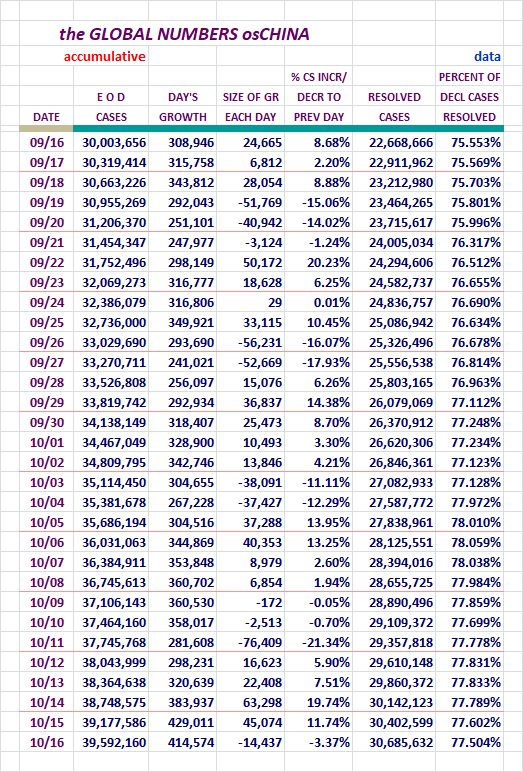
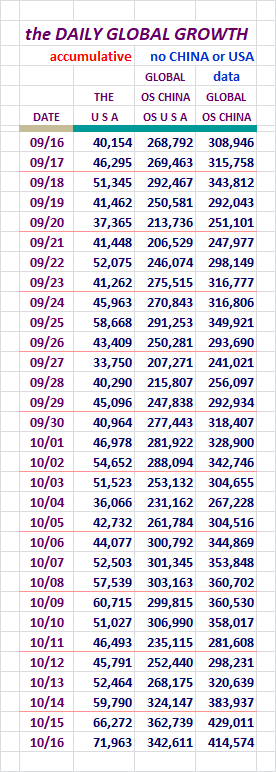
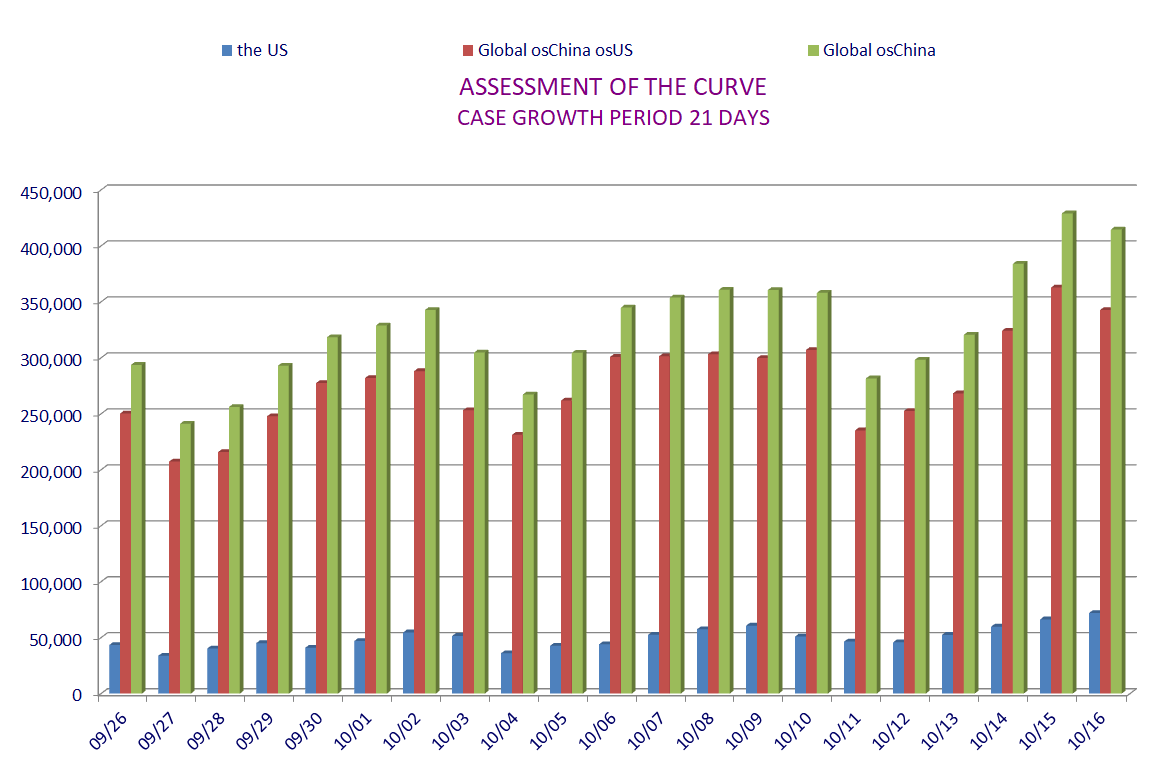
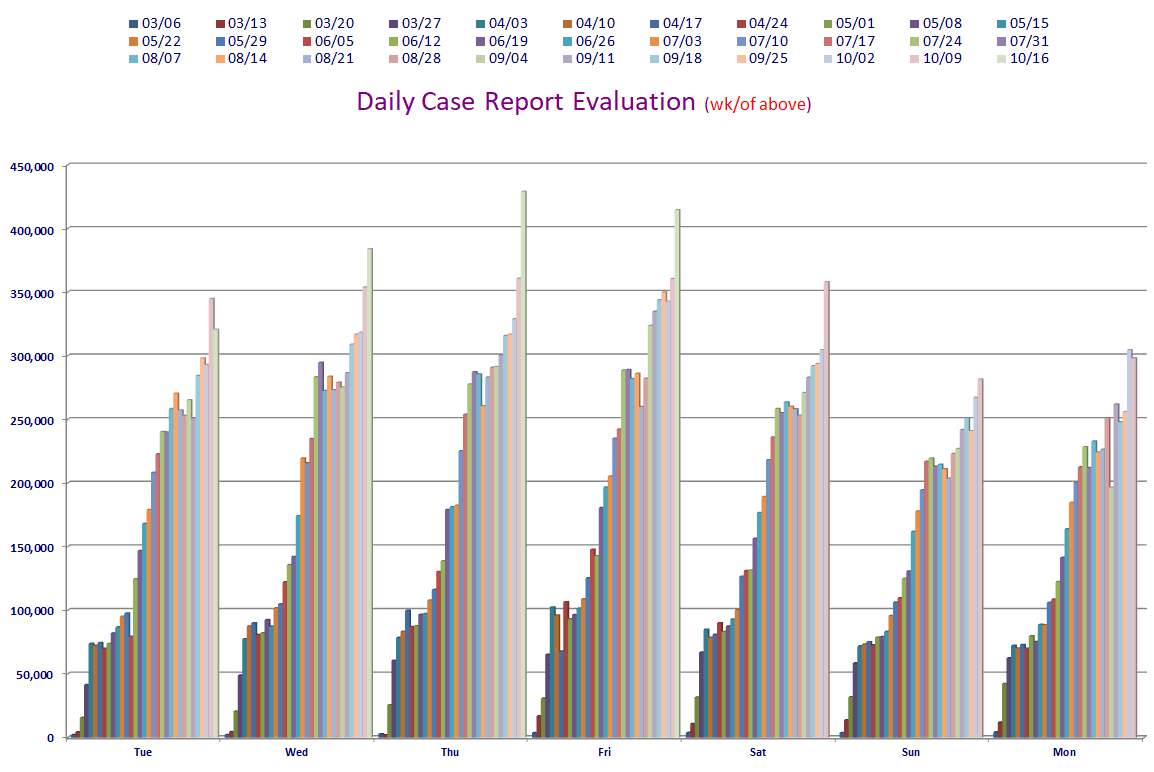
Daily Case Report Evaluation
I'll be keeping tabs on the daily tallies for days of the week for a while. Folks have
noticed some patterns of larger and smaller data entry on certain days, and on Fridays
sometimes the numbers get noticeably larger because of it.
And we now know Thursdays have potential to break out also. Yikes!
IMO Let's check out the numbers and a chart.
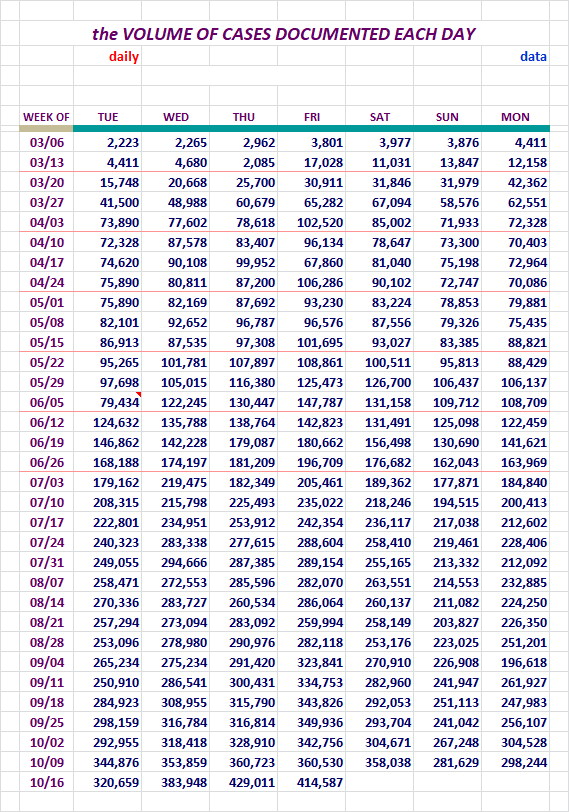
That 429,011 single day New Case declarations figure for the day before
yesterday, was a massive number. Look at the margin of growth over the
old high. Again yesterday we had a number much higher than the record
for a Friday, the week before.
In the next couple of days, we need to pay attention to how low we drop.
Will we start off the week from a high position, or will we drop back down
so that we can't hope for some relief? We'll see...
Section: 07
The Top 200 Counties in the U. S., by Number of Cases
This little report lists 200 Counties in the United States in declining Case numbers.
There is also a listing that is alphabetical. This report list only the entities
and the number of Cases in the two different sorts.
It will also be available as a downloadable Excel file in Section 12.
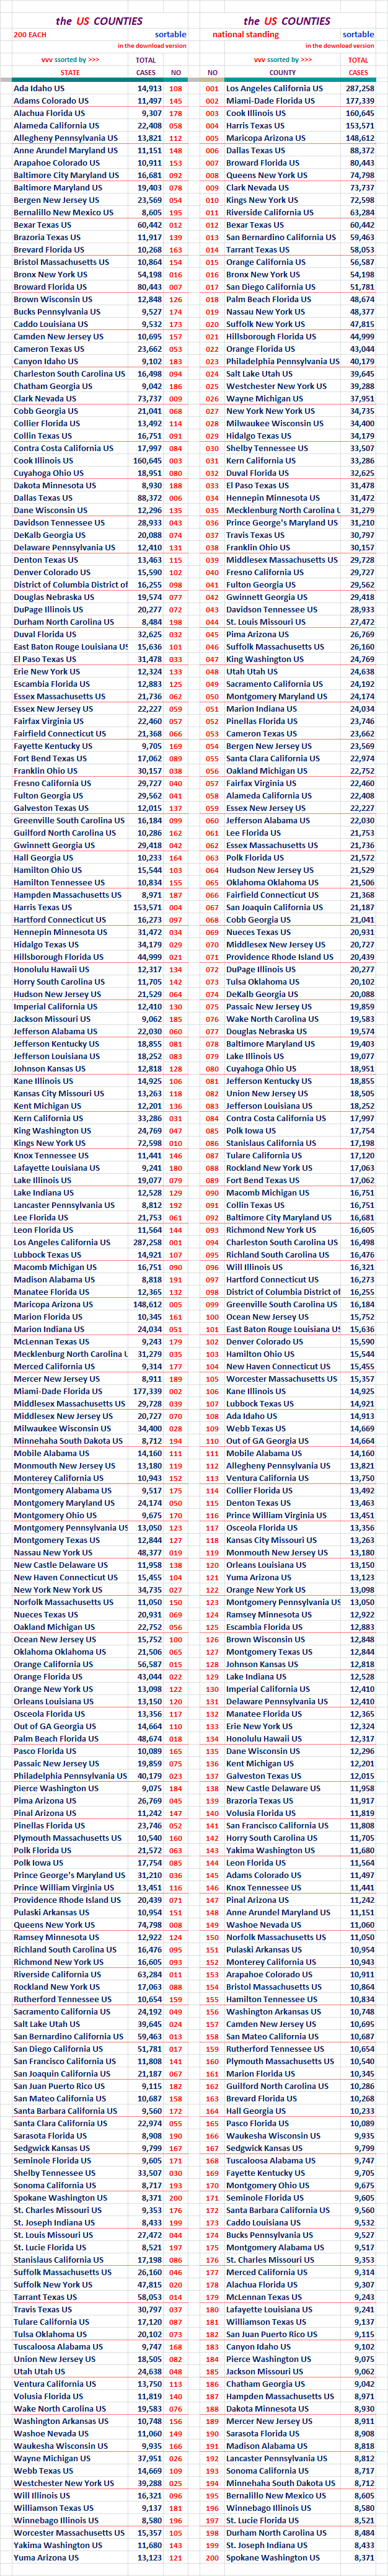
For months Puerto Rico was showing up with the Counties. That stopped in early July
if memory serves me well.
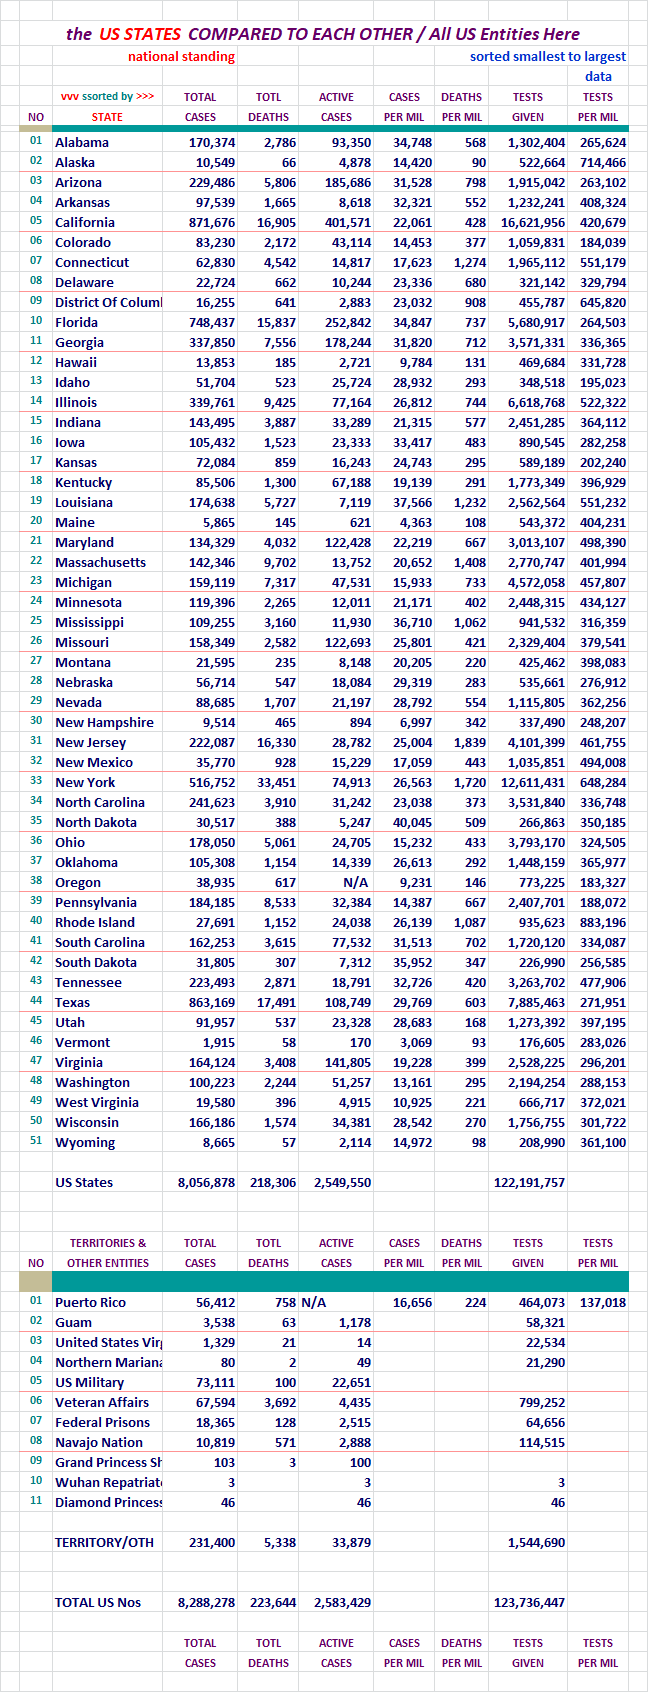
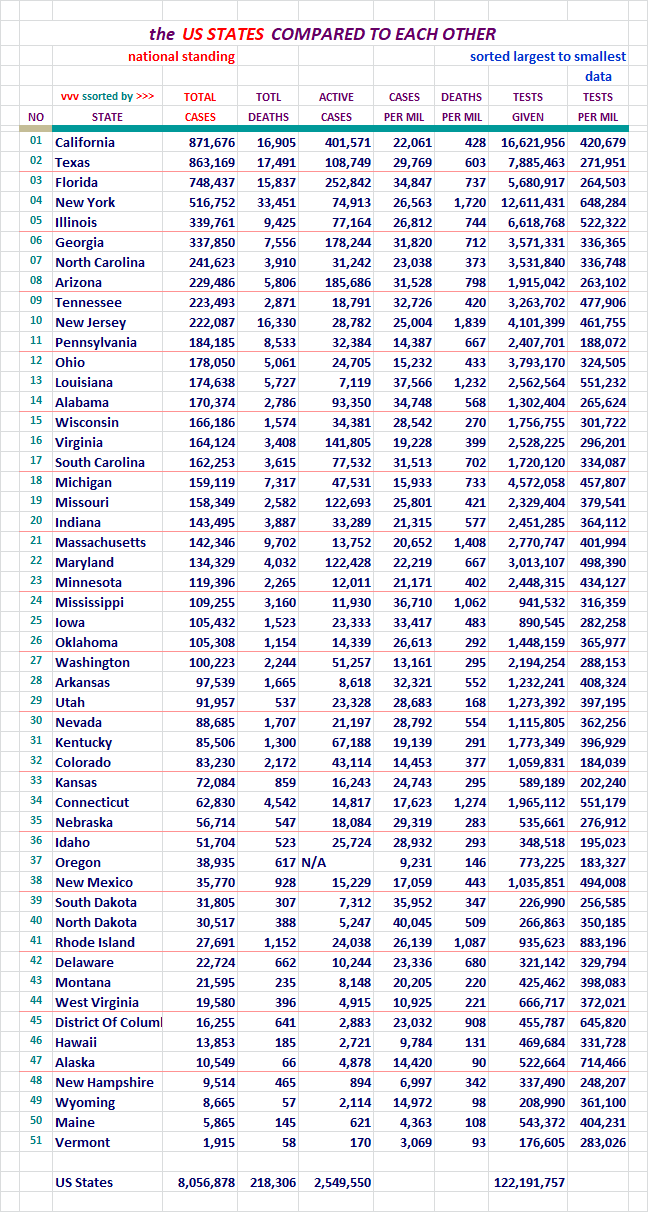
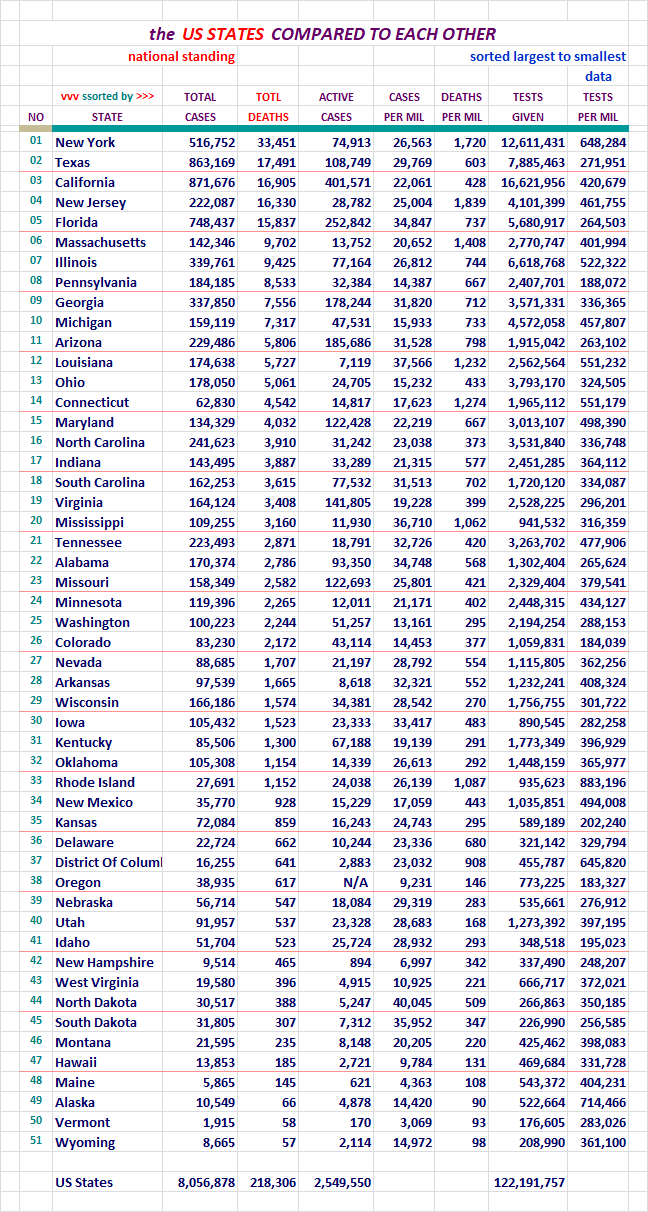
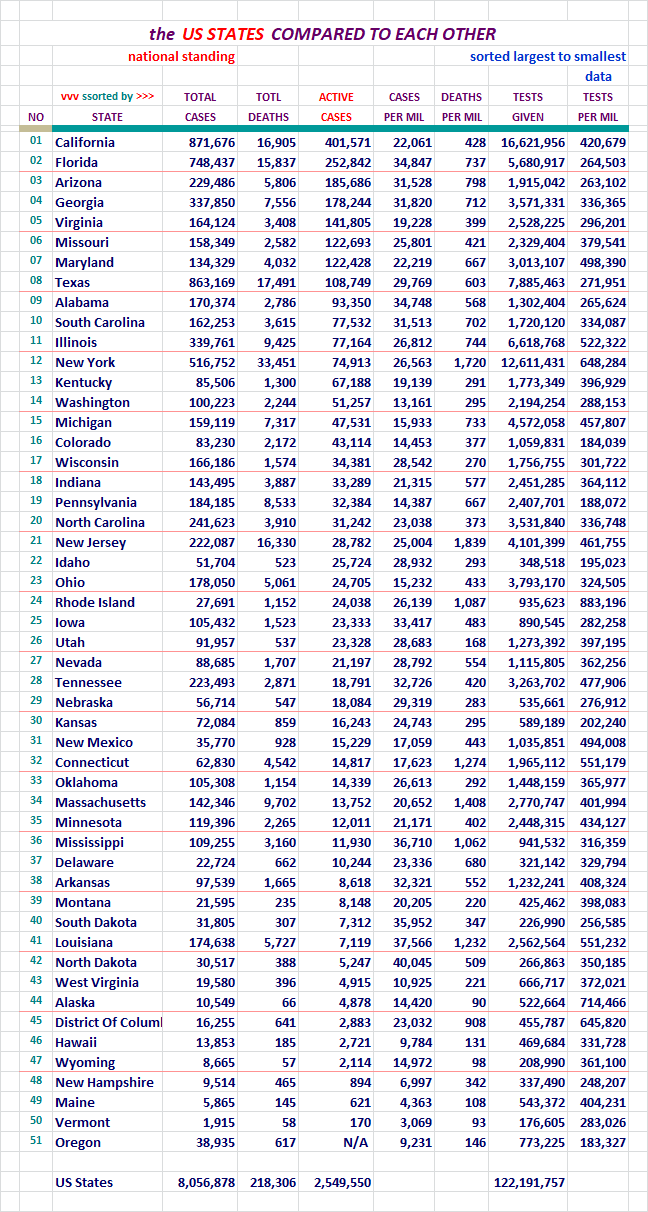
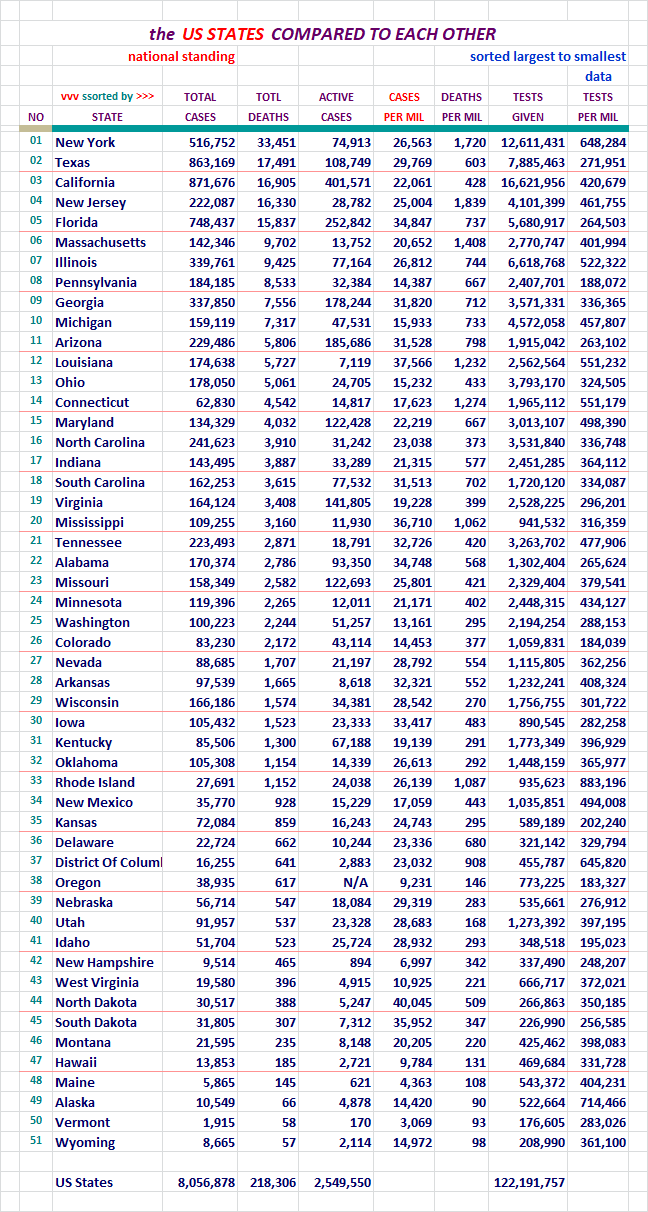
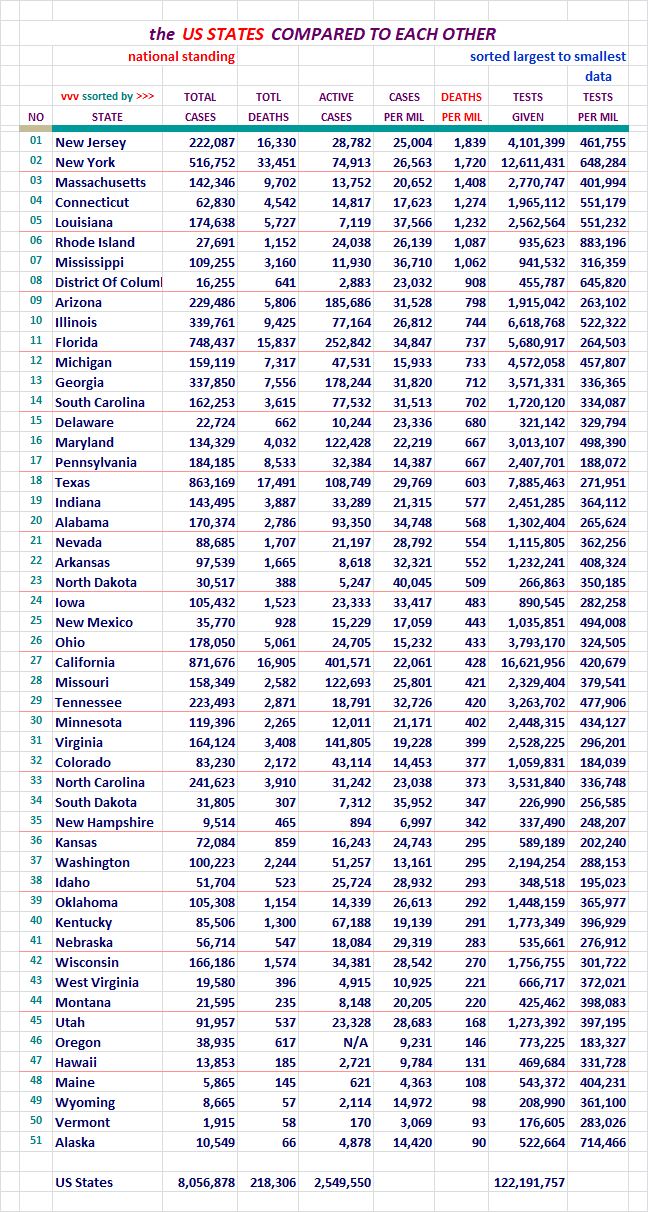
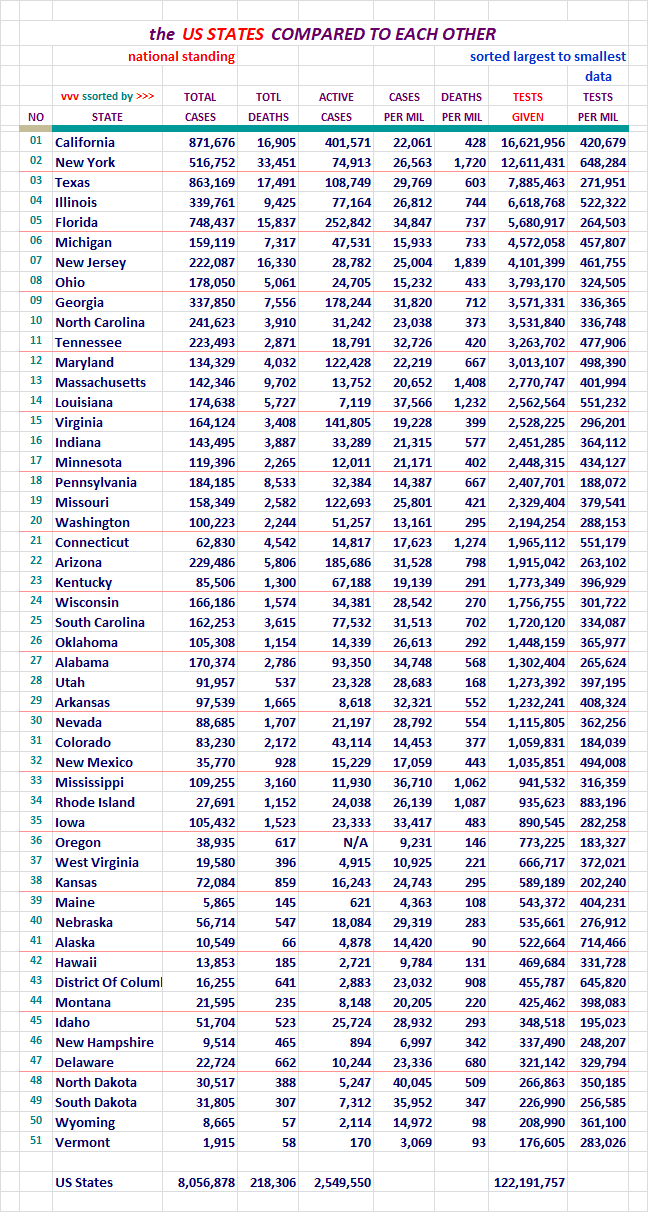
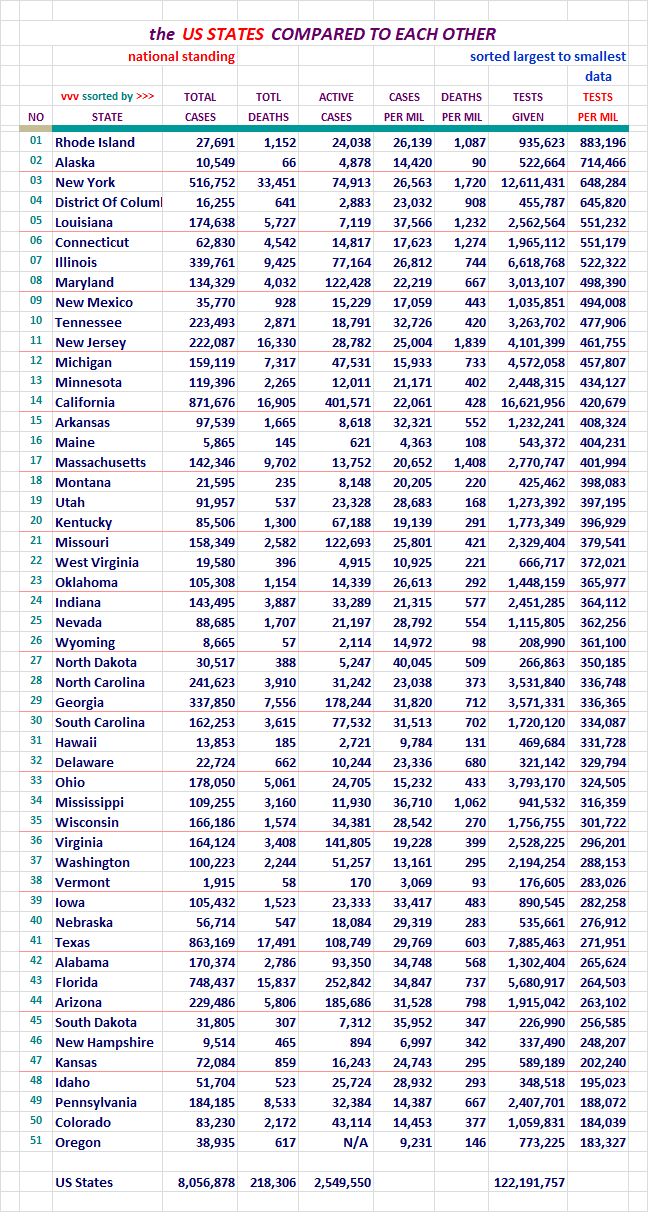
Section: 08
States of the Union and the District of Columbia, Compared to Each Other
Each of these pages is sorted differently. Look at the red header above
the columns to see which column was used for the sort on any given page.
For your review...
For your review...
For your review...
For your review...
For your review...
For your review...
For your review...
For your review...
For your review...
If this area interests you, please use this LINK to the source, and review
the lengthy description and explanation of it's development process.
There are two reports. The presentation above comes from the second one,
and the detailed segmented information below it, may interest you.
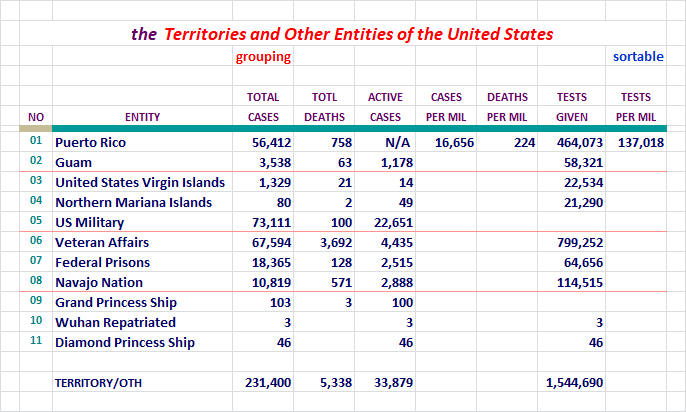
These can now also be found under the states on the Alphabetical list. The
states and these entity's numbers should be combined to match that of the
U. S. figures each day.
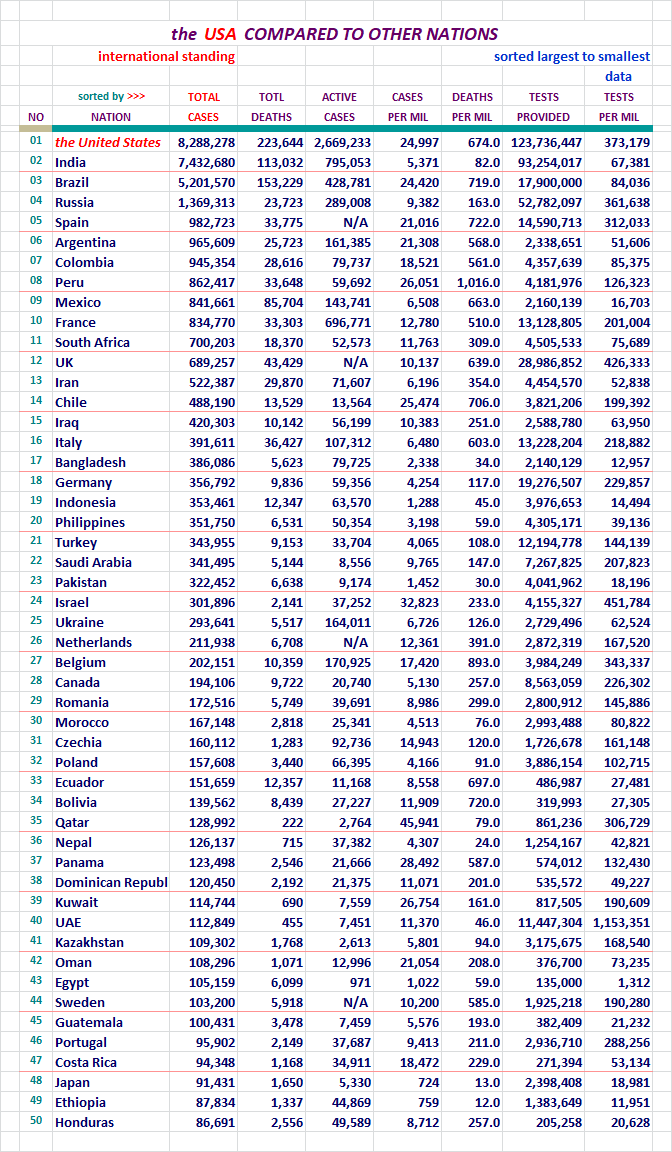
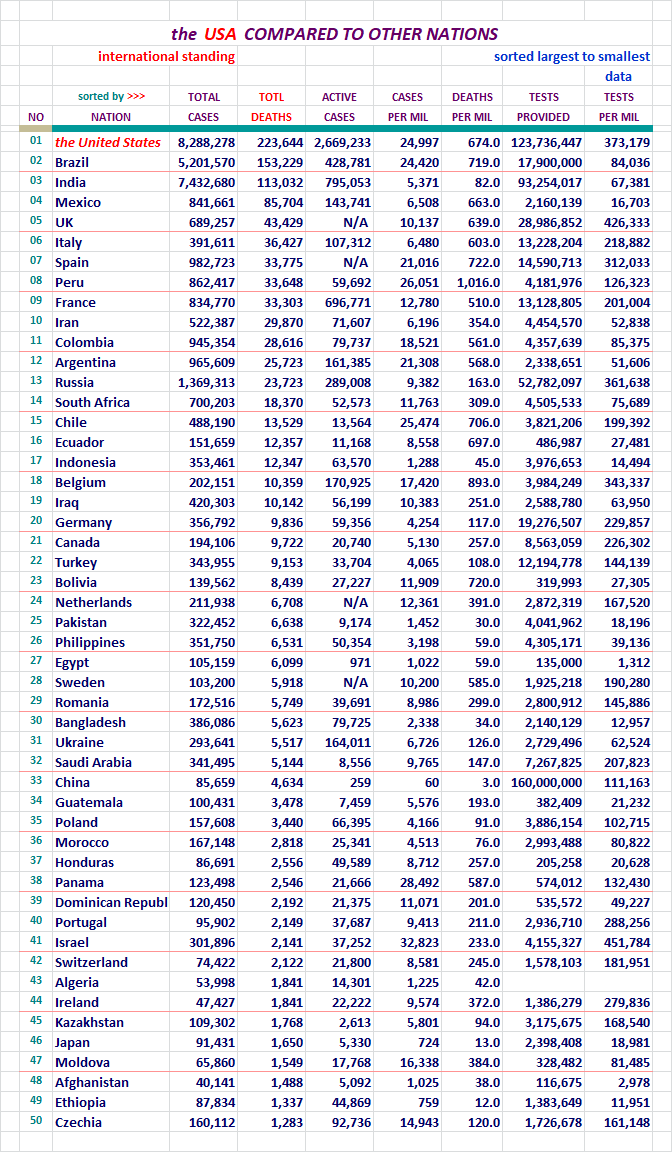
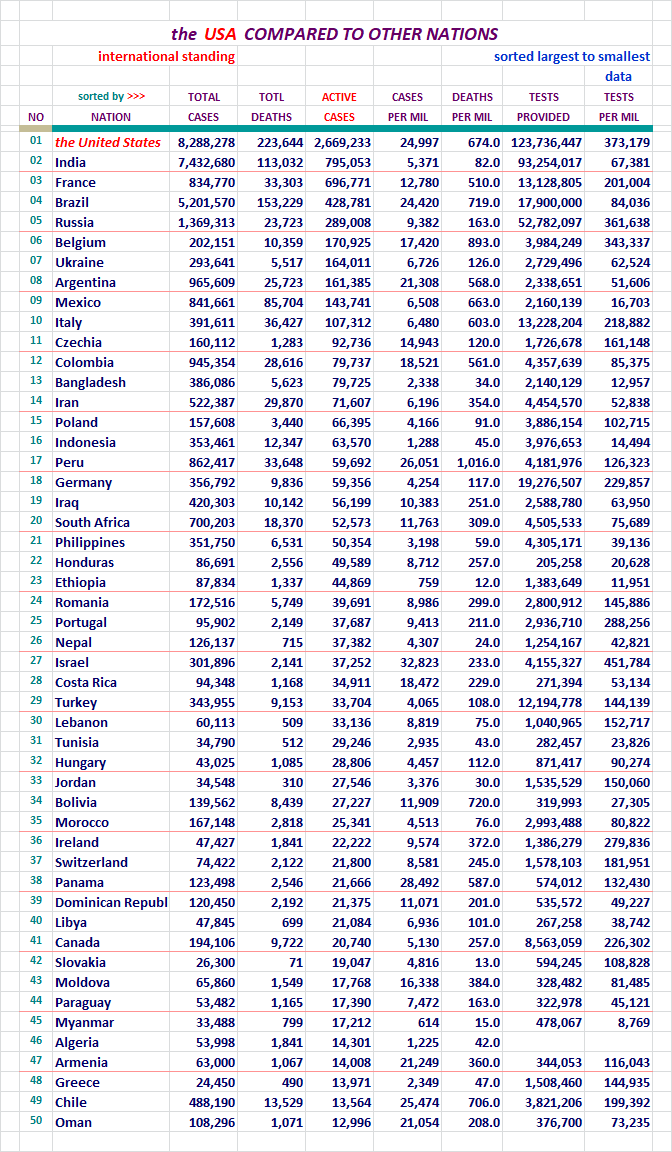
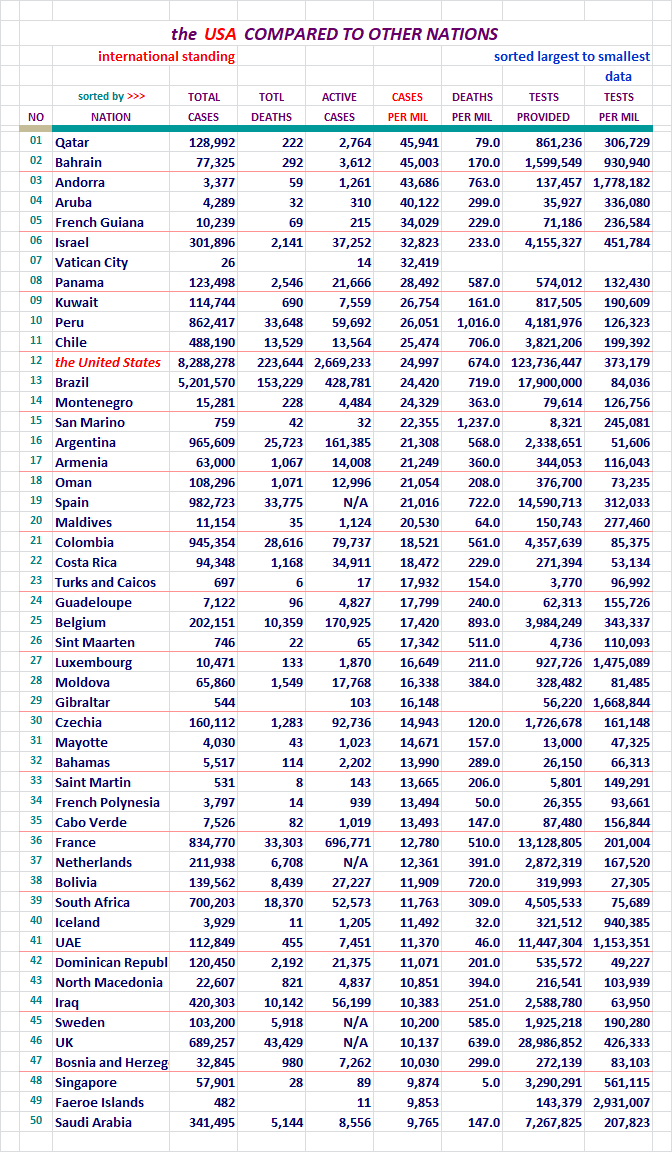
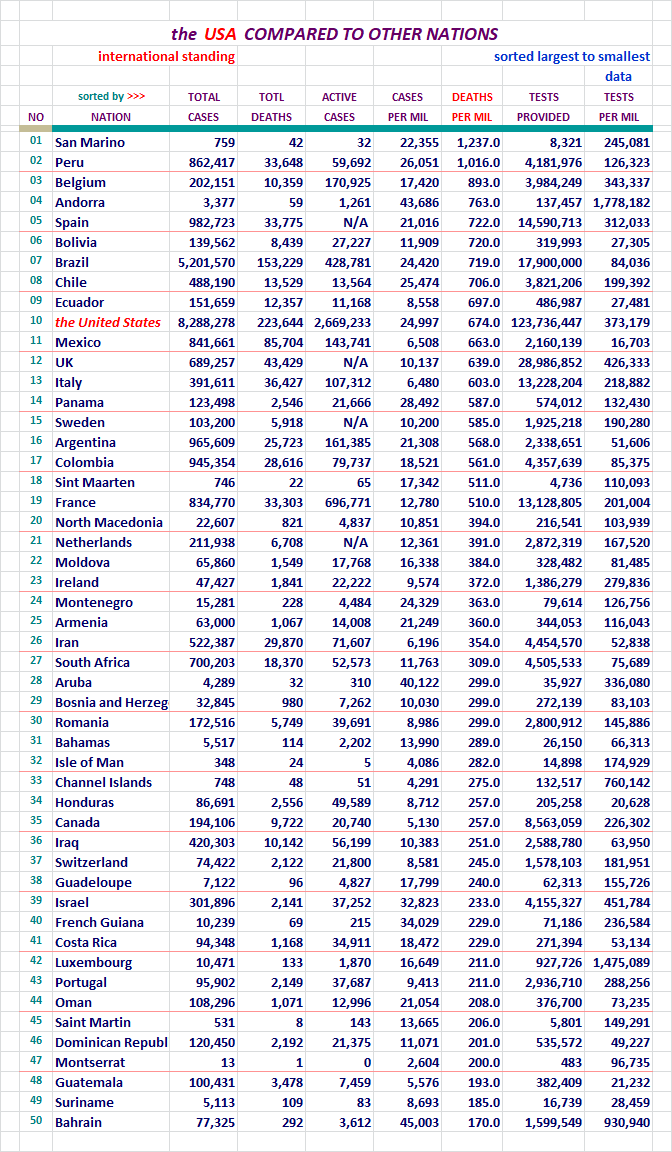
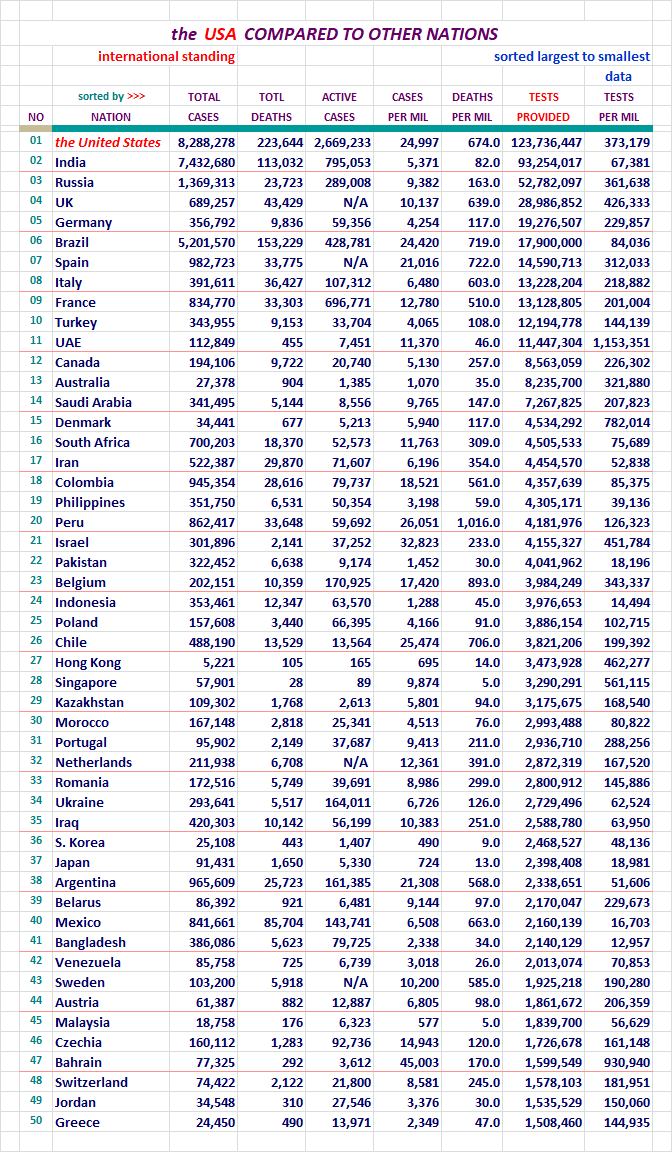
Section: 09
The United States, Where it Ranks With Other Nations?
Each of these pages is sorted differently. Look at the red header above
the columns to see which column was used for the sort on any given page.
The U. S. will be highlighted red here so we can find it easily in the list.
There was 215 nations on this list last night now. I didn't want to post
seven lists with 215 nations on it, so I picked the top 50. Coincidentally,
one report category had the U. S. at 41st, so it wasn't showing up on the
list with the 31 top nations on it. That wasn't the reason why I extended the
list length, but it did work out well.
I work on the nations right next to the states on my spreadsheet. The
states with the District of Columbia come in at a total of 51 lines.
I decided to keep the international reports near that length, and 50
was good enough.
Here we go... for your review.
For your review...
For your review...
For your review...
For your review...
For your review...
Around 06/23, China started putting out it's testing numbers. I thought
they were suspect. The number they put out was 90,410,000. Ours and most
everyone else's numbers are specific. For instance on 06/28, our number of
of tests at the ned of the day was 32,592,368. That specificity separates it
from the number China put out. It was rounded to the 10 thousandth place. In
addition, China did not update that number until 09/02/20. On that date they
raised the number to 160,000,000. As of October 3rd, 2020, they haven't updeded
it again. So I do not inlude China in the Nation's Comparison Sort regarding
Testing, and any place that reports out global testing numbers for a top level
comparison.
Please note that global testing on the Dashboard was only deducting China's
90,410,000 figure from 09/02 through 10/02/2020. I should have been
deducting the 160,000,000 figure, and all global figures during that period
were 69,590,000 tests too high.
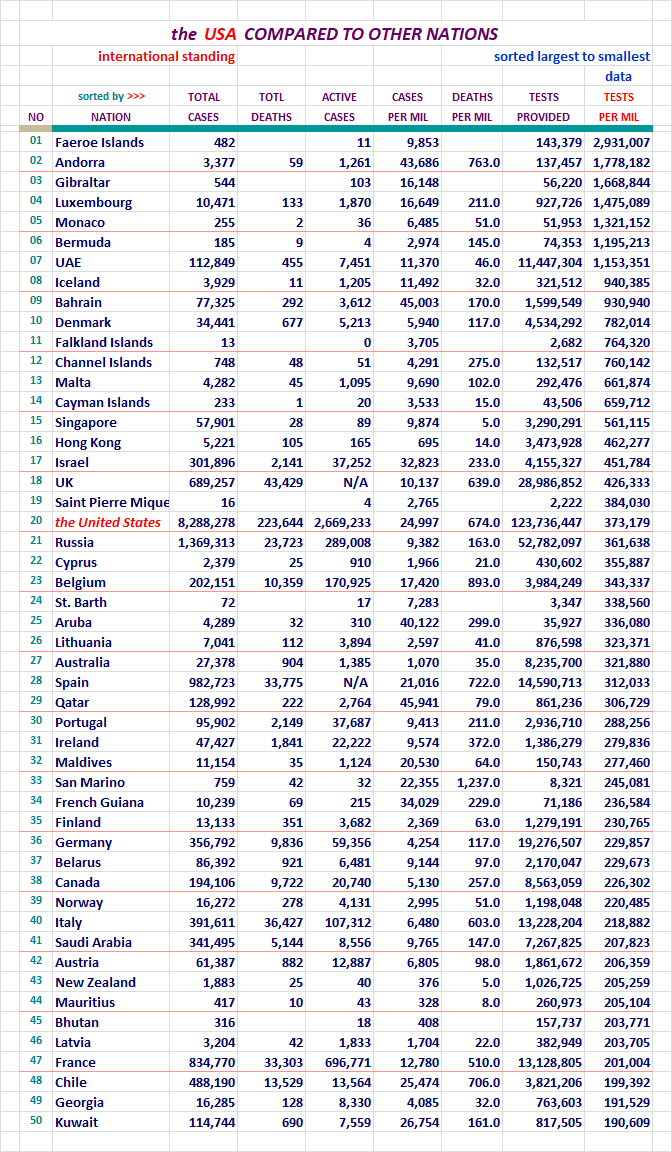
We're been back in 20th again.
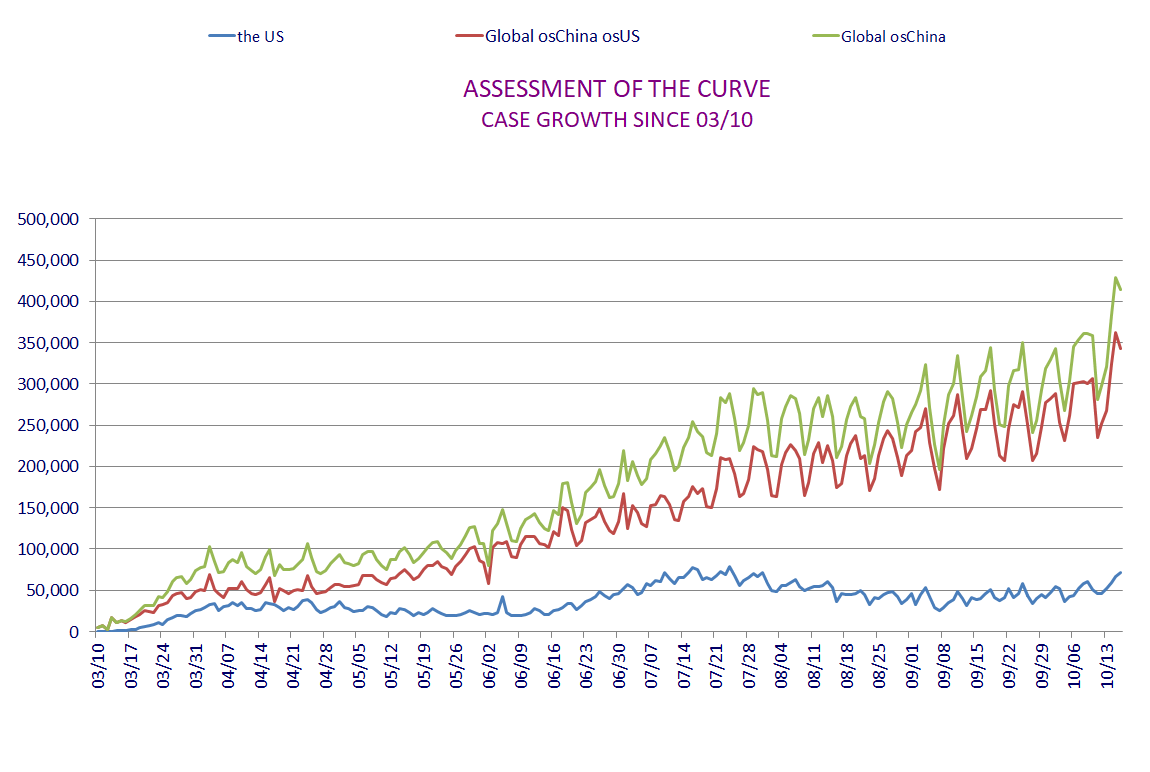
Section: 10
Here is what it is all about. From January 20th to the present.
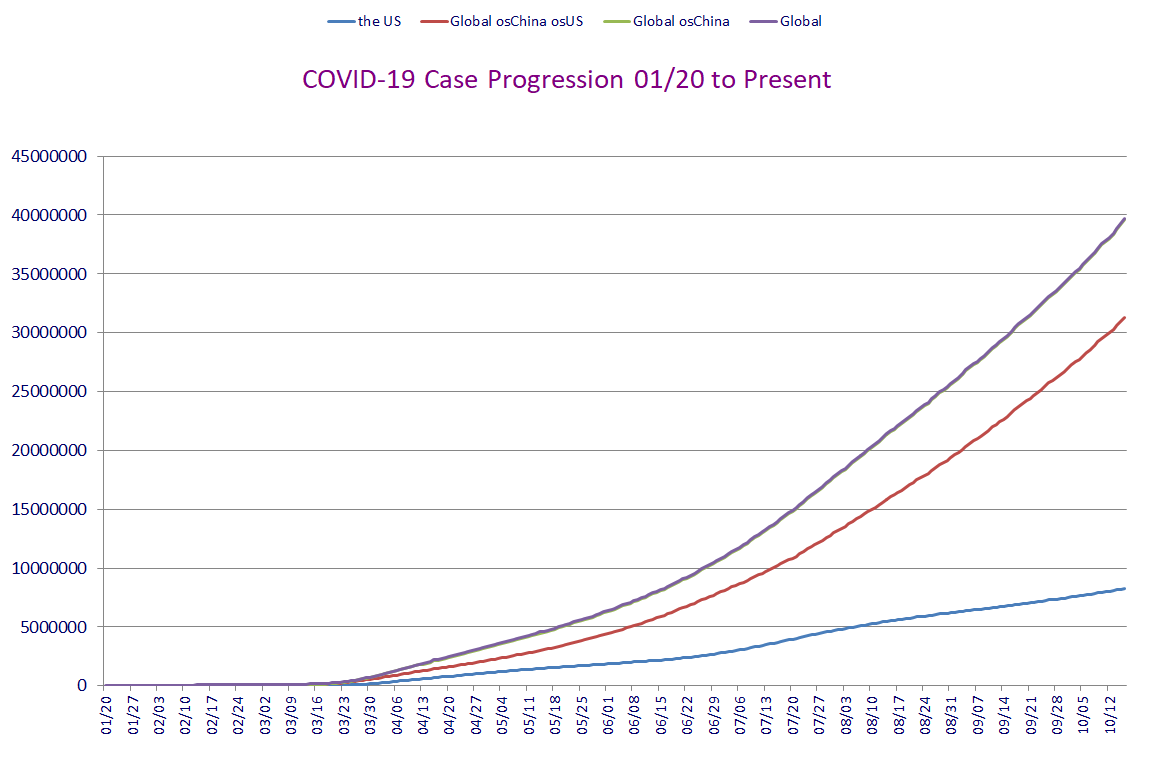
This concludes our look back at yesterday's data. Take care...

Section: 11
Data for this Report Sourced From:
LINK WorldoMeters
LINK Johns Hopkins University
The Center for Systems Science and Engineering (CSSE)
LINK United States Center for Disease Control - Provisional Numbers
Listed in the order of current utilization...
LINK You are Invited to Review My COVID-19 Spreadsheet (XLSX)
There is not an XLS version available for distribution at this time.
Section: 12
Other Features:
LINK US Counties200, States & DC51, Territories & Other Entities11, Nations219,
and the CDC Provisional Counts53
Five Excel Spreadsheet datasets you can sort for your own studies...
Section: 13
Links to other resources:
I cannot vouch for these sites. Please use your own judgement.
LINK Adventist Health Coronavirus Resource Hub - Scroll down for useful info
LINK Antibiotic Vitamin, the (Vitamin D)
Good article on Vitamin D's likely role in prevention of infection. Thanks Blam.
LINK CDC Data for Download - Scroll down - Excel required. Includes death stats.
LINK CDC National Center for Health Services
Provisional deaths as determined by review of vital documents. Much lower...
LINK CDC Secondary Data and Statistics - Portal Entry / Look around
LINK Coronavirus (COVID-19) Map
LINK Coronavirus infection risk may be reduced by Vitamin D
by Former CDC Chief Dr. Tom Frieden
LINK Coronavirus Spread Quickly Around the World in Late 2019, Study Shows
the University College London Genetics Institute
LINK COVID-19 Deaths Broken Out by Thirds, 05/07/20 Map of US Counties
Very revealing display of Concentrated Death Zones - thanks hoosiermama
LINK COVID-19 First U.S. Case, Treatment, features Remdesivir
New England Journal of Medicine article
LINK Cytokine Storm, med Actemra, Physician near death saved
LINK Diamond Princess Review at 634 Case Point of Eventual 712
LINK Hydroxychloroquine Article: International Poll
Daily Mail Reports, Most Effective Treatment According to 6,000 Physicians
LINK Hydroxychloroquine Has about 90 Percent Chance of Helping COVID-19 Patients
the Association of American Physicians and Surgeons, reports 91.6% of patients improved clinically
LINK IHME - Institute for Health Matrix and Evaluation
LINK National Institutes of Health - Cornavirus (COVID-19)
LINK Nasal Irrigation is the Key, COVID-19 Related
LINK New York City - interesting breakdown, borough, age, sex
LINK On the Origin of CCP Virus, A Documentary Movie (turn up the sound)
Epoch Times: I highly recommend this very well documented report.
LINK Rt COVID-19
Calculates and displays the Rt Factor for each state. Thanks FreedomPoster.
LINK World Health Organization

No new data from the PA Department of Health today...probably a two day update Sunday of Monday.
Thanks for letting folks know...
The NBA players don’t wear masks on the court, yet not a single NBA player has died from the China virus.
https://www.statista.com/chart/22432/nba-season-restart-covid/
The NFL players don’t wear masks on the field, yet not a single NFL player has died from the China virus.
https://www.espn.com/nfl/story/_/id/29648271/nfl-positive-test-rate-all-personnel-stands-046
It makes you wonder what they told the terrorists that they
didn’t tell us doesn’t it.
They’re telling us to lock down at home, and telling them
to go burn cities down in a tight knit group.
It does make you wonder.
Disclaimer: Opinions posted on Free Republic are those of the individual posters and do not necessarily represent the opinion of Free Republic or its management. All materials posted herein are protected by copyright law and the exemption for fair use of copyrighted works.