Posted on 07/06/2020 2:52:34 PM PDT by DoughtyOne
PING LIST - Please contact me as needed...
COVID-19 Update # 110
As of 07/05/2020 23:15 PDST United States CDC - Provisional Numbers
As of 00/00/2020 23:45 PDST Johns Hopkins University - Capture Nations Informaton
As of 00/00/2020 23:45 PDST Johns Hopkins University - Capture Counties Information
As of 00/00/2020 23:46 PDST Johns Hopkins University - Process JHU Data
As of 00/00/2020 23:59 PDST WorldofMeters - Document Core Numbers
As of 00/00/2020 23:59 PDST WorldofMeters - Capture Nations Information
As of 00/00/2020 23:59 PDST WorldofMeters - Capture States Information
As of 00/00/2020 00:00 PDST WorldofMeters - Data Processing begins...
As of 00/00/2020 ??:?? PDST Publish COVID-19 Update - 00/00/00
Thank you for stopping by to check out the COVID-19 Update.
Here you can find...
Section: 01 Commentary, Special Reports, COVID-19 Update Info, & System Notes
Section: 02 the United States Situation
Section: 03 the Global Community Situation Outside China
Section: 04 the Global Community Situation Including China with reservations
Section: 05 the Mortality Report
Section: 06 Miscellaneous Reports of Interest
Section: 07 the United States, Counties (alphabetical / case no descending)
Section: 08 the United States, States Ranking, Provisional Numbers, & Territories
Section: 09 the United States, Ranked with Other Nations
Section: 10 the End of this COVID-19 Update
Section: 11 Data Sources and a Link to My Own Spreadsheet
Section: 12 Linked Spreadsheet: Counties, States, Provisional, Territories, & Nations
Section: 13 Links to Other Resources
Section: 01
Commentary, Special Reports, and COVID-19 Update Information1
Interesting Tid-bits (hopefully)
Very Low Fatality Numbers Coming In
The Fatalities for yesterday were very low again. They were 11.93% lower than
the already low number from the Sunday before.
They should rise a bit today going into the regular week. As of 14:31 PDST it's
looking like another sub-300 day today. Very nice...
China Decides to Play the 'Who Did the Most Testing Game?"
Around 06/23, China started putting out it's testing numbers. I thought
they were suspect. The number they put out was 90,410,000. Ours and most
everyone else's numbers are specific. For instance on 06/28, our number of
of tests at the ned of the day was 32,592,368. That specificity separates it
from the number China put out. It was rounded to the 10 thousandth place. In
addition, China has not updated that number once. So I do not inlude China in
the Nation's Comparison Sort regarding Testing, and any place that reports out
global testing numbers for a comparison.

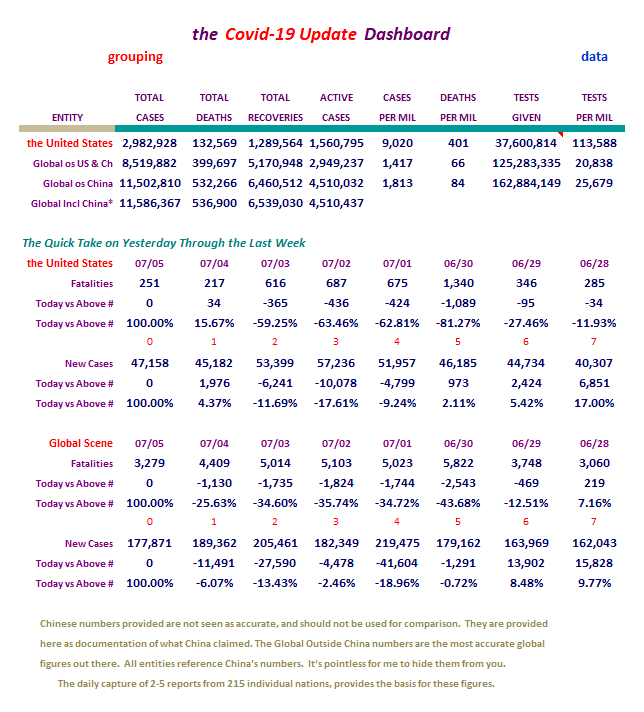
Section: 02
The Following Addresses the Numbers Here in
the United Staetes of America
Here we go...
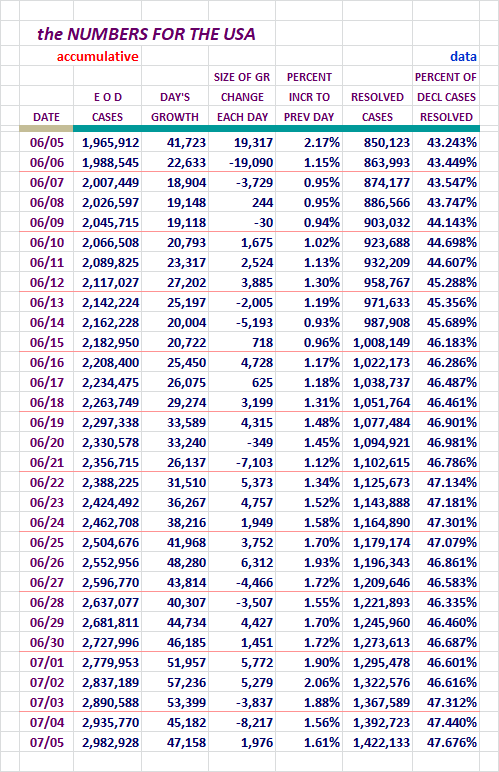
Yesterday was another very high day of reported New Cases. Testing levels again
came in a lot higher than they used to. That is fast becoming the new normal
though, so higher New Cases will continue to be reported out, and continue to
be artificually high.
Concept of adding in Active Cases and Serious Critical here, courtesy of amorphous
Here are more of our numbers...
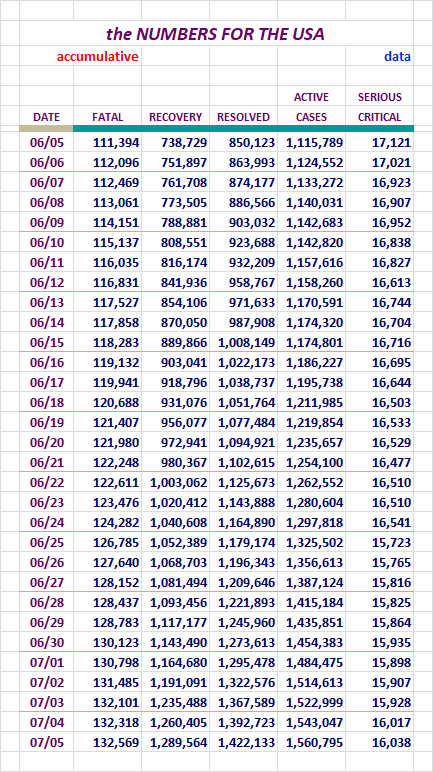
Active cases continue to climb.
Our Slice of the COVID-19 Pie
The growth of our slice of the pie has been dropping recently.
Here are the numbers I've been tracking, Globally Declared and Active Cases.
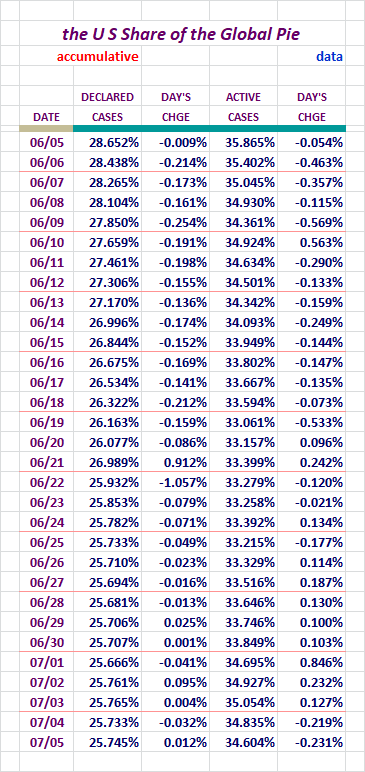
It was nice to see improvement in this area the day before yesterday, but there
we were back to a mixed bag yesterday.
Active Cases in the United States / Chart
Unlike some of the other charts here, we should see a good rise and
fall at some point withone.
Note that this presents the one day and then 7 and 14 day averaging versions.
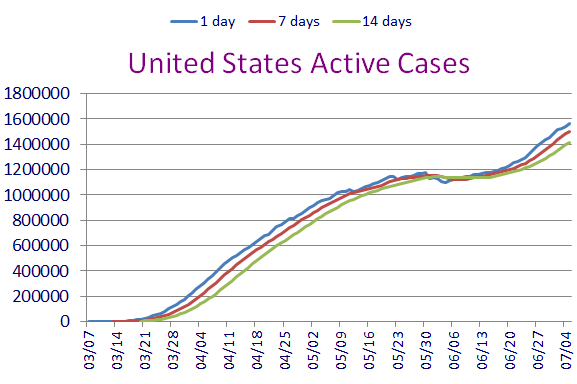
Remember, these are not new Declared Cases. These are remaing Active Cases.
Clearly the single, seven, and fourteen day lines are moving way up.
Testing and New Case Figures
Requested by stocksthatgoup
Some folks have shown an interest in seeing the COVID-19 Test figures compared
to the New Cases being declared. The following Data addresses that.
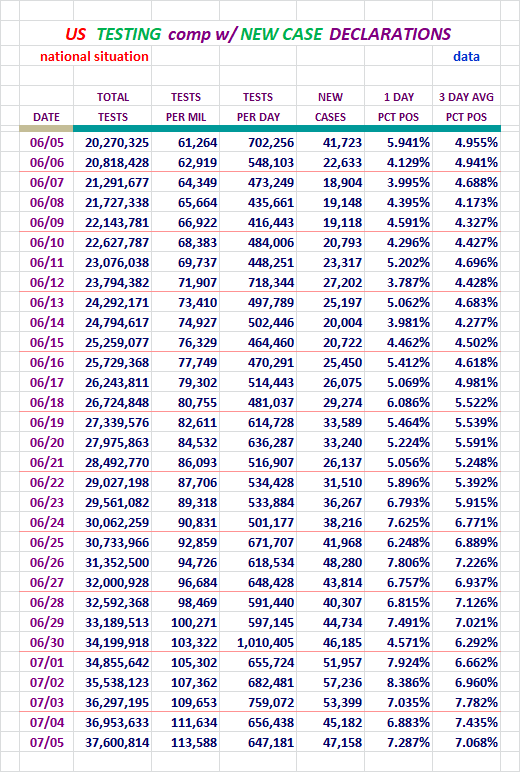
Postive percentages moved back up a bit yesterday. They do seem to hop around
day to day.
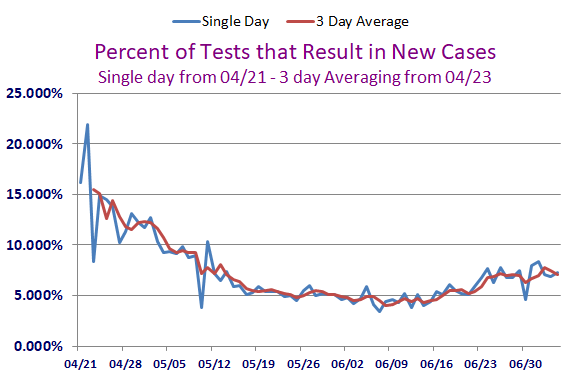
We may have settled into a rut here from 6.8 to around 7.2%.
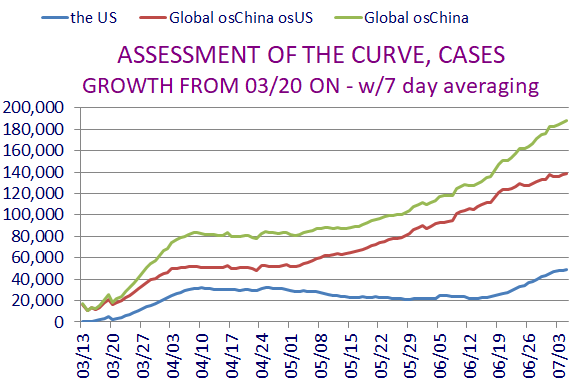
The U. S. Stats / w 10 Day Averaging / Fr: 03/17
Requested by: Texas Eagle
This data and chart presents things in a little different way. In the
chart it is easy to see the relationship of these numbers.
The Chart will use the data all the way back to 03/17, but the data displayed
here will only go back one month.
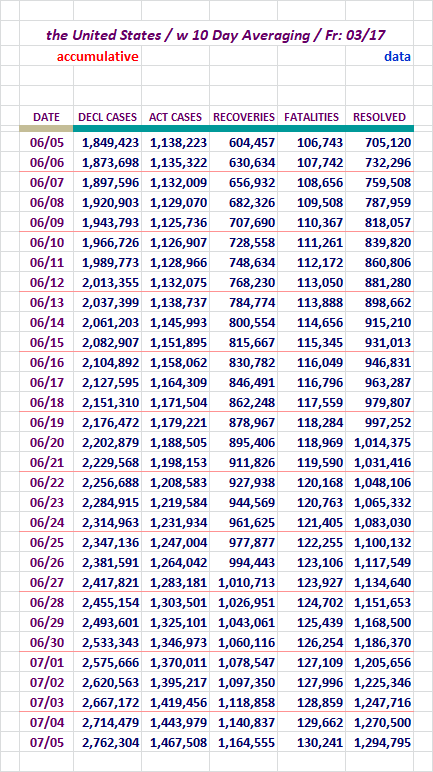
Here is the chart to match.
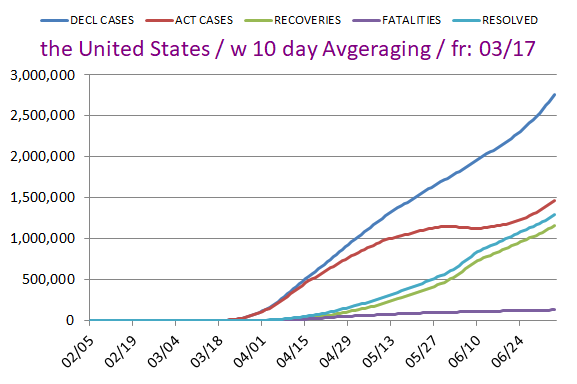
These seemed to be getting closer each day, but the Active Case line is veering
ever so slightly away from the Recovery line.
Section: 03
The Following Addresses the Global Numbers
without Mainland China
Here is the first set of Data for the Global Outside China
Territories
Wednesday took the title for the highest New Cases last week. I probably should
have looked into that more than I did. It seems enough out of place to
warrant a little discovery mission...
Fata.lities, Recoveries, Resolved, Active Cases, and
Serious/Critical Cases - Globally, Excluding M/L China
Concept of adding in Active Cases and
Serious/Critical here, courtesy of amorphous
Here we go...
For your review...
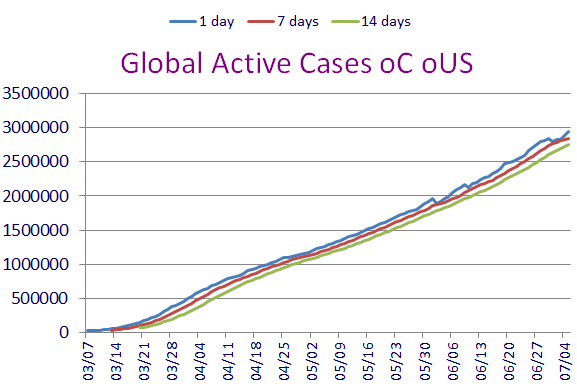
How is the Global Community Outside China Doing,
Without U. S. numbers?
Let's see...
This area dropped off a little yesterday. We're headed higher, but day to day
we are seeing fluctuation up and down.
New Case both globally and domestically fell off yesterday. Again, as long as
Fatalities remain on the lower end of the spectrum, that's good. Yesterday's
Fatality figure was very good.

These charts are now not only seeing growth internationally, but domestically
as well.
The Active Cases outside China Globally / Chart
As in the U. S. version of this, we should see a good rise and fall at
some point these two.
Note that these present the one day and then 7 and 14 day averaging versions.
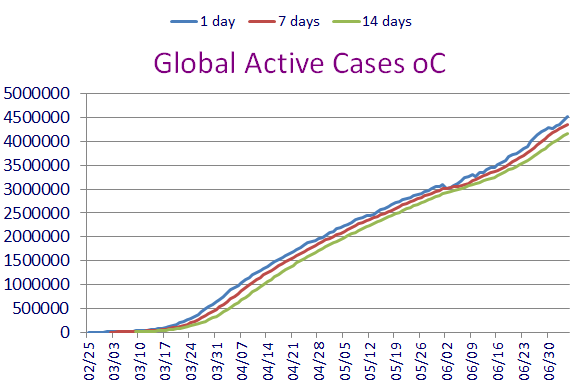
Remember, these are not new declared Cases. These are remaing active cases.
Global Active Cases fell off yesterday. The single day figure is heading every
which way.
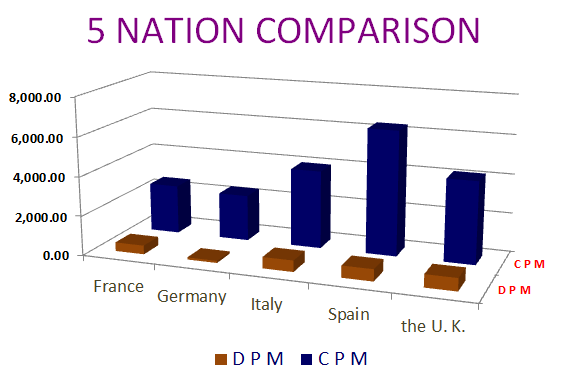
Special Section on France, Germany, Italy, Spain, and the U. K.
Case growth.
Jim Noble mentioned he'd like to see the US numbers added here. I added them
in on 06/21/2020. I did not add them to the chart because it would have
dwarfed the European nations chart lines. (they would have been reduced to
about 15% of their normal size)
Let's Look at Some Numbers in Five Day Increments:
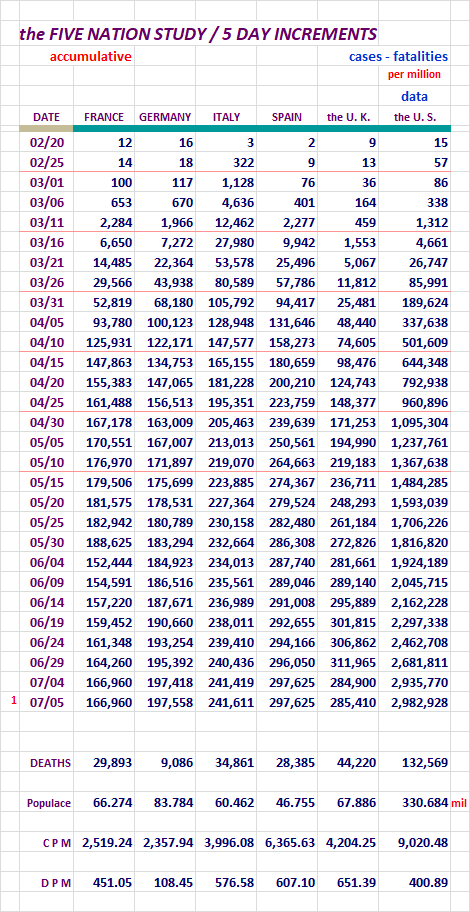
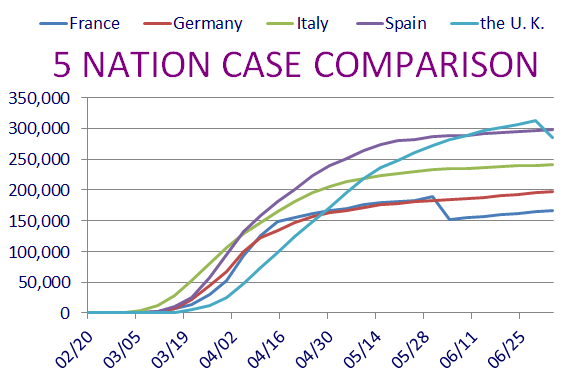
Hard to miss the correction in the direction of the U. K. there. I double checked
the data, and the correction has been sustained for the last day and a half.
It is accurate. Unless a correction occurs, the U. K. just changed
direction.
The U. K. line there is quite similar to France's line over a month ago.
Sweden and It's Neighbors, Who Has the Best Tactic Against COVID-19?
Sweden is doing its own thing with regard to isolating. I think most people
are aware of it by now.
Here are some numbers to help us look at this issue.
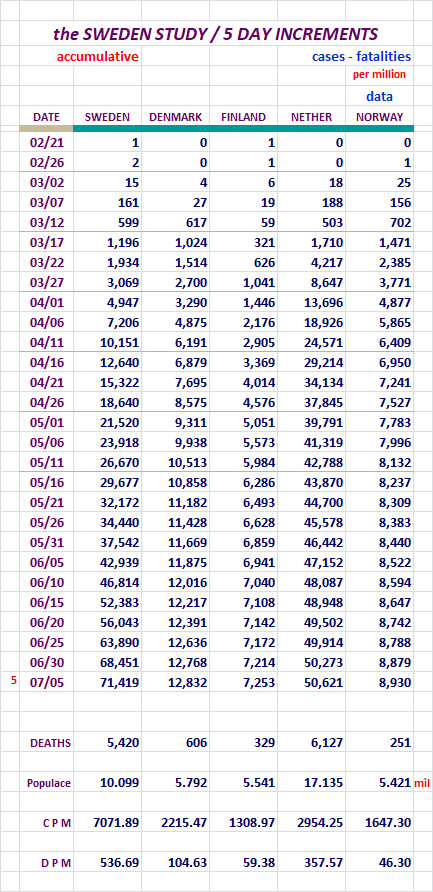
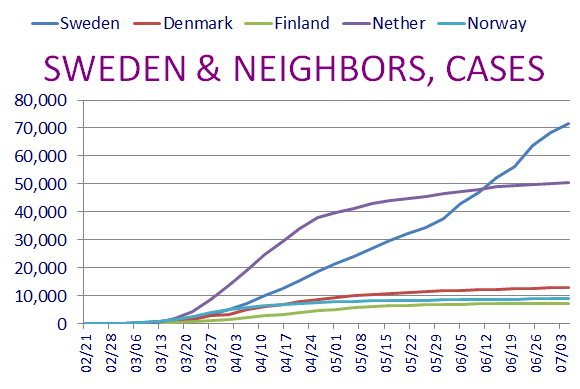
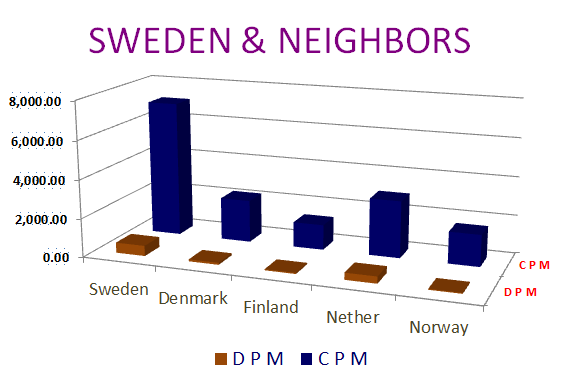
Sweden still remains a hot topic, and it's tragectory IS NOT looking good
on that Chart. In it's own group, it's not good at all. If you compare it
to some European Nations, it looks no worse.
Movers and Shakers...
I will present the top fifty nations with the most New Cases and New
Fatilities.
Here we go...
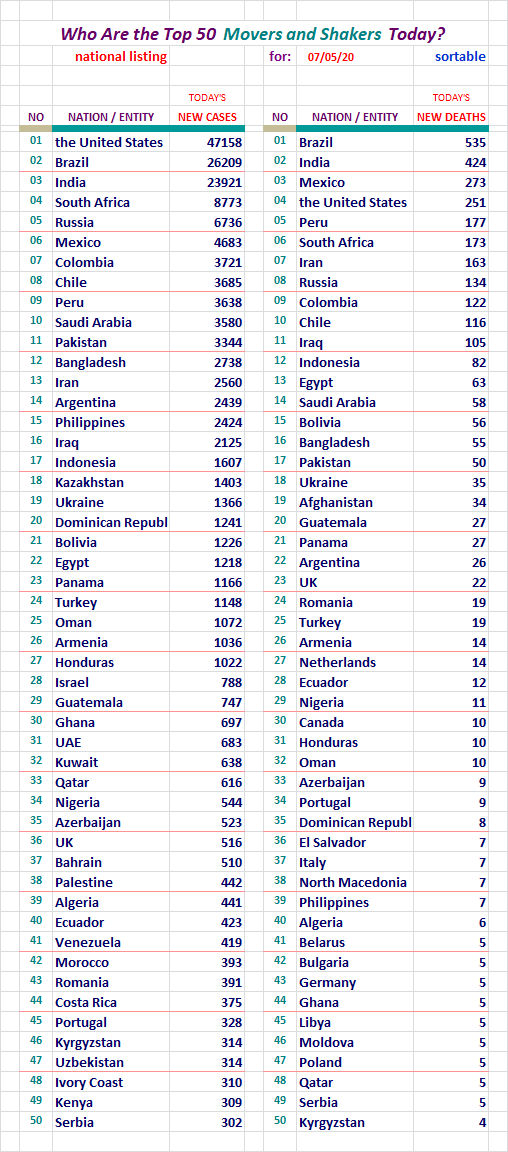
Some good and bad there. Remember, our testing was again at a new level of
testing we've been in for about 12 days now.
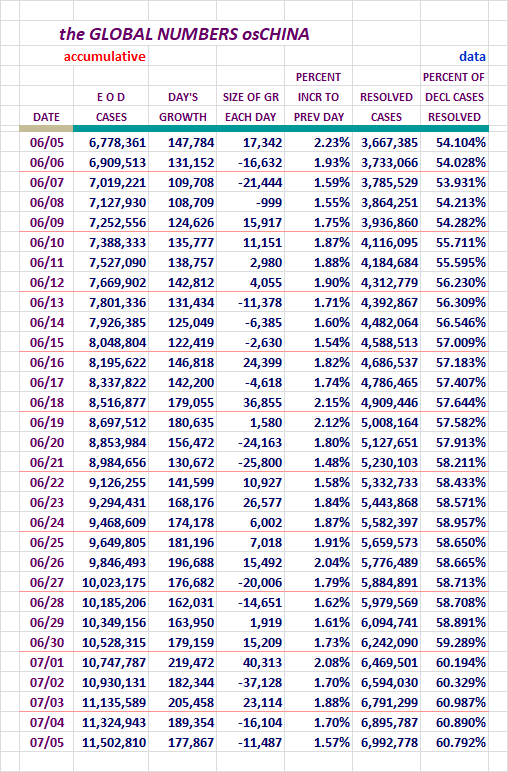
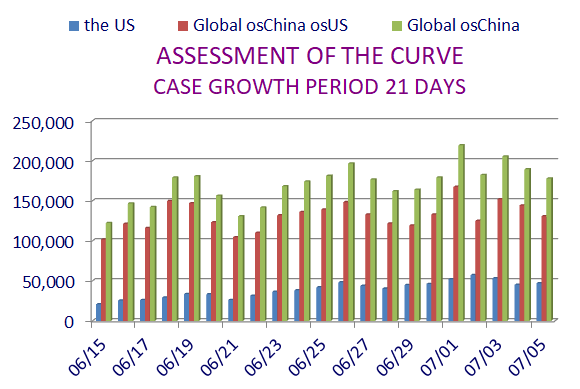
Global osChina Stats / w 10 Day Averaging / Fr: 03/05
Requested by: Texas Eagle
This data and chart presents things in a little different way. In the
chart it is easy to see the relationship of these numbers.
The Chart will use the data all the way back to 03/05, but the data
displayed here will only go back one month.
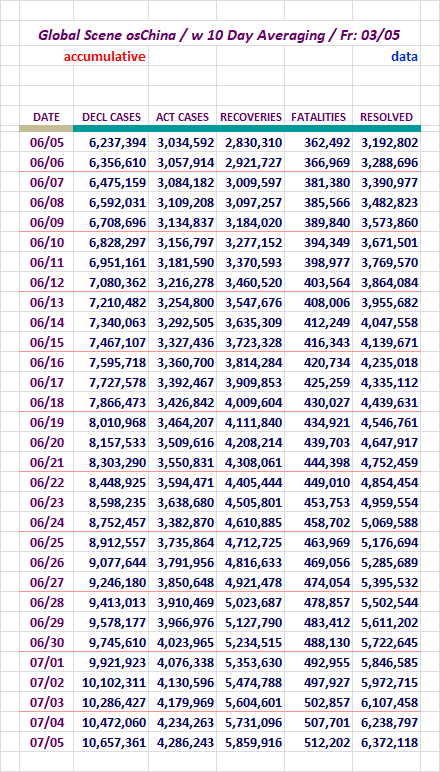
Here is the chart to match.
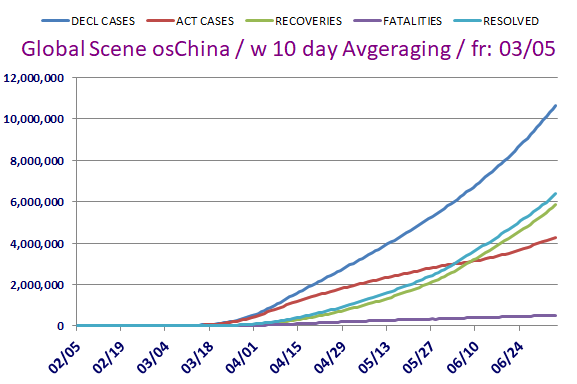
I like being able to follow the movement of these stats visually.
Section: 04
The Following Addresses the Global Numbers
including Mainland China*
Mainland China's numbers are 0.009% of today's total global numbers.
A Look at Declared, Resolved, and Active Cases, Includes M/L China
End of day figures follow:

Still above 61% recoveries, but it is sagging a bit over the last couple of days..
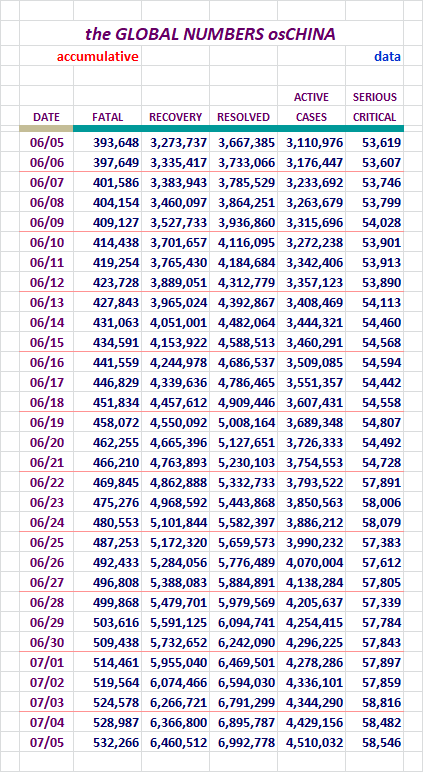
Fatalities, Recoveries, Resolved, Active, and Serious/Critical
Cases Globally, Including M/L China
Concept of adding in Active Cases and
Serious/Critical here, courtesy of amorphous
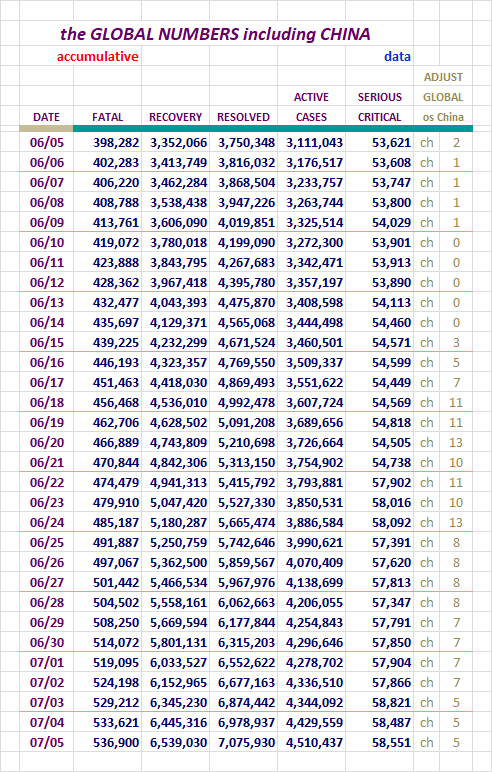
For your review...
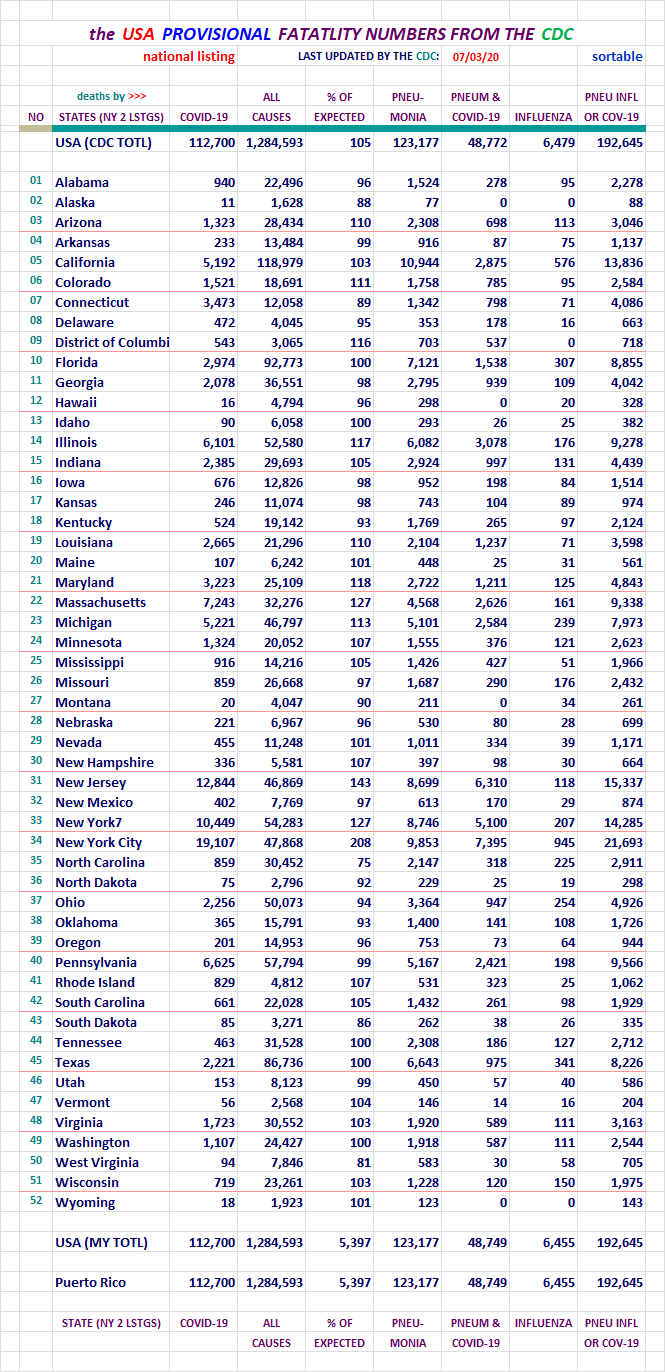
Section: 05
the Mortality Report
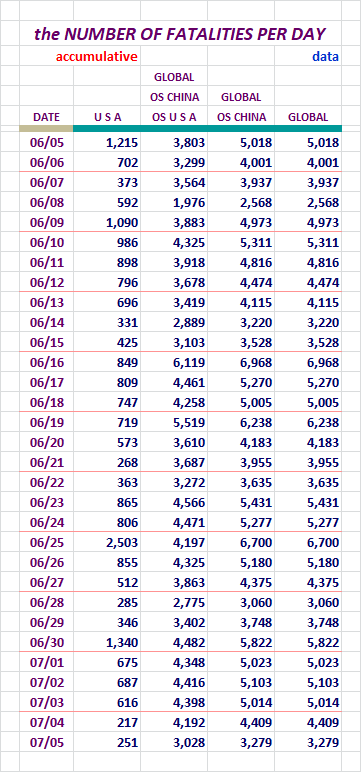
Here is the data for four entities...
Here are the figures for the growing case totals for four entities.
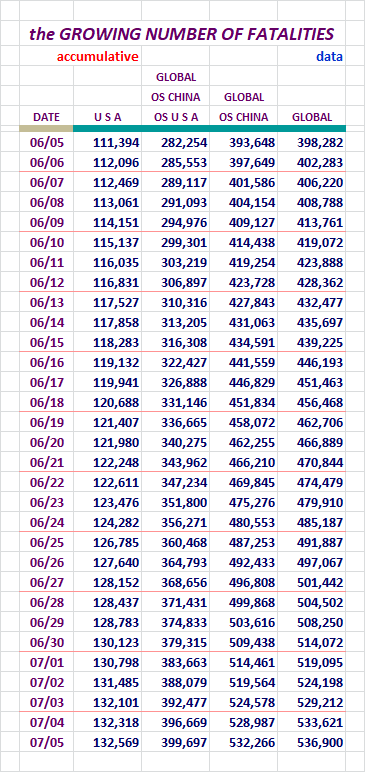
We hear all sorts of stories about how these figures are wildly off. The CDC
has studied them and seems to think they may actually be on the low side of
things. I am providing the CDC Provential Numbers down below. Not sure if
anyone has a rock solid number. I doubt it is possible. This is what is
reported out by WoM and JHU. Check out the CDC numbers too.
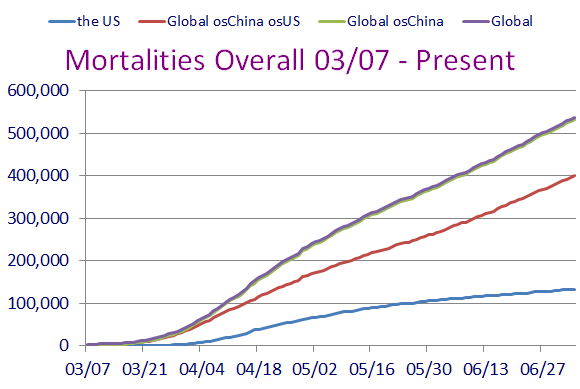
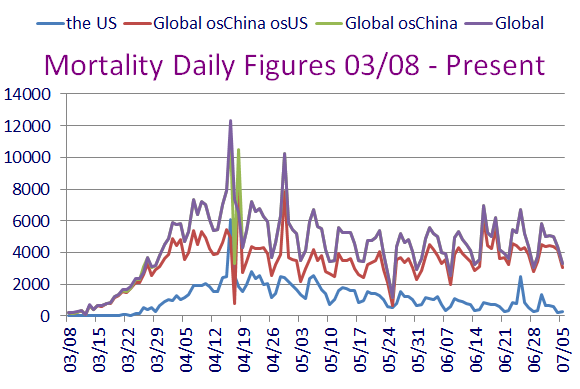
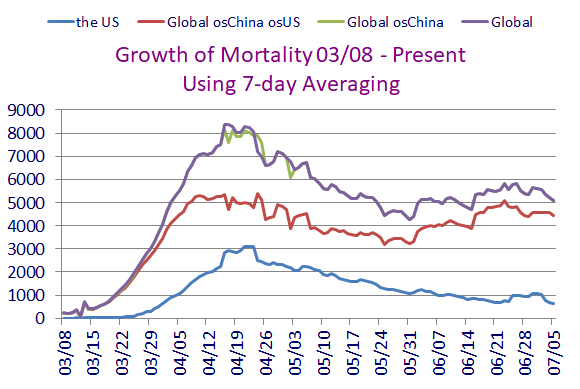
Charts like this one only show growth. That's why I recently took the advice
of a FReeper and added in a new chart for the U. S. and Global outside China
regions.
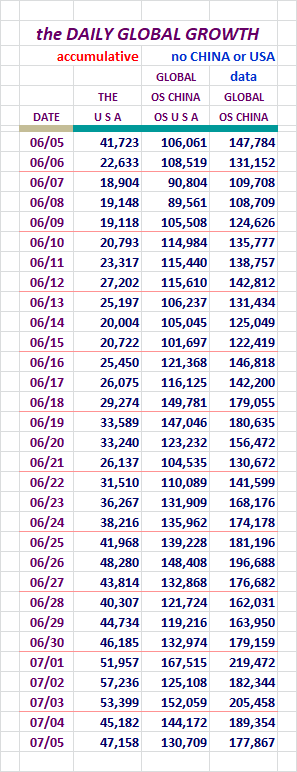
Here are figures revealing the daily growth for those four entities.
US Fatalities continue to remain in sub-1,000 territory.
Since the beginning of COVID-19's activity in the U. S., higher New Cases were
soon followed by elevated Fatalities. If we have gone to school on the data
of this disease, we know who should avoid exposure the most. So if the
demographic that has little to fear from the disease is out there getting
infected, it may not be a bad thing at all. If the Fatalities remain low,
vastly higher cases may simply increase the rapidity of the saturation of the
people in public who have already fought it off. And that may facilitate the
end of the disease. I'm sure others know this, but I did want to explain why
my thinking has fluctuated over time regarding these dynamics.
Here, let's look at data for the U. S. broken out by itself.
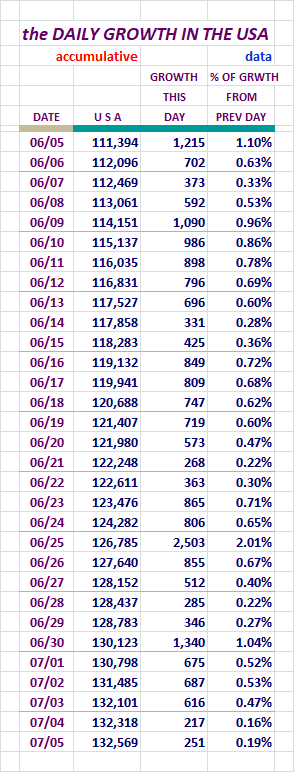
In the lasts 30 days, we have looked very good in this area. I'm not sure we've
had even one clean count day over 1,000 out of those 30 days.
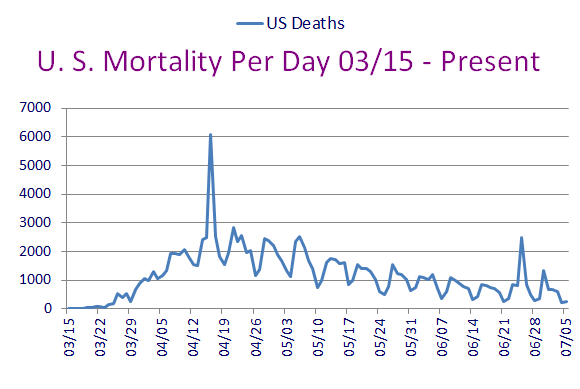
New York, New Jersey, I'm sure you'll have a very hard time figuring out where
they botched things... /s We had a little mini-event just after New Jersey also.
Section: 06
Population Saturation
Here are figures revealing how many people in each population base represent one
case. I'm also showing what percent of each population base is infected at this
time.
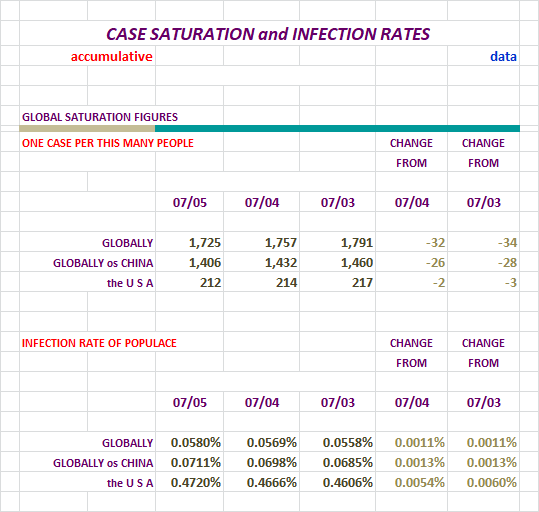
We're still slipping here, and I'm looking forward to better numbers.
Nations With Lots of Cases
At the end of the day yesterday, there were:
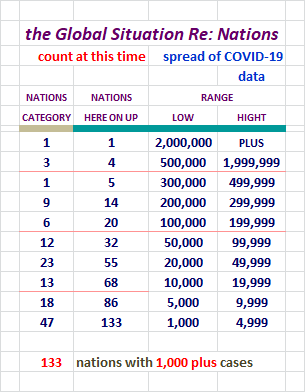
It's hard to belive there are that many nations with massive numbers.
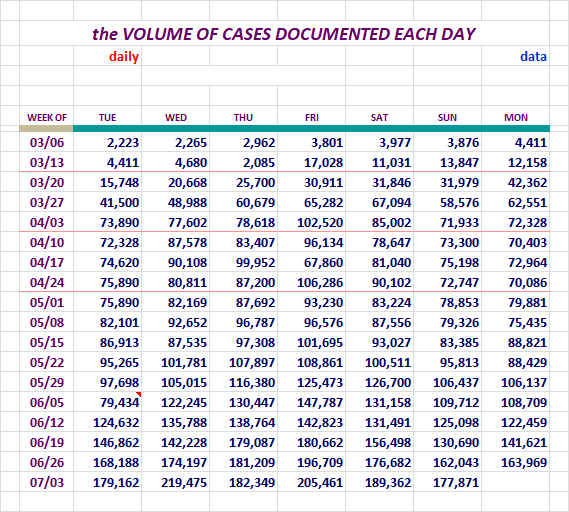
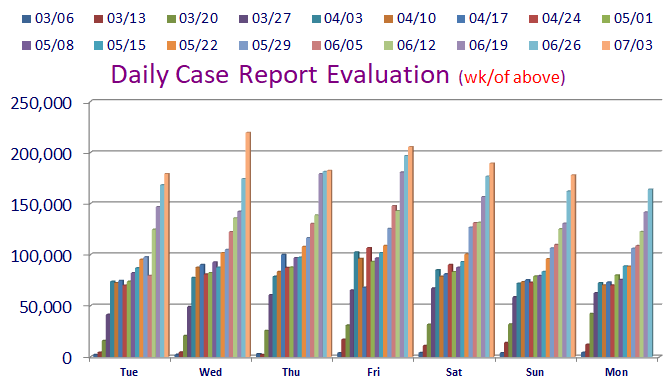
Daily Case Report Evaluation
I'll be keeping tabs on the daily tallies for days of the week for a while. Folks have
noticed some patterns of larger and smaller data entry on certain days, and on Fridays
sometimes the numbers get noticeably larger because of it.
And we now know Thursdays have potential to break out also. Yikes!
IMO Let's check out the numbers and a chart.
Those numbers are pretty impressive, but if Fatalities remain low, the Herd
Immunity folks will score points. Let's see how it goes.
Note that these new daily records this week, with the exception of Wednesday's
numbers, are barely outpacing the previous week. Looking at that chart, I think
it's clear that is a big change from one to two weeks ago.
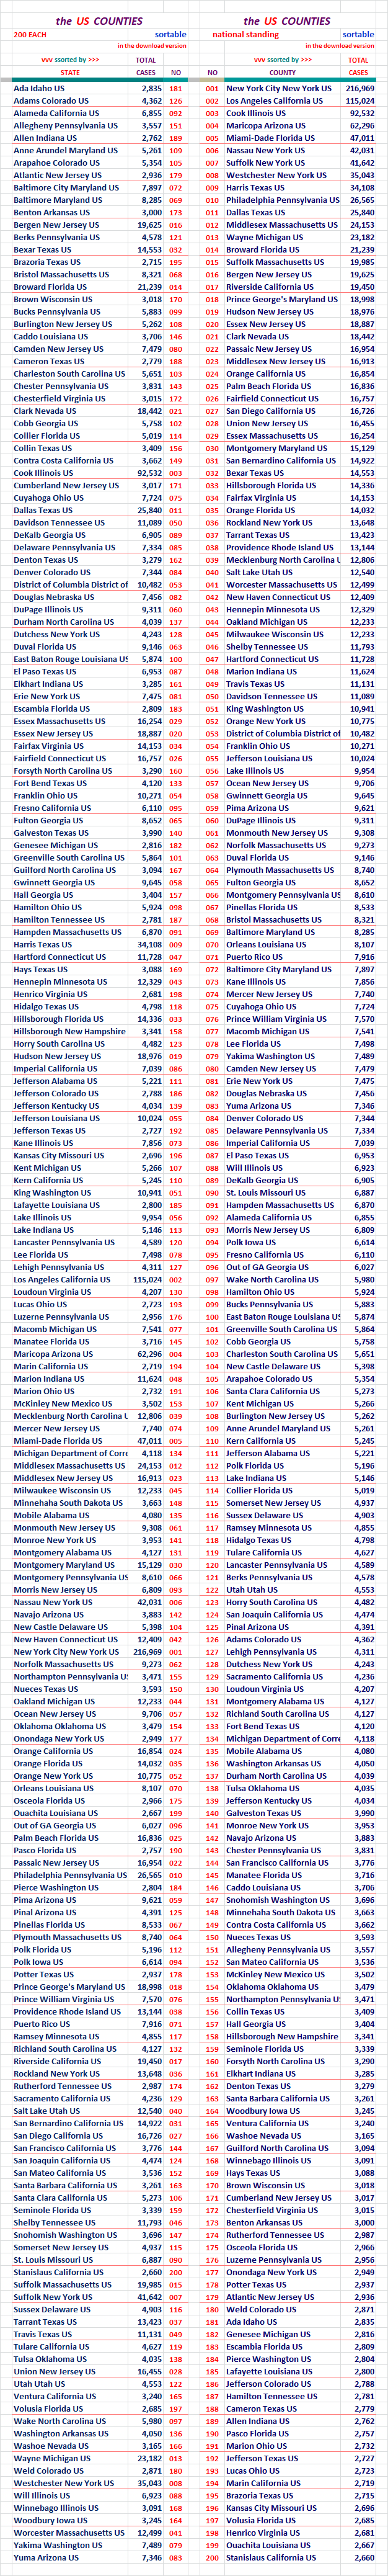
Section: 07
The Top 200 Counties in the U. S., by Number of Cases
This little report lists 200 Counties in the United States in declining Case numbers.
There is also a listing that is alphabetical. This report list only the entities
and the number of Cases in the two different sorts.
It will also be available as a downloadable Excel file in Section 12.
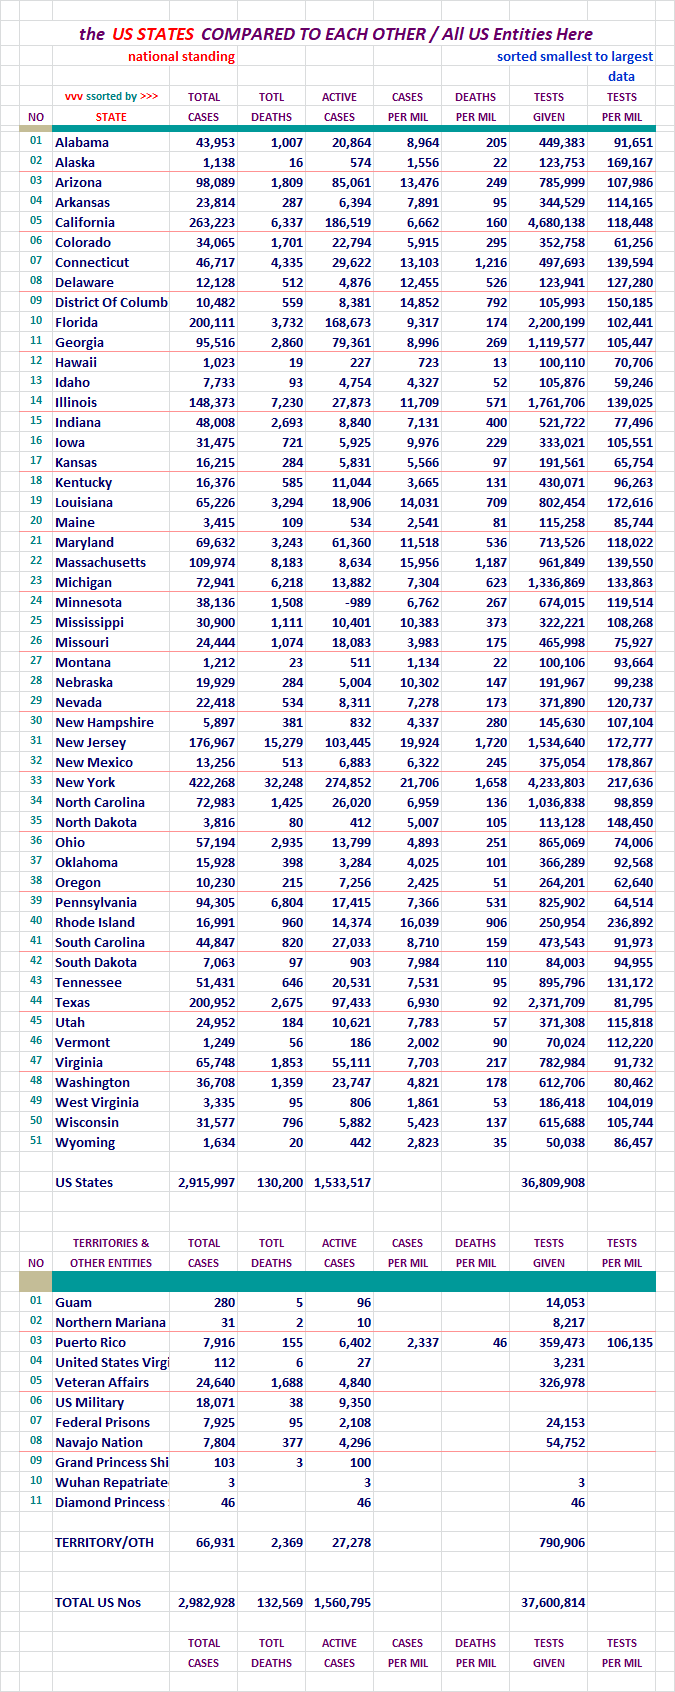
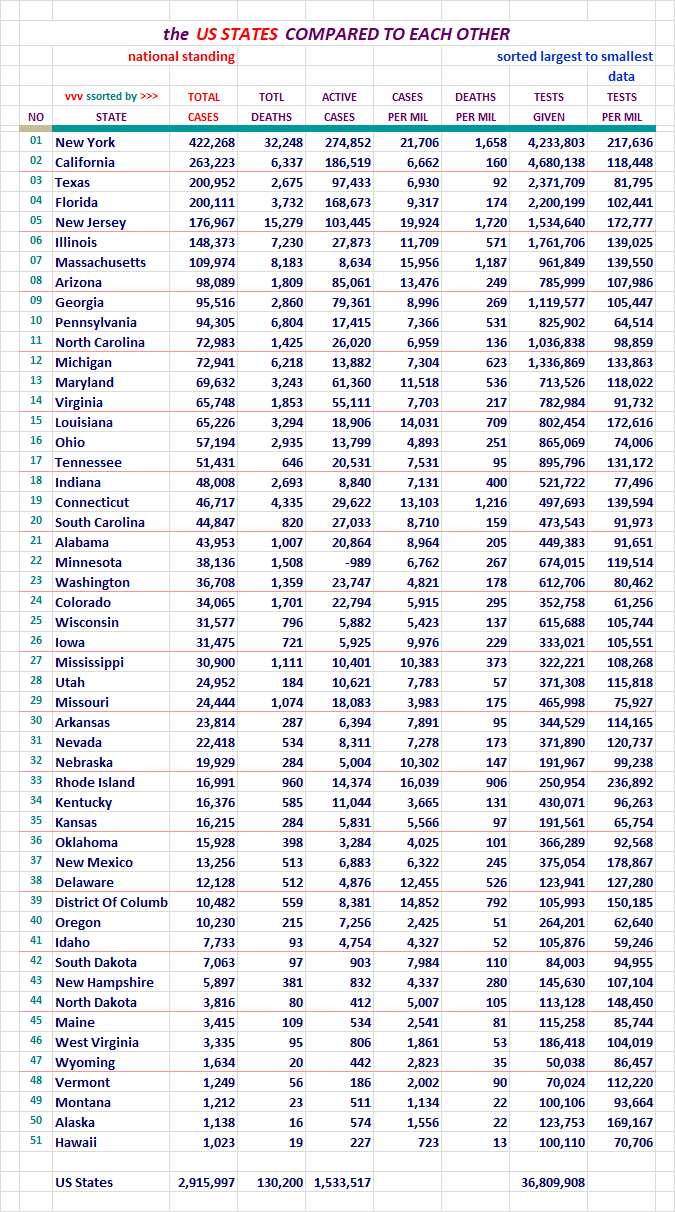
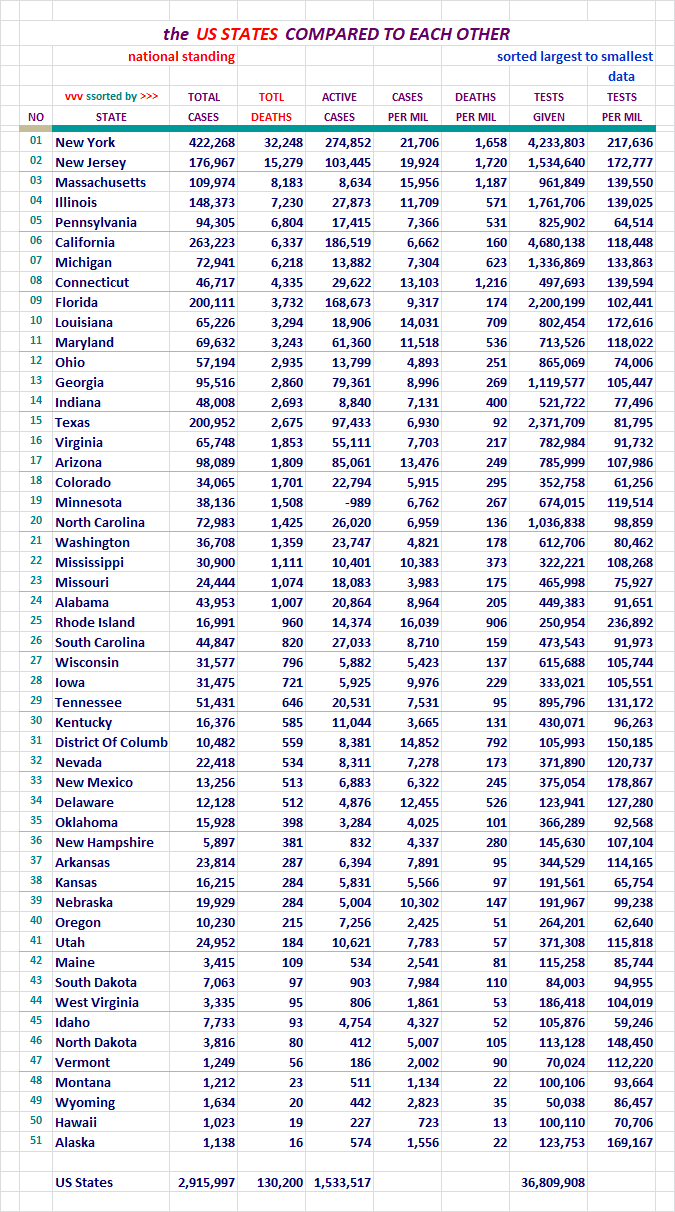
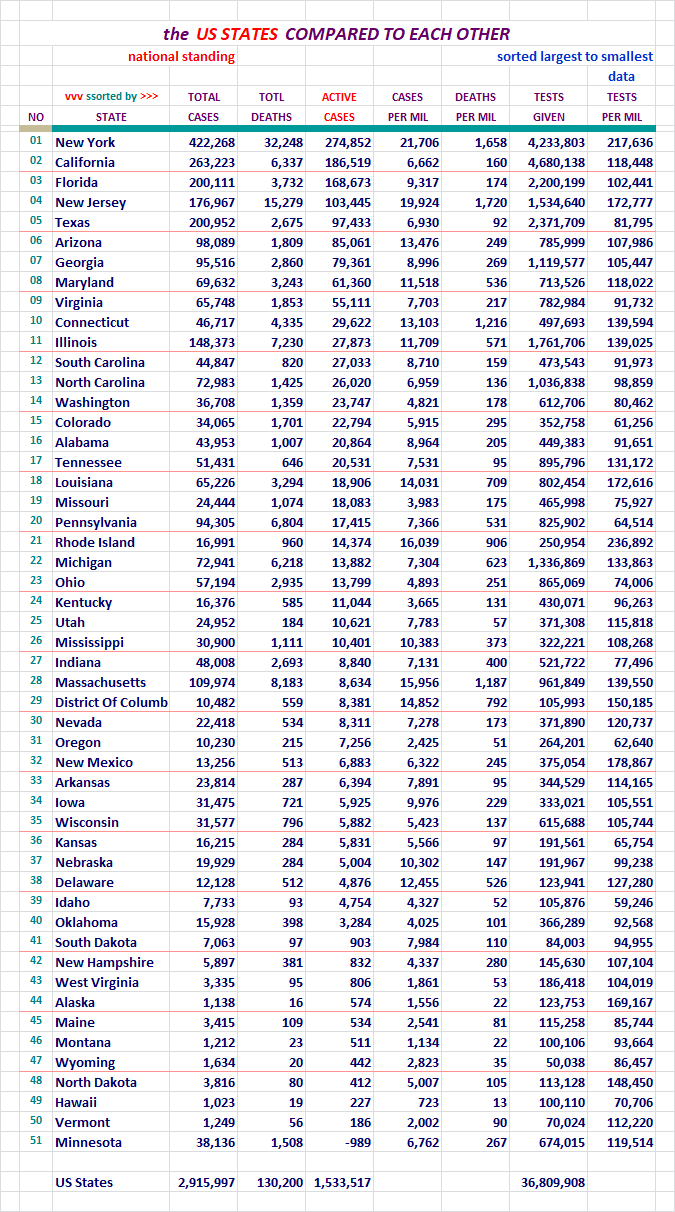
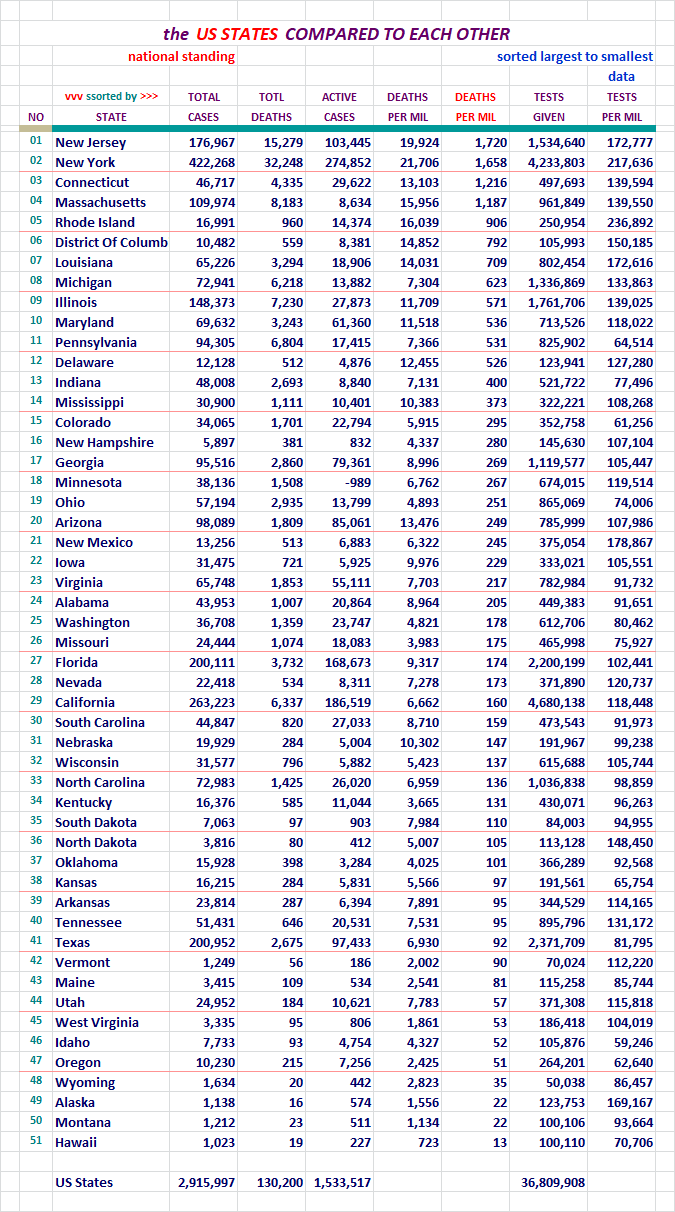
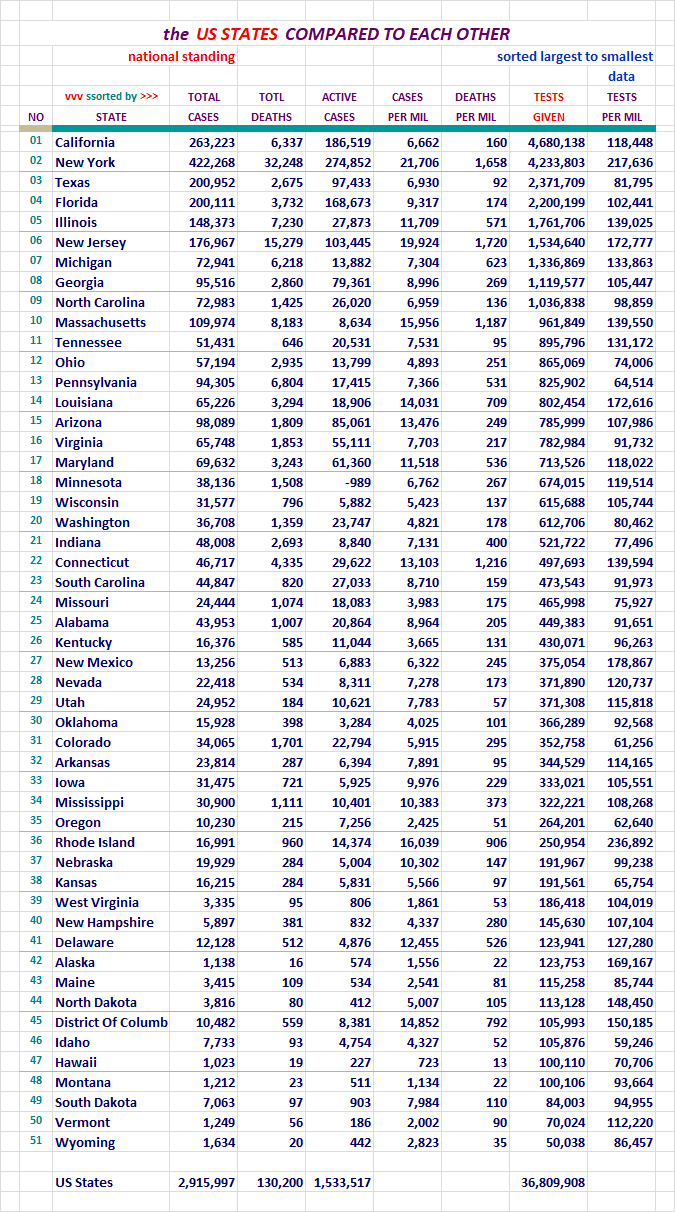
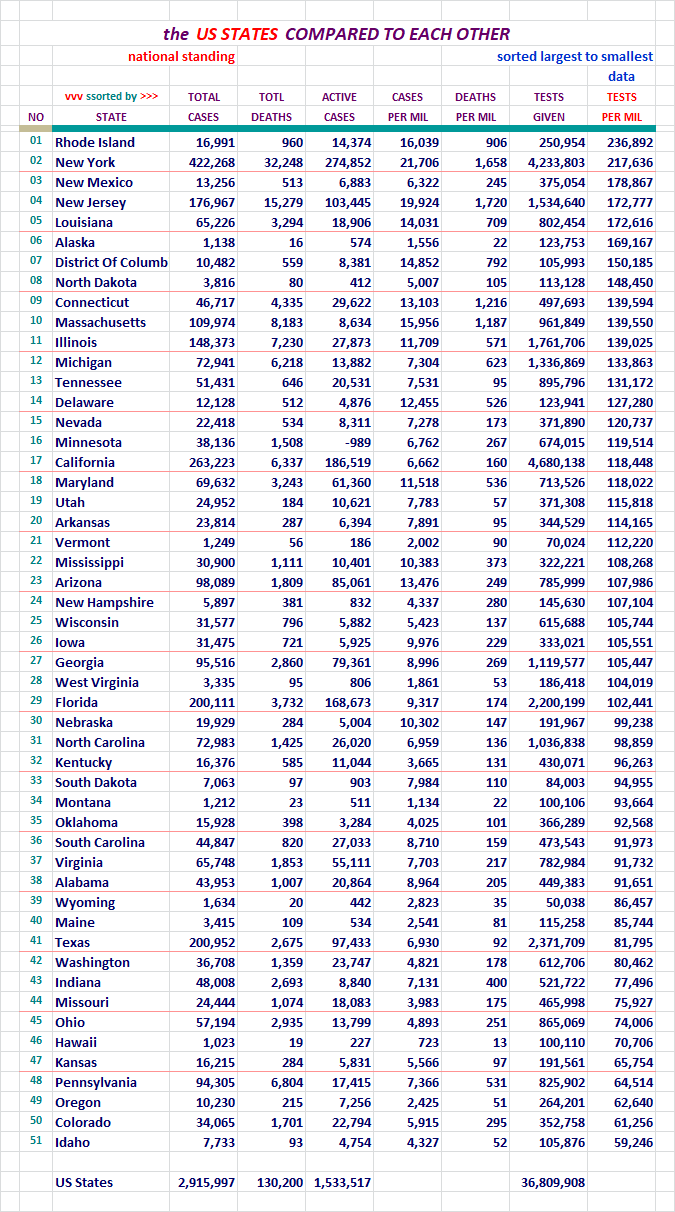
Section: 08
States of the Union and the District of Columbia, Compared to Each Other
Each of these pages is sorted differently. Look at the red header above
the columns to see which column was used for the sort on any given page.
For your review...
For your review...
For your review...
For your review...

For your review...
For your review...
For your review...
For your review...
For your review...
If this area interests you, please use this LINK to the source, and review
the lengthy description and explanation of it's development process.
There are two reports. The presentation above comes from the second one,
and the detailed segmented information below it, may interest you.
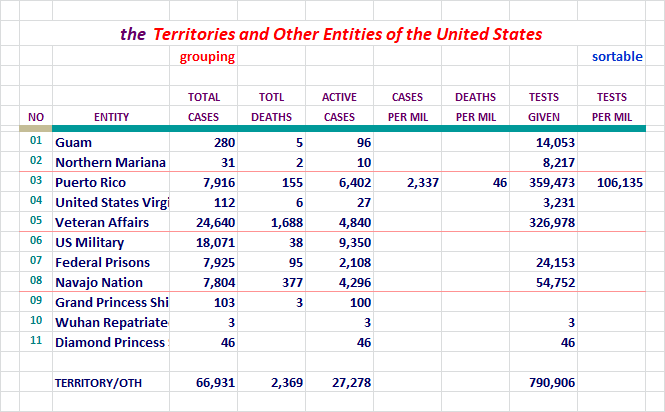
These can now also be found under the states on the Alphabetical list. The
states and these entity's numbers should be combined to match that of the
U. S. figures each day.
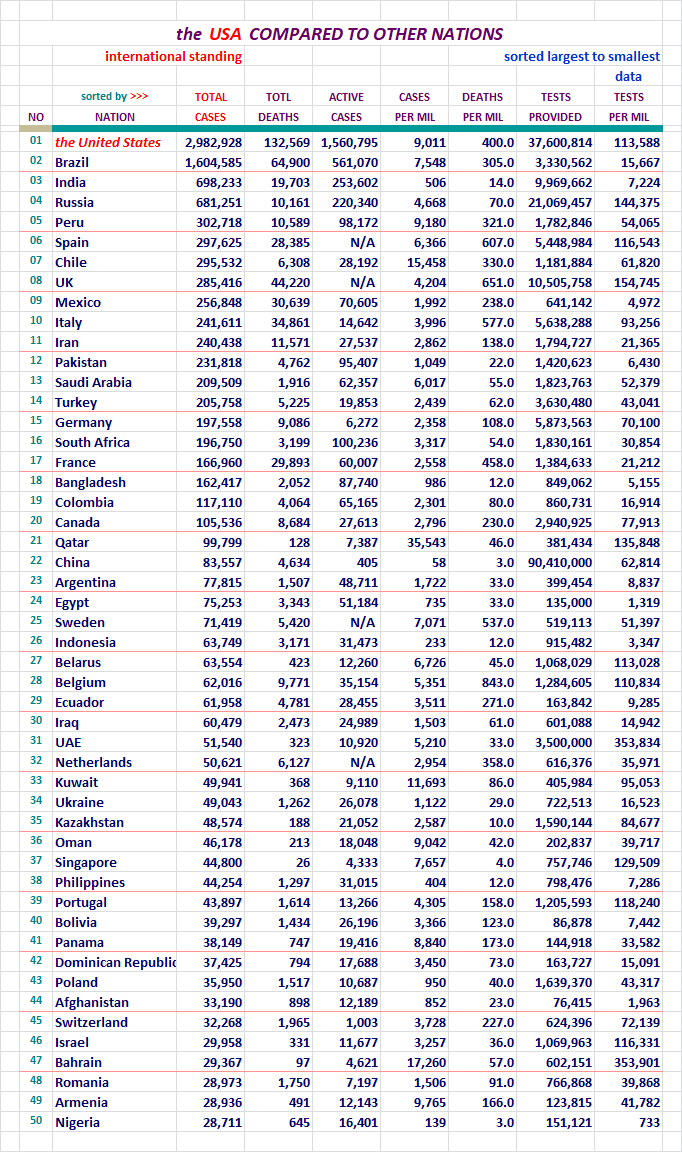
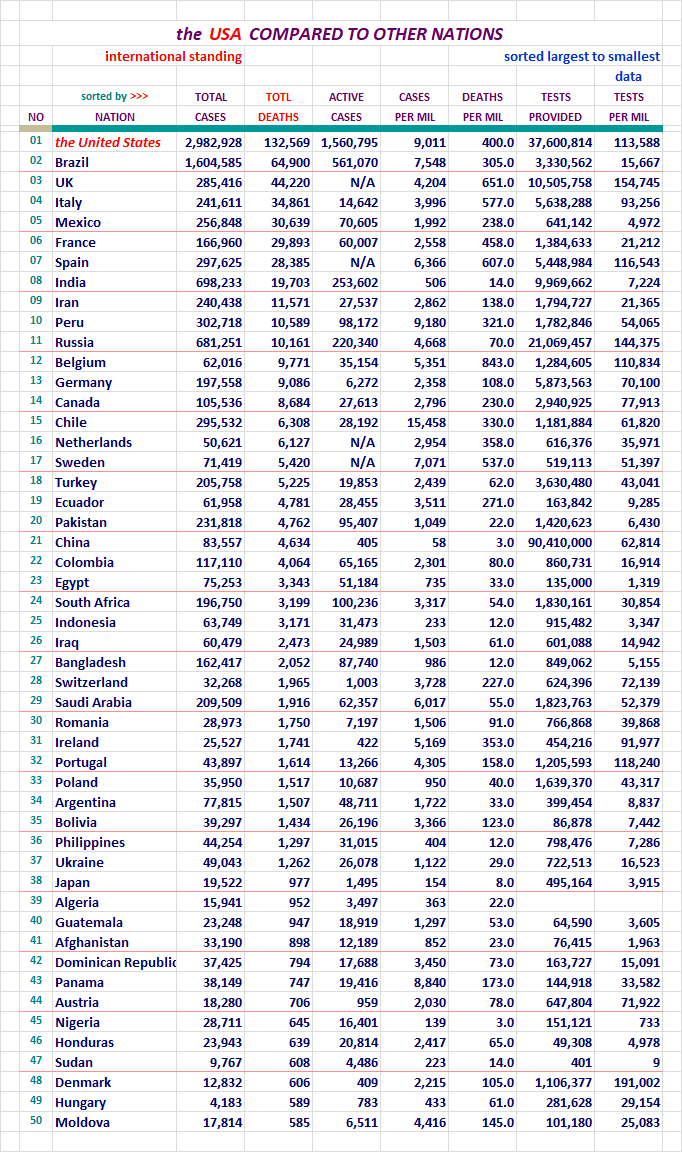
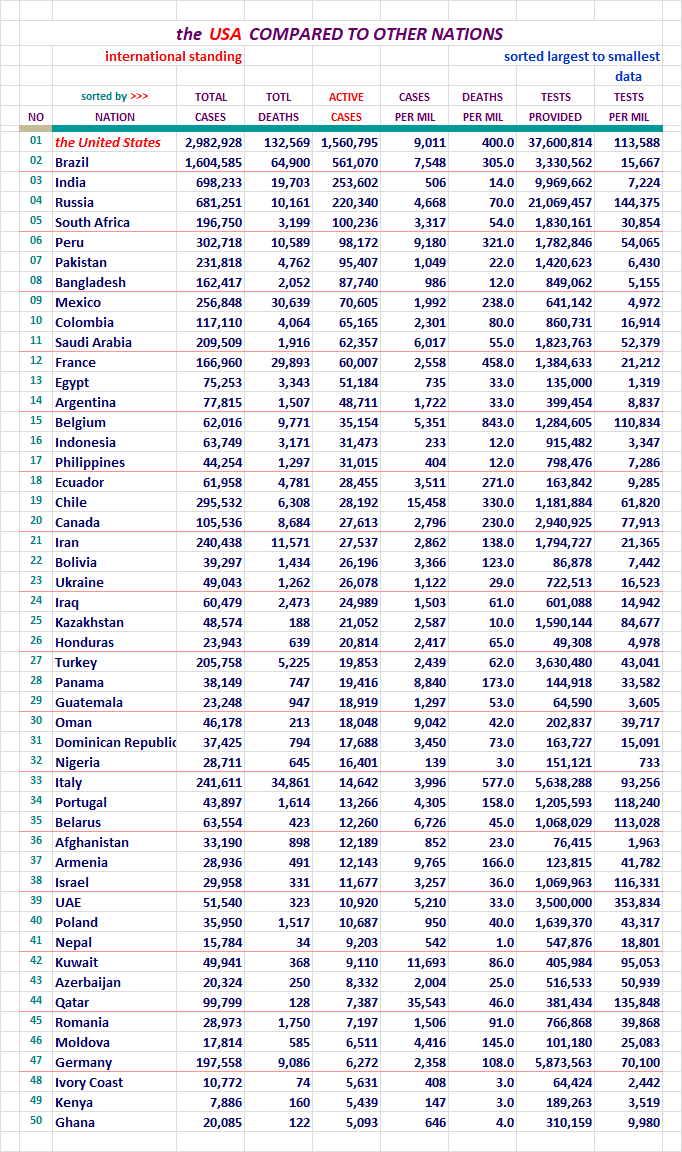
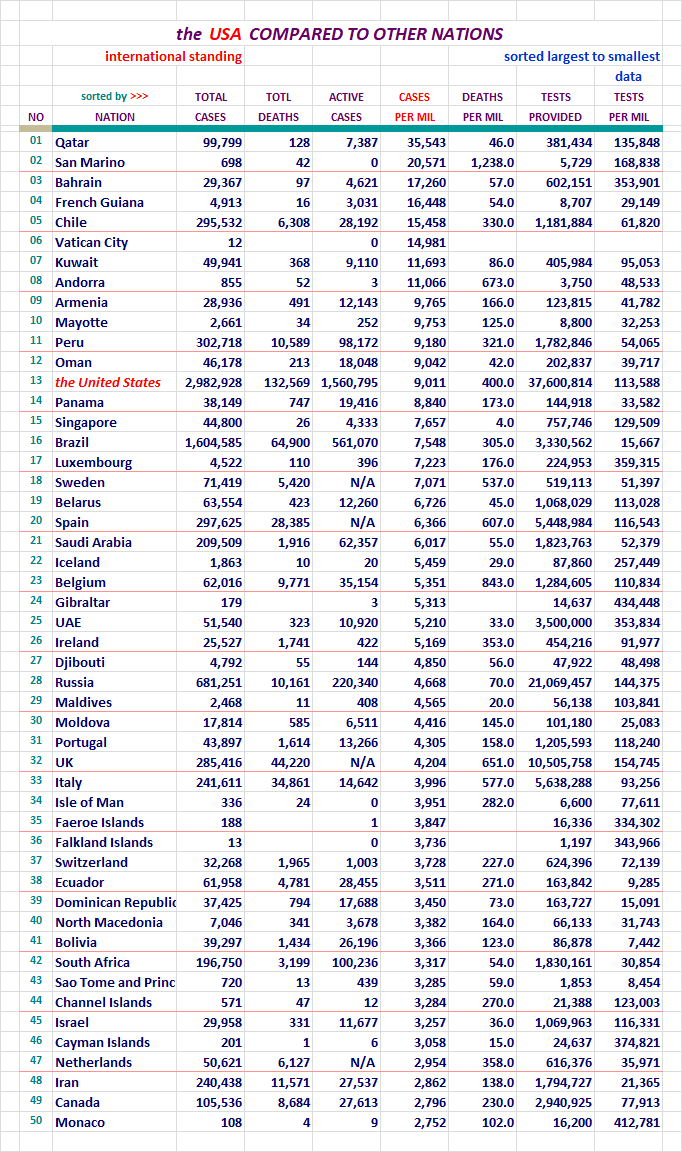
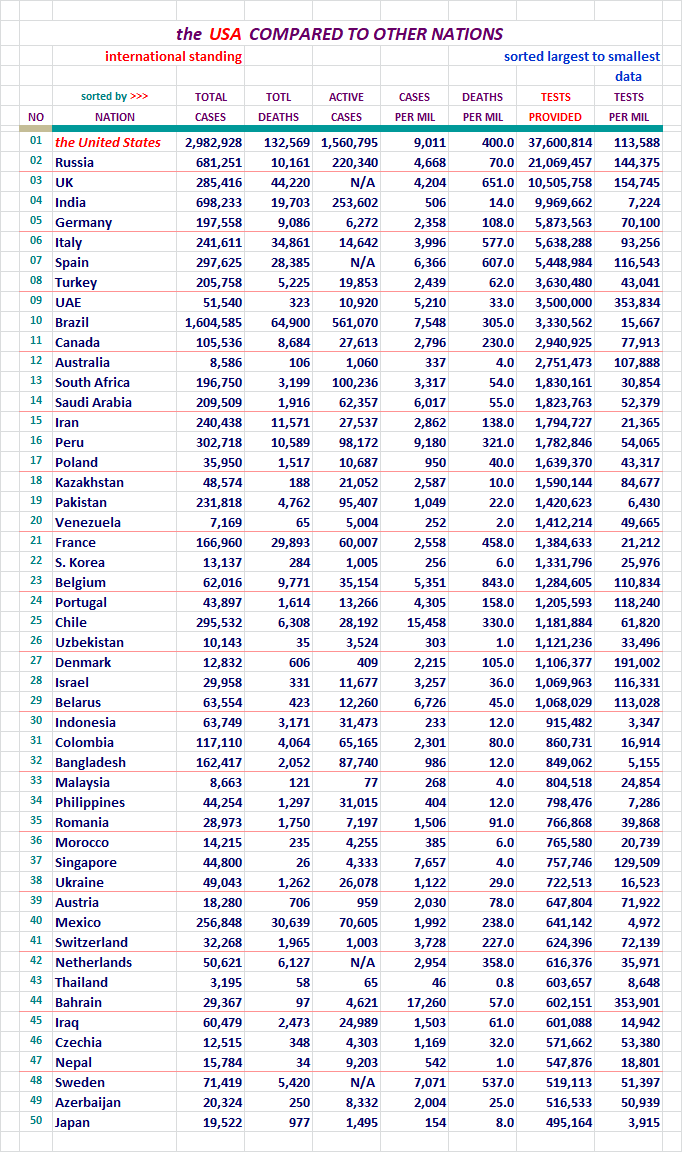
Section: 09
The United States, Where it Ranks With Other Nations?
Each of these pages is sorted differently. Look at the red header above
the columns to see which column was used for the sort on any given page.
The U. S. will be highlighted red here so we can find it easily in the list.
There was 215 nations on this list last night now. I didn't want to post
seven lists with 215 nations on it, so I picked the top 50. Coincidentally,
one report category had the U. S. at 41st, so it wasn't showing up on the
list with the 31 top nations on it. That wasn't the reason why I extended the
list length, but it did work out well.
I work on the nations right next to the states on my spreadsheet. The
states with the District of Columbia come in at a total of 51 lines.
I decided to keep the international reports near that length, and 50
was good enough.
Here we go... for your review.
For your review...
For your review...
For your review...
For your review...

For your review...
For your review...
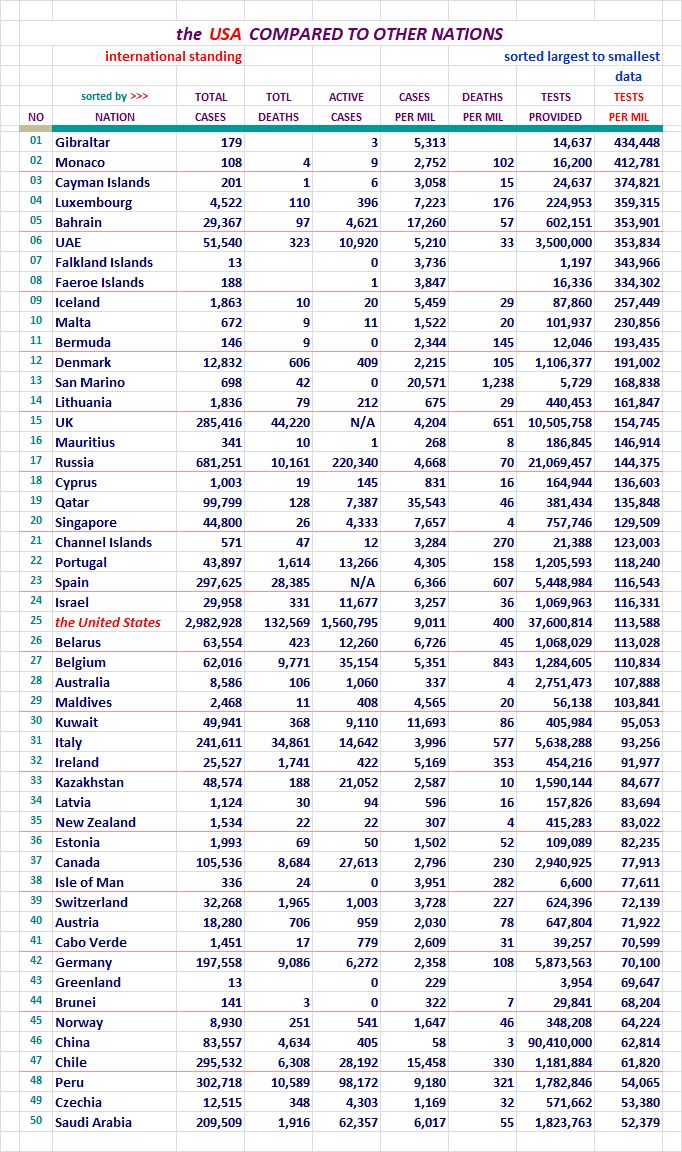
We cam in 25th on the Testing per million scale yesterday. That's our lowest
standing yet.
Progress...
Section: 10
Here is what it is all about. From January 20th to the present.
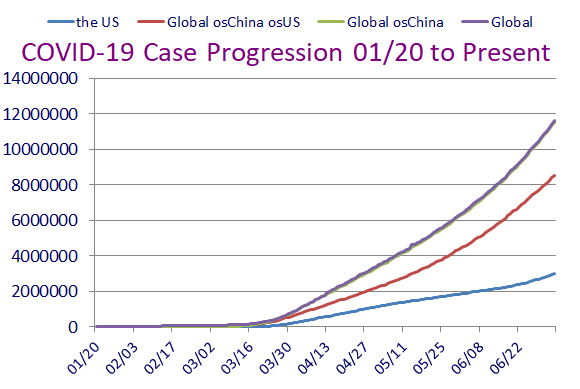
This concludes our look back at yesterday's data. Take care...

Section: 11
Data for this Report Sourced From:
LINK WorldoMeters
LINK Johns Hopkins University
The Center for Systems Science and Engineering (CSSE)
LINK United States Center for Disease Control - Provisional Numbers
Listed in the order of current utilization...
LINK You are Invited to Review My COVID-19 Spreadsheet (XLSX)
There is not an XLS version available for distribution at this time.
Section: 12
Other Features:
LINK US Counties200, States & DC51, Territories & Other Entities11, Nations214,
and the CDC Provisional Counts53
Five Excel Spreadsheet datasets you can sort for your own studies...
Section: 13
Links to other resources:
I cannot vouch for these sites. Please use your own judgement.
LINK Adventist Health Coronavirus Resource Hub - Scroll down for useful info
LINK Antibiotic Vitamin, the (Vitamin D)
Good article on Vitamin D's likely role in prevention of infection. Thanks Blam.
LINK CDC Data for Download - Scroll down - Excel required. Includes death stats.
LINK CDC National Center for Health Services
Provisional deaths as determined by review of vital documents. Much lower...
LINK CDC Secondary Data and Statistics - Portal Entry / Look around
LINK Coronavirus (COVID-19) Map
LINK Coronavirus infection risk may be reduced by Vitamin D
by Former CDC Chief Dr. Tom Frieden
LINK Coronavirus Spread Quickly Around the World in Late 2019, Study Shows
the University College London Genetics Institute
LINK COVID-19 Deaths Broken Out by Thirds, 05/07/20 Map of US Counties
Very revealing display of Concentrated Death Zones - thanks hoosiermama
LINK COVID-19 First U.S. Case, Treatment, features Remdesivir
New England Journal of Medicine article
LINK Cytokine Storm, med Actemra, Physician near death saved
LINK Diamond Princess Review at 634 Case Point of Eventual 712
LINK Hydroxychloroquine Article: International Poll
Daily Mail Reports, Most Effective Treatment According to 6,000 Physicians
LINK Hydroxychloroquine Has about 90 Percent Chance of Helping COVID-19 Patients
the Association of American Physicians and Surgeons, reports 91.6% of patients improved clinically
LINK IHME - Institute for Health Matrix and Evaluation
LINK National Institutes of Health - Cornavirus (COVID-19)
LINK Nasal Irrigation is the Key, COVID-19 Related
LINK New York City - interesting breakdown, borough, age, sex
LINK On the Origin of CCP Virus, A Documentary Movie (turn up the sound)
Epoch Times: I highly recommend this very well documented report.
LINK Rt COVID-19
Calculates and displays the Rt Factor for each state. Thanks FreedomPoster.
LINK World Health Organization

I started tracking the number of new hospitalizations of COVID patients in Florida.
Jul 2 = 341
Jul 3 = 244
Jul 4 = 160
Jul 5 = 150
Even though we have had record numbers of new COVID cases in Florida for over two weeks, we are not seeing any sort of increase in hospitalizations for COVID infected patients.
I will continue tracking the COVID hospitalization numbers to see if there are any changes.
If other states are reporting covid hospitalizations, it would be good to post the data from those states.
Here is the link to the source document:
http://ww11.doh.state.fl.us/comm/_partners/covid19_report_archive/state_reports_latest.pdf
Looks like tomorrow’s report will have the total US cases going over THREE MILLION. Look for the mainstream media and the DemocRATS to put their mouths and propaganda production into overdrive.
I agree.
All we can do is remind our family and friends that the
fatalities are very low right now.
Misc. numbers derived from WOM data (if I figured correctly):
11.54 % of US population tested
7.96 % infected
Of those who tested positive:
4.37 % perished
43.14 % recovered
53.49 % condition unkown
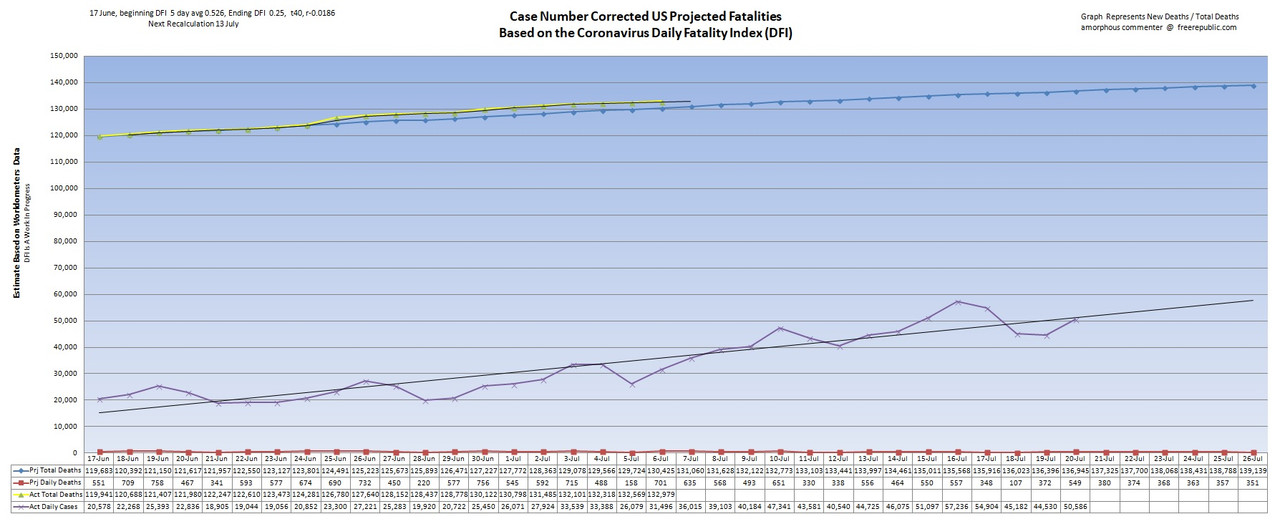
•Blue line represents projected death totals.
•Yellow line is actual death totals based on WorldofMeters.info data.
•Purple line is actual case numbers offset by 14 days.
•Red line represents projected daily deaths.
•Black extension lines are trend lines.
Thank you, DoughtyOne!
Is there a category for Active/Critical for the US?
I suppose this thread would be a good place to ask:
Presently, what is the risk of, if infected, a serious COVID-19 illness or complications for a US resident of AVERAGE* health, age 60 or older?
Presently, what is the risk of, if infected, a fatal COVID-19 illness or complications for a US resident of AVERAGE* health, age 60 or older?
*I think this means at LEAST one comorbidity, with this disease.
"Crunch Time" Arrives And... Was Everyone Wrong About The Coronavirus?
...
Conclusion: The overall mortality rate as measured by weekly deaths/ weekly new cases (2 weeks lead) is about 1/3rd of the level observed in the second half of April.
Analysis: We calculate (1) the hospitalization rate as currently hospitalized (weekly average) / new cases (weekly sum, 1 week lead) and (2) the hospitalization mortality rate as Deaths (weekly sum) /currently hospitalized (weekly average, 1 week lead). The latter is a normalization of last week's calculation from daily deaths to weekly deaths. We focus on weekly averages and weekly lags as the time spent in hospital is about 1 week and to smooth the volatility due to week-end effects.
Results:
The hospitalization rate has declined to ~20% by 10-15pp since the second half of April. This may be due to (a) increased testing and better quality of the tests capturing milder cases and (b) self-selection of the population taking risks (e.g. average age of new cases declining)
The hospitalization mortality rate halved to ~10% (last week's results scaled from daily to weekly deaths) since the second half of April.
The overall mortality rate (deaths over lagged new cases) is the product of the previous two calculations. Since the second half of April, it has declined by about 2/3rd from 6.5% to 2%.
For the three largest states with hospitalization data CA/NY/TX, the respective current levels are as follows. Hospitalization rate: 18.1%, 18.7%, 19.4%. Hospitalization mortality rate: 7.8%, 6.9%, 5.2%. Overall mortality rate: 1.7%, 1.5%, 1.0%.
https://www.zerohedge.com/markets/crunch-time-arrives-and-was-everyone-wrong-about-coronavirus
“””*I think this means at LEAST one comorbidity, with this disease.”””
A few days ago I spent far too much time searching through the CDC sites to find information on comorbidities associated with covid deaths.
What seems so simple for the CDC to compile, seems to be intentionally or unintentionally hidden from the public.
But then, we have to remember this is a government agency and if they haven’t spent $millions to develop a new computer program, then why should we expect some CDC worker to simply download data to an excel spreadsheet.
It would be good for the public to know for each age group what were the comorbidities associated with covid that caused a person to die.
Such a spreadsheet is not all that complicated. After all, at this point, there are only 130,000 people who have been declared as dying from covid.
Pretty slick, Slick. LOL
Disclaimer: Opinions posted on Free Republic are those of the individual posters and do not necessarily represent the opinion of Free Republic or its management. All materials posted herein are protected by copyright law and the exemption for fair use of copyrighted works.