That graph is suspect.
I own zero stocks. Yet my portfolio in a 401(k) is over a million in stocks.
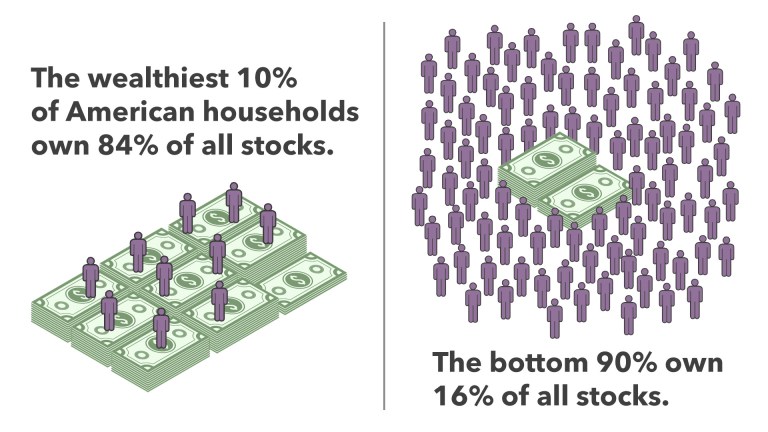
Just another divisive rich vs poor argument. 85% of stocks owned by US individuals are in retirement accounts. Sure, rich people have bigger retirement accounts than poor people. But many middle class people that have the option to invest, don’t. A very large portion of young people who have the option to invest in stock based retirement accounts either invest very little, or none at all. Almost 50% of Americans don’t own stocks, but that doesn’t mean they can’t afford them. You can’t force free people to buy stocks. Also, some stock funded retirement funds that support DEFINED BENEFIT PENSIONS, for cops, firefighters, teachers, etc, are not owned by individual retirees, but by institutions. Not only does the graph not appear to consider this, but it ignores stock ownership by other institutions like non-profits, insurance companies and banks. It also appears to ignore foreign investors, who own about 25% of our stocks.
All that statistics means is only 10% of the population is brainy.
A more important split is how much is owned by institutional money managers vs owned by individuals. In Aug 2017: “Institutions own about 78% of the market value of the U.S. broad-market Russell 3000 index, and 80% of the large-cap S&P 500 index. In dollars, that is about $21.7 trillion and $18 trillion, respectively.“