To: Sgt_Schultze
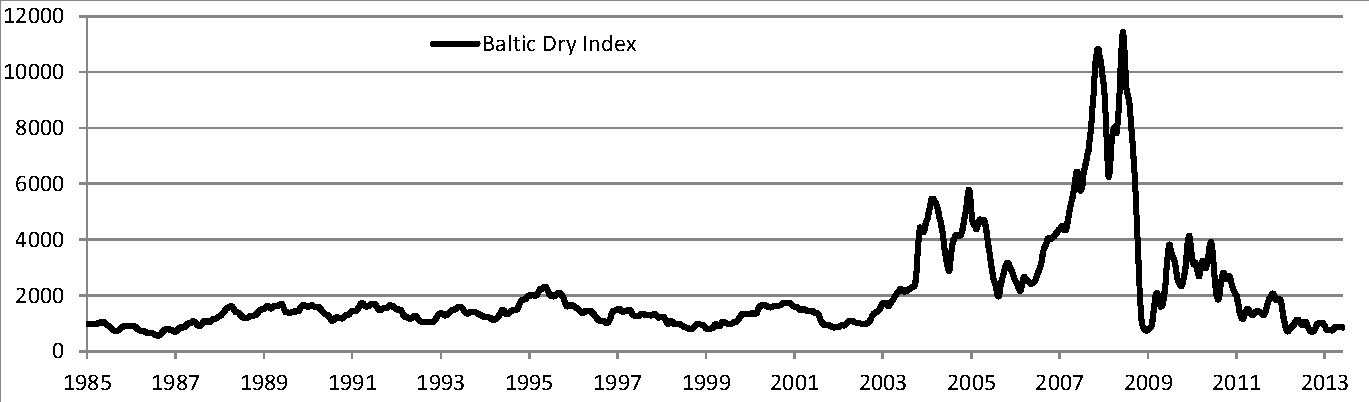
Baltic Dry Index chart 1985 thru 2013 I don't pretend to understand the BDI, but doesn't this chart show an up spike to around 11,000 just prior to plummeting in late 2008? Where's that canary?
12 posted on
01/21/2016 8:30:33 AM PST by
Leroy S. Mort
(The further a society drifts from truth the more it will hate those who speak it ~ G Orwell)
To: Leroy S. Mort
Yes, because it follows energy prices and those peaked in early 2008.
50 posted on
01/21/2016 12:15:54 PM PST by
palmer
(Net "neutrality" = Obama turning the internet over to foreign enemies)
FreeRepublic.com is powered by software copyright 2000-2008 John Robinson