Posted on 12/09/2009 11:17:57 AM PST by Ernest_at_the_Beach
If there was enough money, fame and power on the table (think seismic proportions, money that moves the economic landscape), would it be possible to take a small unproven scientific theory as an excuse and, with the best PR teams in the world, promote it, support it, and make it appear unquestionable?
If it were cloaked in the most “innocent” of motives, and shrouded in terminology that veils the truth, would it not run unchecked for years, unless some big vested interest opposed it? And if there was no particular big vested interest to oppose it, isn’t it possible that if the only harm it causes is to the giant disorganized mass known as humankind, there would be no committee of humankind to check its momentum.
On Watts Up tonight, we get some insight into just one specific example of how corrupt science can be. It’s yet another day in the history of the climate-scam where people may say years from now… remember that night we got the news about Darwin? Thanks to Willis Eschenbach’s dedicated analysis.
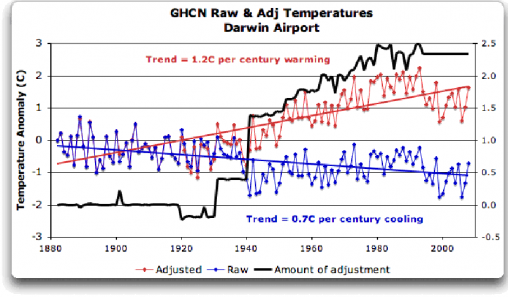
The blue line is the raw unadjusted data from Darwin. There are five stations there and their records are a very tight fit. It’s unusual for all five stations to agree with each other. Yet one of the three top climate centres in the world has “adjusted the data” using corrections that are graphed in black. (More artificial adjustments?) The raw data shows a trend down of 0.7 degrees C per century. After adjustment, the data “shows” a trend up of 1.2 degrees warming per century. It’s the scale of this shift that is so brazen. We’re supposed to be looking for a rise of one fifth of a degree per decade, and that statistical adjustment gave us half that rise.
If Darwin had some freak local conditions, then we would expect to see the raw data in graphs from other top-end towns as trending much higher. Here are the graphs for Wyndham, Derby, Halls Creek and Broome. The graphs are from WA Climate Net, an excellent data set. Direct, Broome is 1100 km from Darwin, or 690 miles. (By road, it’s 1876 km from Darwin). (Thanks to MapCrow for the distances). I thought I would post these graphs to give people a rough idea of the historical warming across the far tropical north of Australia.
The Evolution of the Global Temperature Record ( Skullduggery with Darwin, Australia records)
So let's do the math:
CRU -- fraudulent data.
GHCN -- fraudulent data.
NASA/GISS? Stonewalling on the release of its codes and data even after numerous Freedom of Information requests.
Can the corruption get any more evident?
***********************************
Smoking Guns Across Australia: Where’s the warming? Looking at 16 other locations.
fyi
Didn’t NASA miss sea ice the size of California because of a “faulty” sensor???

which is essentially a fudge factor and Figure 7 from the link given:
The shape, time scale and magnitude are all similar
Additional games in Copenhagen today:
COP15 Proposals – summary from Americans for Prosperity simulcast from Copenhagen today (http://www.americansforprosperity.org/national-site)
COP15 Proposals:
- Western Economic Tax of 2% of GDP
- Removal of IP/Patent Rights for New Technologies in Clean Technology
- US Constitution is “only paper”, so “Copenhagen Treaty” as been renamed an “Executive Agreement” so Zero can sign it shortly without Senate approval
- Words relating to creation of a “worldwide government” have been dropped from the “Treaty”; but there are 700 new global government entities created
- The “Treaty” contains extensive, significant details (currently not being reported) on establishment of worldwide government
- Extensive political agenda of the COP15 meeting is being largely unreported
Thanks,...that is very interesting.
But they were only off by 193,000 square miles! LOL!
Man oh Man....thanks....

Was just looking at this website ....
One of the official supporters of all of this crooked business:
Dr Peter Stott
Climate Monitoring Expert
Global-average temperature records are vital to help understand how our climate is changing. Here Dr Peter Stott explains how these records are made.
To understand changes and variations in our climate it is essential to know how the surface temperature changes — from month to month, up to decade to decade. Global-average temperature records provide this vital information.
From these records we can see how warm specific months, years or decades are, and we can discern trends in our climate over longer periods of time. Global records go back about 160 years, giving a long period from which to draw conclusions about how our climate is changing.
There are three centres which calculate global-average temperature each month.
These work independently and use different methods in the way they collect and process data to calculate the global-average temperature. Despite this, the results of each are similar from month to month and year to year, and there is definite agreement on temperature trends from decade to decade (Figure 1). Most importantly, they all agree global-average temperature has increased over the past century and this warming has been particularly rapid since the 1970s.

Tens of thousands of temperature observations are taken across the globe, on land and at sea, each day. Land stations use these daily readings to create a monthly average (see boxed text), which is then sent off for use by climate researchers. Individual ship and buoy observations are transmitted on the Global Telecommunication System. These figures are checked before they are used to calculate the global-average temperature.
The monthly updates are combined with archives of historical observations that have been gathered over the past 160 years. The historical data are adjusted to minimise the effects of changes in the way measurements were made.
Each of the three global temperature centres uses different observation sets, although there are large overlaps in the information used. Each centre also has its own methods for checking and processing data, as well as for making the final calculation.
The HadCRUT3 record, which is produced by the Met Office in collaboration with the Climatic Research Unit, takes in observations from about 2,000 land stations each month. The figures for each one are checked both by computer and manually to find and remove any problems. Sea-surface temperature observations come from about 1,200 drifting buoys deployed across the world's oceans and around 4,000 ships in the Voluntary Observing Ship programme. There are also numerous moored buoys in the tropics and in coastal regions, principally around the US. Together they take around 1.5 million observations each month. These are checked by computer and any obviously inaccurate readings are excluded.
For all three global average temperature records, the 2009 value is based on data from January to October only.
NCDC dataset: Smith, T. M., et al. (2008), Improvements to NOAA's Historical Merged Land-Ocean Surface Temperature Analysis (1880-2006), J. Climate, 21, 2283-2293. NCDC data are available online.
GISS dataset: Hansen, J., R. Ruedy, M. Sato, M. Imhoff, W. Lawrence, D. Easterling, T. Peterson, and T. Karl, 2001: A closer look at United States and global surface temperature change. J. Geophys. Res. 106, 23947-23963. GISS data are available online.
Absolute temperatures are not used directly to calculate the global-average temperature. They are first converted into ‘anomalies’, which are the difference in temperature from the ‘normal’ level. The normal level is calculated for each observation location by taking the long-term average for that area over a base period. For HadCRUT3, this is 1961–1990.
For example, if the 1961–1990 average September temperature for Edinburgh in Scotland is 12 °C and the recorded average temperature for that month in 2009 is 13 °C, the difference of 1 °C is the anomaly and this would be used in the calculation of the global average.
One of the main reasons for using anomalies is that they remain fairly constant over large areas. So, for example, an anomaly in Edinburgh is likely to be the same as the anomaly further north in Fort William and at the top of Ben Nevis, the UK’s highest mountain. This is even though there may be large differences in absolute temperature at each of these locations.
The anomaly method also helps to avoid biases. For example, if actual temperatures were used and information from an Arctic observation station was missing for that month, it would mean the global temperature record would seem warmer. Using anomalies means missing data such as this will not bias the temperature record.
Firstly, great care is taken to ensure the observations that form the basis for a global-average temperature are accurate. Each observation station follows international standards for taking observations set out by the World Meteorological Organization.
Each national met service provides information about how its data are collected and processed, thus helping to ensure consistency. This includes recording information about the local environment around the observation station and any changes to that environment. This is important as it can affect temperature measurements. For example, new buildings near an observation station can increase the night-time temperature readings.
While every effort is made to detect and remove errors in the data, scientists accept there will inevitably be some uncertainty in collecting so much information. There are additional uncertainties because temperatures over large areas of the earth are not observed as a matter of routine. Efforts are made to take these into account by factoring the uncertainty into global-average temperature calculations, which means we end up with a temperature range rather than one definite figure (Figure 1). Importantly, even with the temperature ranges, the global warming observed over the past century far outstrips the uncertainties.
The three independent global-average temperature records show that there has been warming in the Earth’s climate since pre-industrial times. The warming has been particularly rapid since the 1970s. The records also clearly show each decade since the 1970s has been successively warmer than the last, including the decade since 2000. Changes in temperature observed in surface data records are corroborated by measurements of temperatures below the surface of the ocean, by records of temperatures in the troposphere recorded by satellites and weather balloons, in independent records of air temperatures measured over the oceans and by records of sea-surface temperatures measured by satellites. Indirect evidence of warming can be seen in the reductions in Arctic sea-ice, sea-level rise, reduction in glacier volume and in phenological records, for example the dates on which leaves, flowers and migratory birds appear.
****************************************************************

Titled as Correlation between the three global-average temperature records
Just proves to me they were all correlating their fudged records....
Dr Peter Stott
Not sure where Bisbane is on the map....
OBVIOUSLY that correlation deviance factor is not quite right. Such fine-tuning in order to allow world-wide relationships between varying data sets from various types of measurements in and of itself is difficult. Even more so when dealing with the difficult to understand nuances of the entire earth’s climate. For example, those most recent corrected values have not been correlated properly as they are trending cooler. ;)
Disclaimer: Opinions posted on Free Republic are those of the individual posters and do not necessarily represent the opinion of Free Republic or its management. All materials posted herein are protected by copyright law and the exemption for fair use of copyrighted works.
