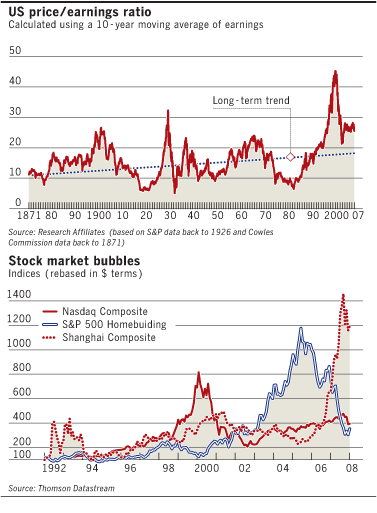
The effects of this can be seen from the valuation of stocks. For more than a century, the cyclical price/earnings ratio - where share prices are compared with average earnings over the last 10 years rather than merely the latest year - has been a reliable indicator of market cycles (see chart).
On this measure, US stocks in 2000 were far more overpriced than they had ever been. It thus correctly predicted the ensuing savage bear market. But stocks started to recover in 2003 at a point when cyclical multiples were still well above average. This was a startling deviation from the established pattern.

Being a numbers geek I found it easier to follow with the graphics that were at the original FT website article.
So what does the high long term PE mean? To me it doesn't say anything more than the fact that PE's fluctuate just like equity prices fluctuate. Duh.
For my money I'd be a lot more interested in looking at forward PE's for comparing eras...