
Posted on 11/03/2020 8:04:33 PM PST by DoughtyOne
PING LIST - Please contact me as needed...
COVID-19 Update # 230
As of 11/02/2020 23:15 PDST United States CDC - Provisional Numbers
As of 00/00/2020 23:45 PDST Johns Hopkins University - Capture Nations Informaton
As of 00/00/2020 23:45 PDST Johns Hopkins University - Capture Counties Information
As of 00/00/2020 23:46 PDST Johns Hopkins University - Process JHU Data
As of 00/00/2020 23:59 PDST WorldofMeters - Document Core Numbers
As of 00/00/2020 23:59 PDST WorldofMeters - Capture Nations Information
As of 00/00/2020 23:59 PDST WorldofMeters - Capture States Information
As of 00/00/2020 00:00 PDST WorldofMeters - Data Processing begins...
As of 00/00/2020 ??:?? PDST Publish COVID-19 Update - 00/00/00
Thank you for stopping by to check out the COVID-19 Update.
Here you can find...
Section: 01 Commentary, Special Reports, COVID-19 Update Info, & System Notes
Section: 02 the United States Situation
Section: 03 the Global Community Situation Outside China
Section: 04 the Global Community Situation Including China with reservations
Section: 05 the Mortality Report
Section: 06 Miscellaneous Reports of Interest
Section: 07 the United States, Counties (alphabetical / case no descending)
Section: 08 the United States, States Ranking, Provisional Numbers, & Territories
Section: 09 the United States, Ranked with Other Nations
Section: 10 the End of this COVID-19 Update
Section: 11 Data Sources and a Link to My Own Spreadsheet
Section: 12 Linked Spreadsheet: Counties, States, Provisional, Territories, & Nations
Section: 13 Links to Other Resources
Section: 01
Commentary, Special Reports, and COVID-19 Update Information4
Interesting Tid-bits (hopefully)
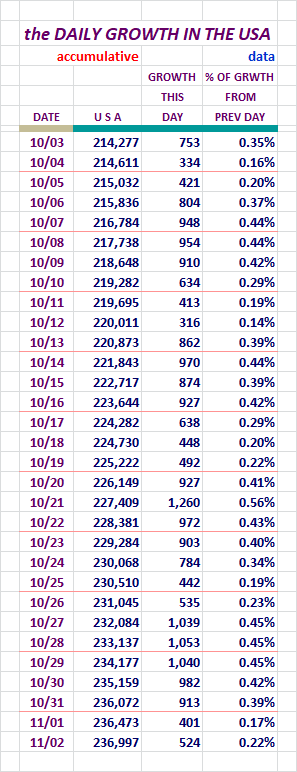
Fatalities and New Cases in the United States
Fatalities rose by 123 cases from the previous day, to come in at 524
yesterday. That was 2.06% lower than the same day the previous
week.
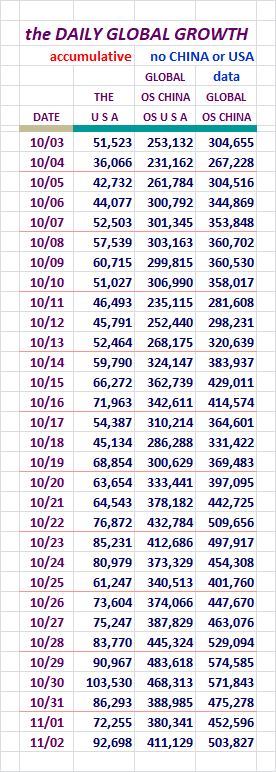
New Cases rose by 20,443 from the day before, to come in at 92,698
yesterday. That was 25.94% higher than the same day the week before.
Fatalaties and New Cases on the Global Scene
Fatalities rose by 1,030 cases from the previous day, to come in at 6,238
yesterday. That was 11.89% higher than the same day the previous week.
New Cases rose by 51,256 cases from the day before, to come in at 503,876
yesterday. This was 12.55% higher than the same day the week before.
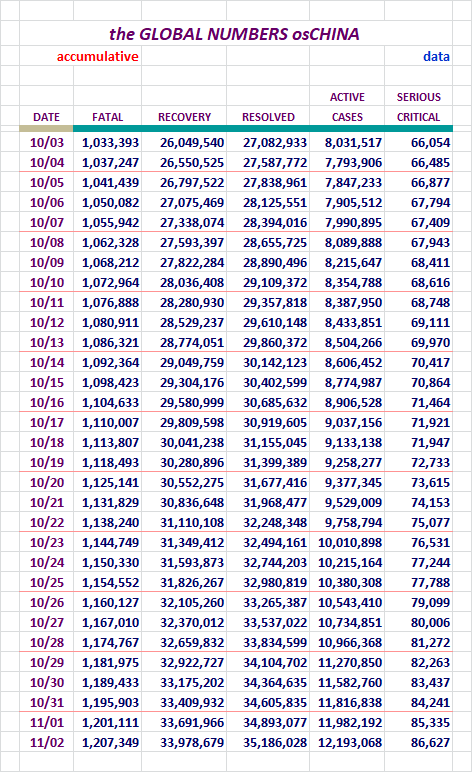
New Milestones in the Global Arena
Global Declared cases rose above 47 million yesterday.
Global Recovered cases rose above 34 million yesterday.
Global Resolved cases rose above 35 million yesterday.
Global Active cases rose above 12 million yesterday.
Global Resolved cases rose above 35 million yesterday.
Testing Goes Ballistic Again
There are generally 900,000 to 1,300,000 test administered each day.
Last week we saw on day where 4.7 million tests were claimed. The
next day was high, and it returned to normal the next day. The day
before yesterday that count dropped to 800k and change. Then yesterday
we had over 4 million tests claimed again.
Some will look at this second day of over 4.0 million tests to be a
move against Trump. It was a stupid move though. As it turns out, when
they do this, the single day positive figure drops to 1 percent and
change. That's a kind of self-defeatist percentage if you're tryin
to make Trump look bad.
Section: 02
The Following Addresses the Numbers Here in
the United States of America
Here we go...
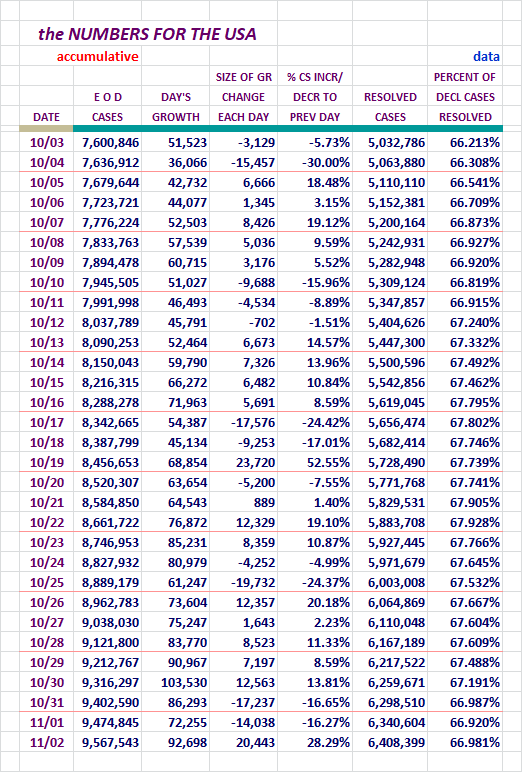
New Case Declarations rose by 20,443 cases yesterday.
Please take note of the Resolved Percentage level on the right.
It has been falling recently, but yesterday... hip hip hooray!
The number is significant enough now to take note of it daily now.
Concept of adding in Active Cases and Serious Critical here, courtesy of amorphous
Here are more of our numbers...
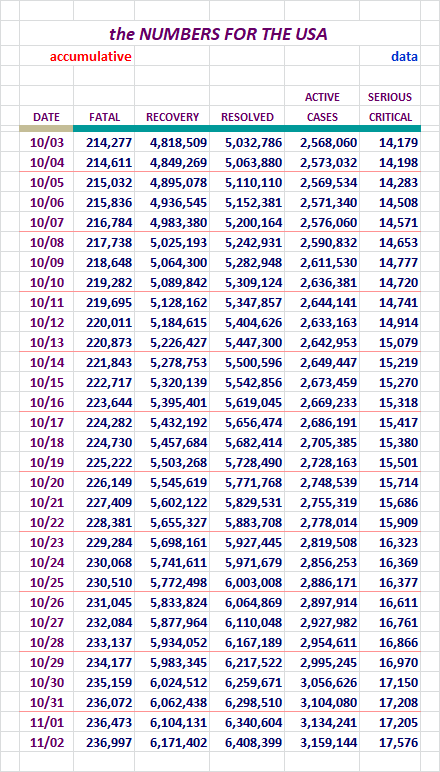
Active Cases rose by 24,903 cases yesterday. That was a bit of a drop off
from recent days.
Serious/Critical rose by 371 cases, but have grown by nearly 3,300 cases
in the last 31 days.
Our Slice of the COVID-19 Pie
The growth of our slice of the pie has been decreasing recently.
Here are the numbers I've been tracking, Globally Declared and Active Cases.
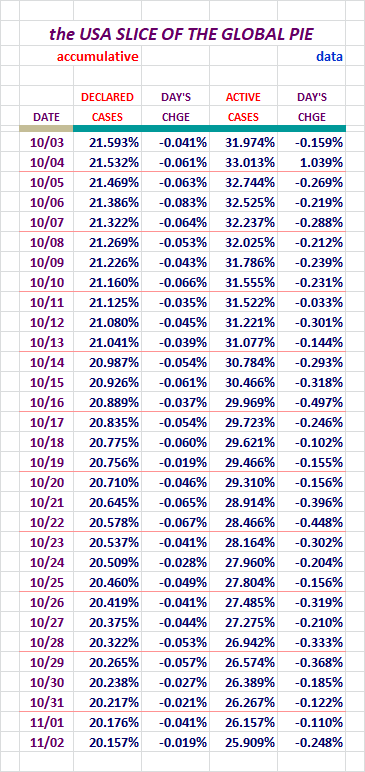
This area has been looking a little better day by day, for around a month now.
We dropped about 6.00% in the Active Case slice of the pie in the last month,
but don't let that fool you, our number has been growing too much, but the
global number has been growing more than ours.
Active Cases in the United States / Chart
Unlike some of the other charts here, we should see a good rise and
fall at some point with this one.
Note that this presents the single, seven, and fourteen day averaging versions.
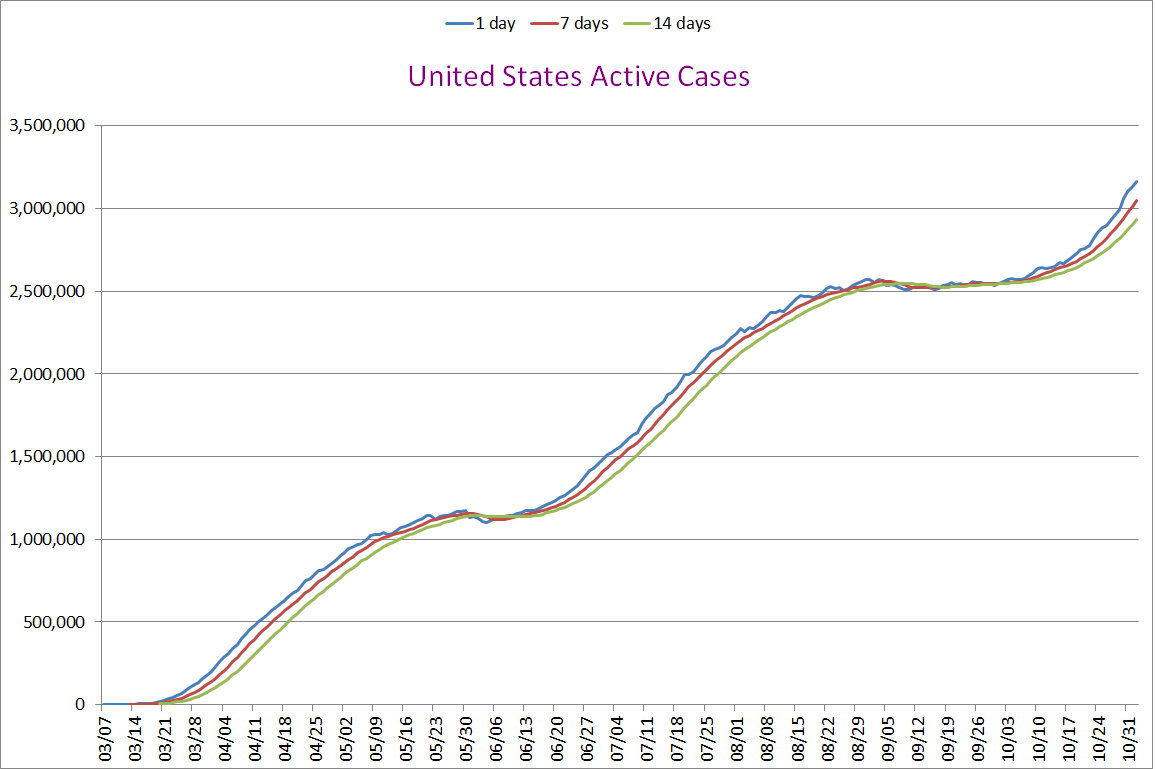
Remember, these are not new Declared Cases. These are remaing Active Cases.
Not liking this are much right now. Disappointing...
The Active Cases are rising day by day. Using this metric we are experiencing
a new wave at this time. About all we can do is wait to see how severe it
becomes. Severe is probably the worng word here, but I think you know what
I mean.
I reference it as the third wave, but Fauci has let it be known, he still thinks
we're on the first wave. He may be right. I'm not sure what the scientific
requirements are to declare a wave over. If it settles down, that seems like
an end to me, and the chart looks for all the world like a third wave is in full
swing now.
Testing and New Case Figures
Requested by stocksthatgoup
Some folks have shown an interest in seeing the COVID-19 Test figures compared
to the New Cases being declared. The following Data addresses that. The size
of it just doesn't seem reasoned to me.
Why/how could the posive portion of the popoulace vary ass much as 2.0% from day
to day? I could a lot easier see a 2.0% trend over three or four days. One day?
Nah.
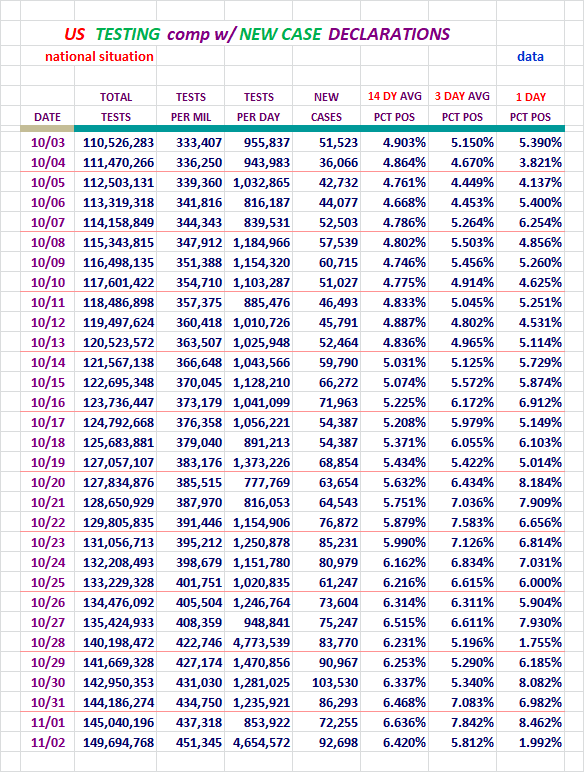
Tests for yesterday were reported out at 4,654,572 yesterday, above
4.5 million for the second time in the last week.
It has to be stated that this is about 4.0 times the normal testing
amount. Saying that, it's very hard to argue the this wasn't poitical
in nature. The optics are crystal clear, undeniable.
For all the tests they claimed, guess what happenedo to the daily percent
of positives. 1.992%, less than 0.25% of the Positive Percentage the
day before. It's hard to look at that result as anything other than
shooting themselves in their own foot.
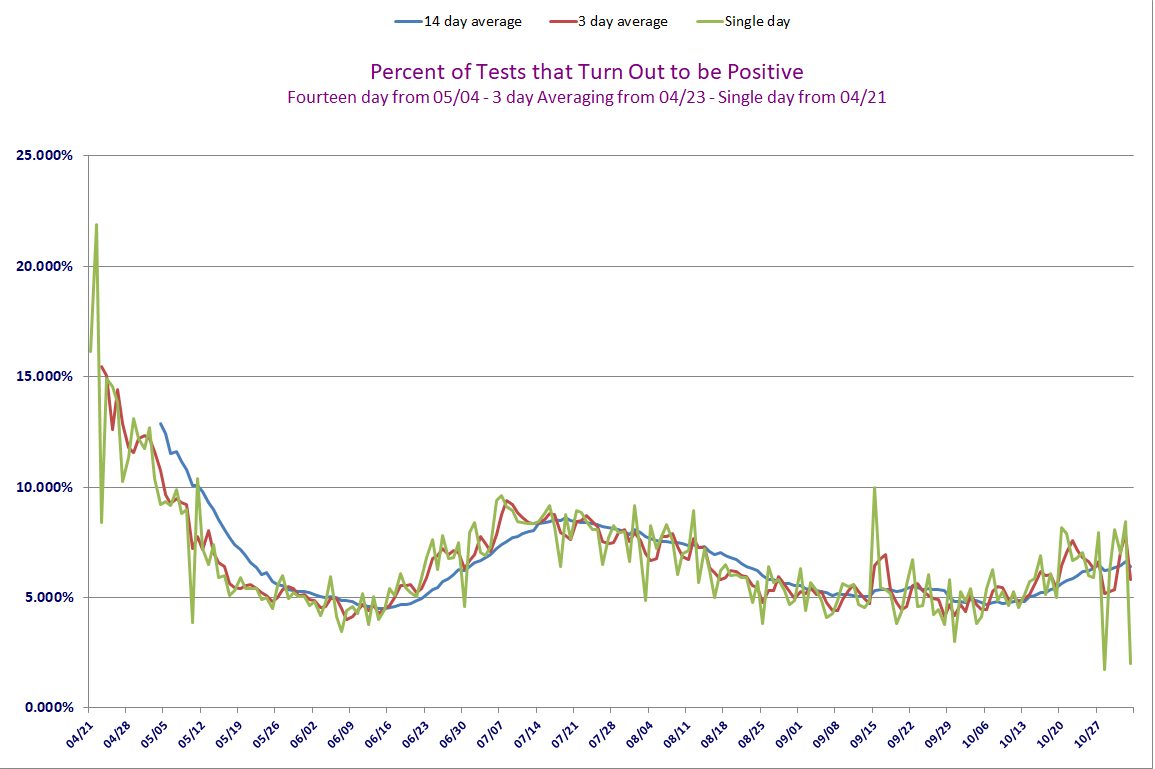
Look at that pea-soup colored line there. That's the single-day line,
and you can see both times that percentage dropped under 2.00%. Both
came on days when the number of Tests claimed were 400% of normal.
The U. S. Stats / w 10 Day Averaging / Fr: 03/17
Requested by: Texas Eagle
This data and chart presents things in a little different way. In the
chart it is easy to see the relationship of these numbers. I may be wrong
not to do so, but I don't plan to put much weight in those figures for a
few days until they normalize.
The Chart will use the data all the way back to 03/17, but the data displayed
here will only go back one month.
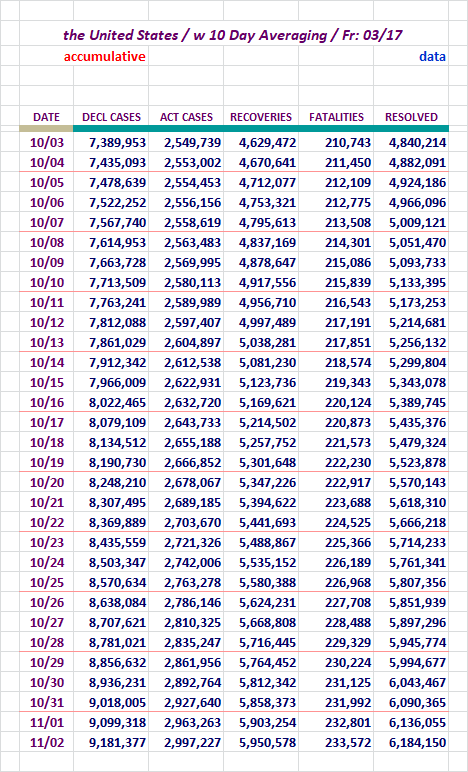
Here is the chart to watch.
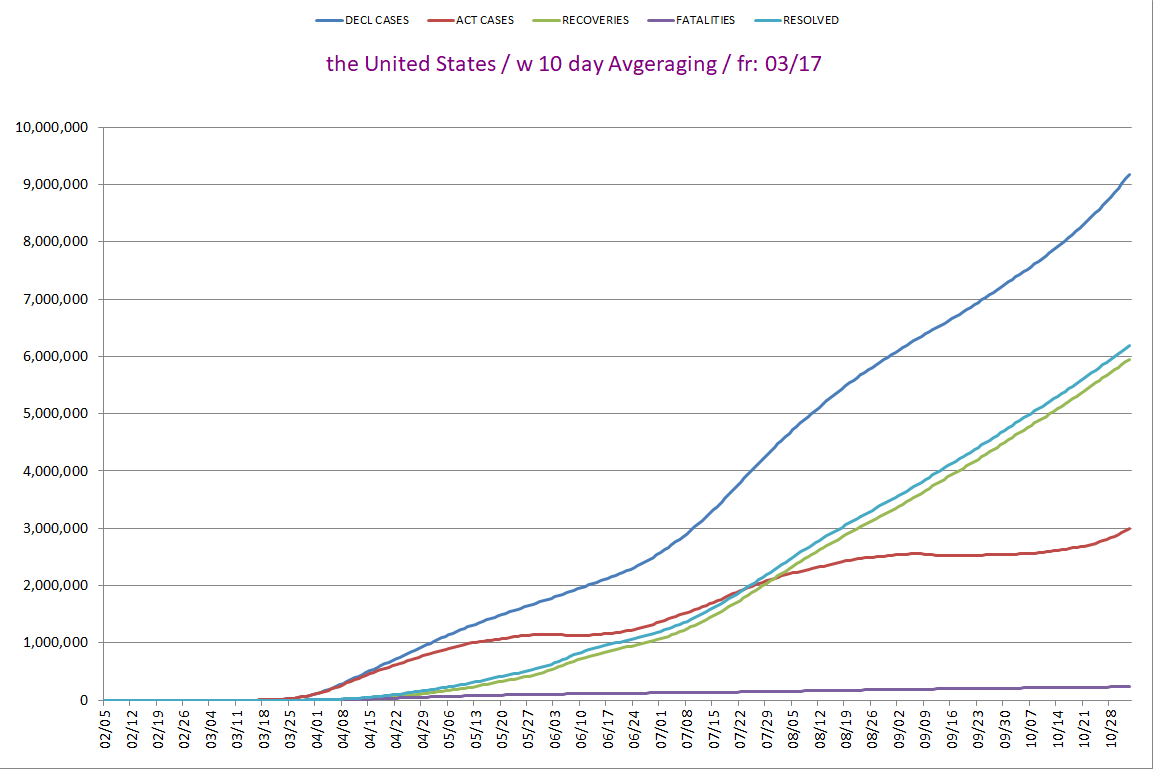
The New Case Declarations line is moving on up.
The Active Case line is rising.
United States Movers and Shakers...
I will present the U S States with the most New Cases and New
Fatilities rankings.
Here we go...
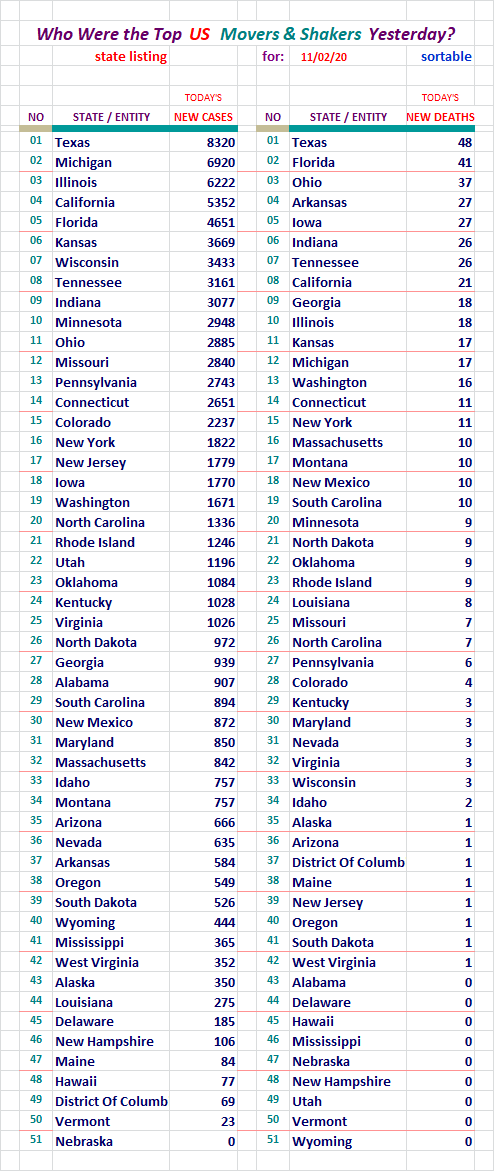
Texas was back on top in both slots yesterday. California is still lower
by comparison. In fatalities it's doing very good.
Section: 03
The Following Addresses the Global Numbers
without Mainland China
Here is the first set of Data for the Global Outside China
Territories
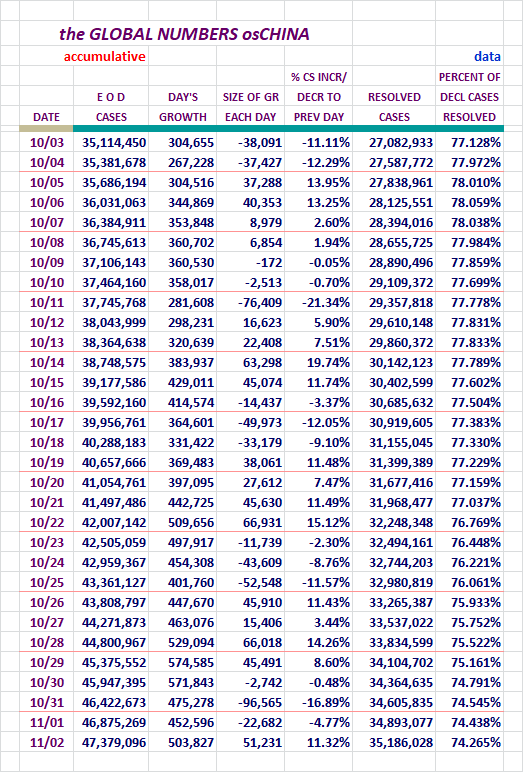
New Case Declarations rose by 51,231 yesterday.
The Resolved Percentage fell again yesterday.
Please take a look back up the column to see it's changes recently.
Fatalities, Recoveries, Resolved, Active Cases, and
Serious/Critical Cases - Globally, Excluding M/L China
Concept of adding in Active Cases and
Serious/Critical here, courtesy of amorphous
Here we go...
Active Cases rose by 210,876 cases yesterday.
Check out the Serious/Critical cases there. 86k +. Grrrr...
How is the Global Community Outside China Doing,
Without U. S. numbers?
Let's see...
The middle/important number rose yesterday, typical for this time
of the week cycle.
The United States elevated number affects that, bringing it
lower than it otherwise would have been.

Global and domestic numbers rose up yesterday. That's typical for
this time of the weekly cycle.
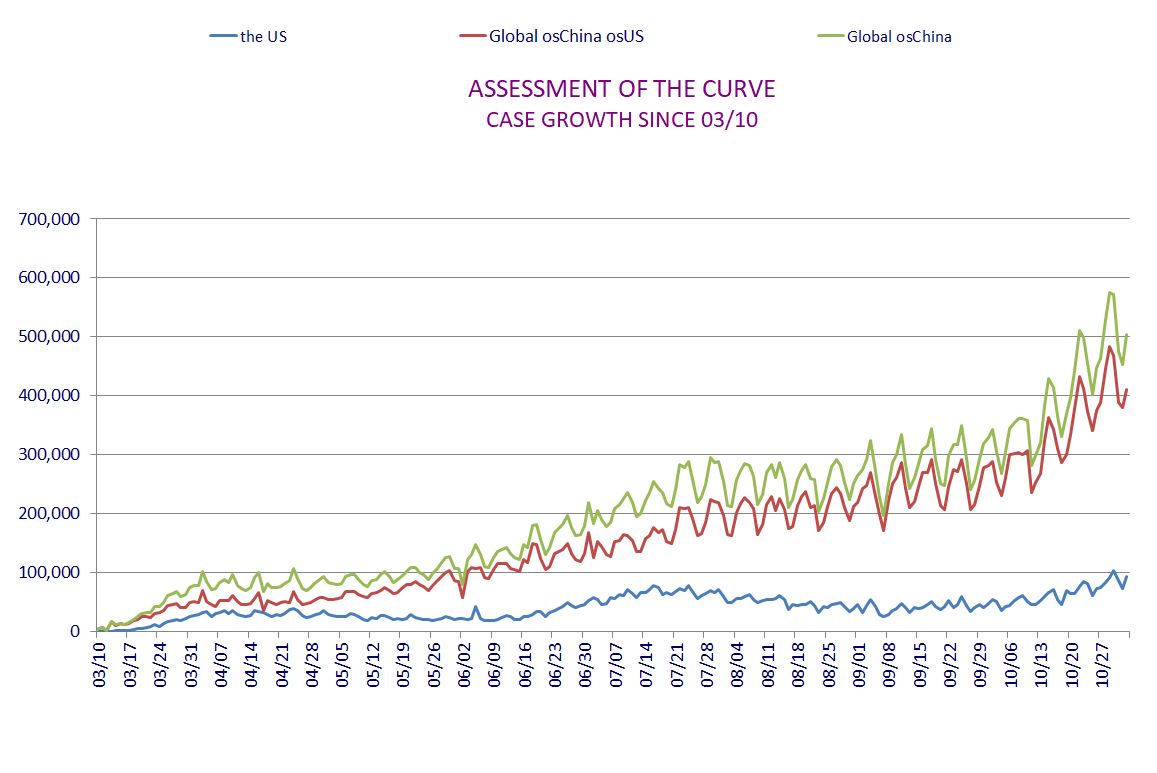
The blue line depicts our New Cases, is still trending up steadily.
The only up side here is that our line doesn't resemble the Global
community line.
The Active Cases outside China Globally / Chart
As in the United States' version of this, we should see a good rise and fall at
some point these two.
Note that these present the one day and then 7 and 14 day averaging versions.
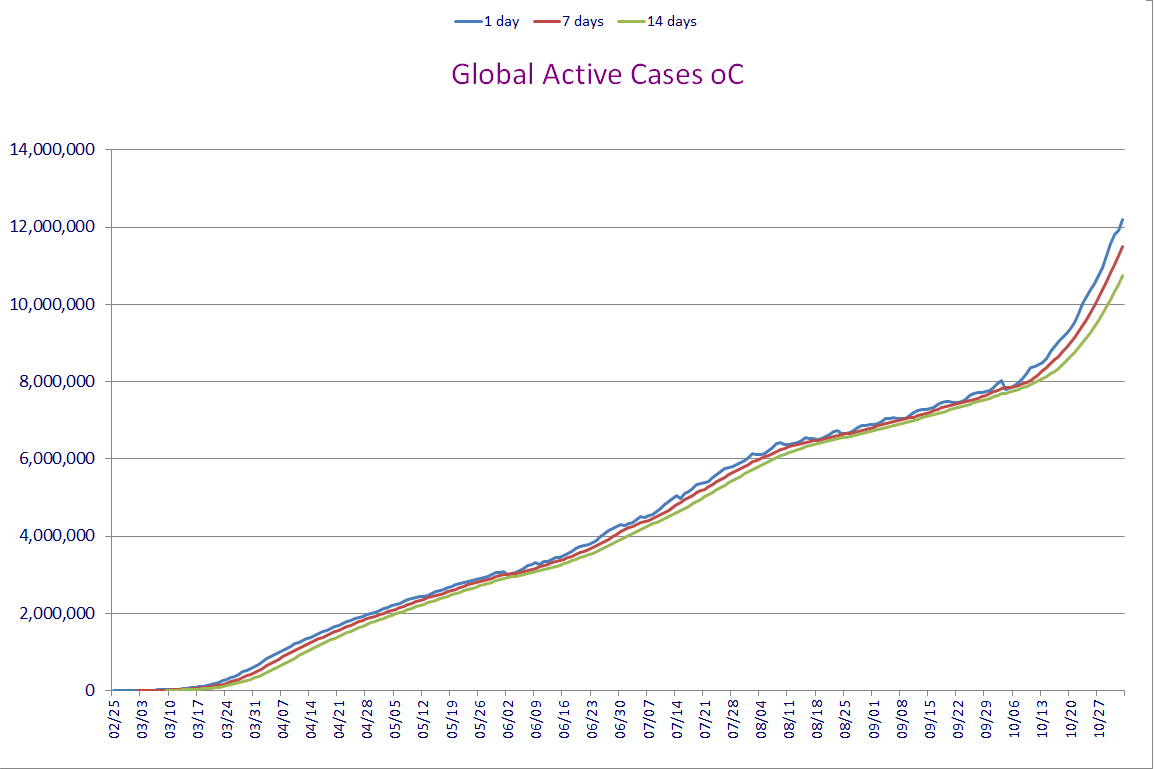
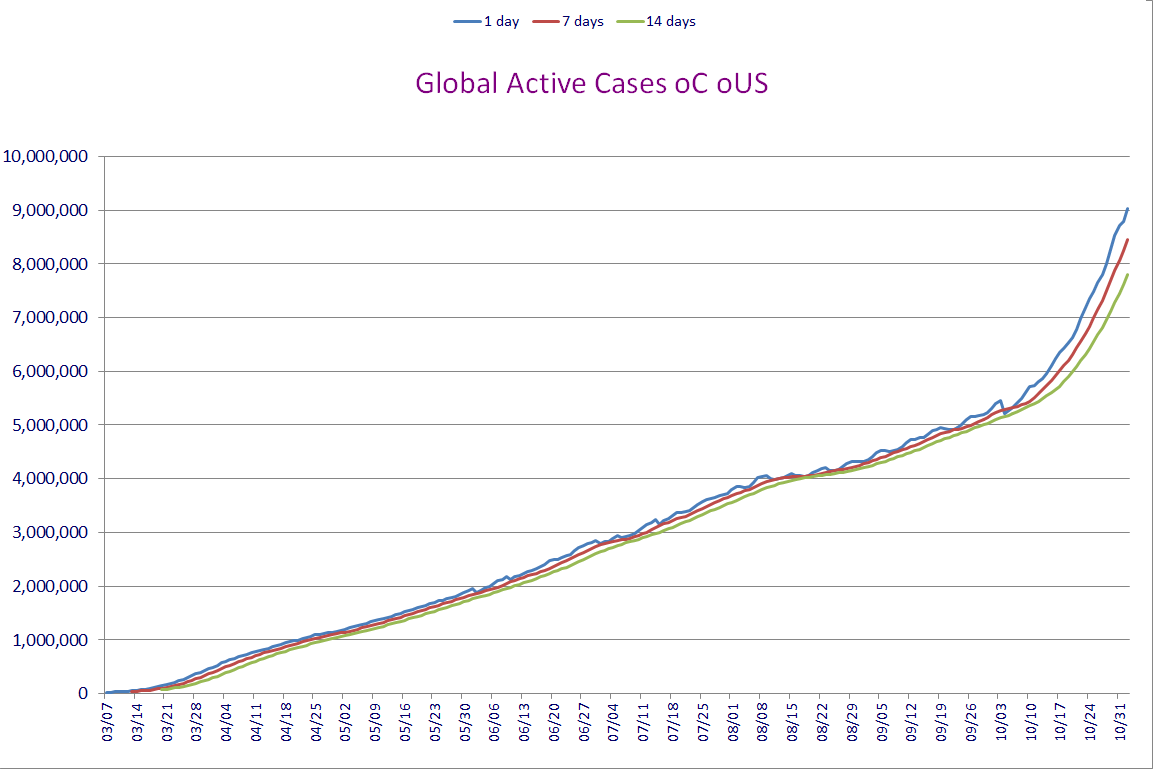
Global Active Cases are growing considerably. The distortion on the right
of those graphs is so out of line with the rest of the charts.
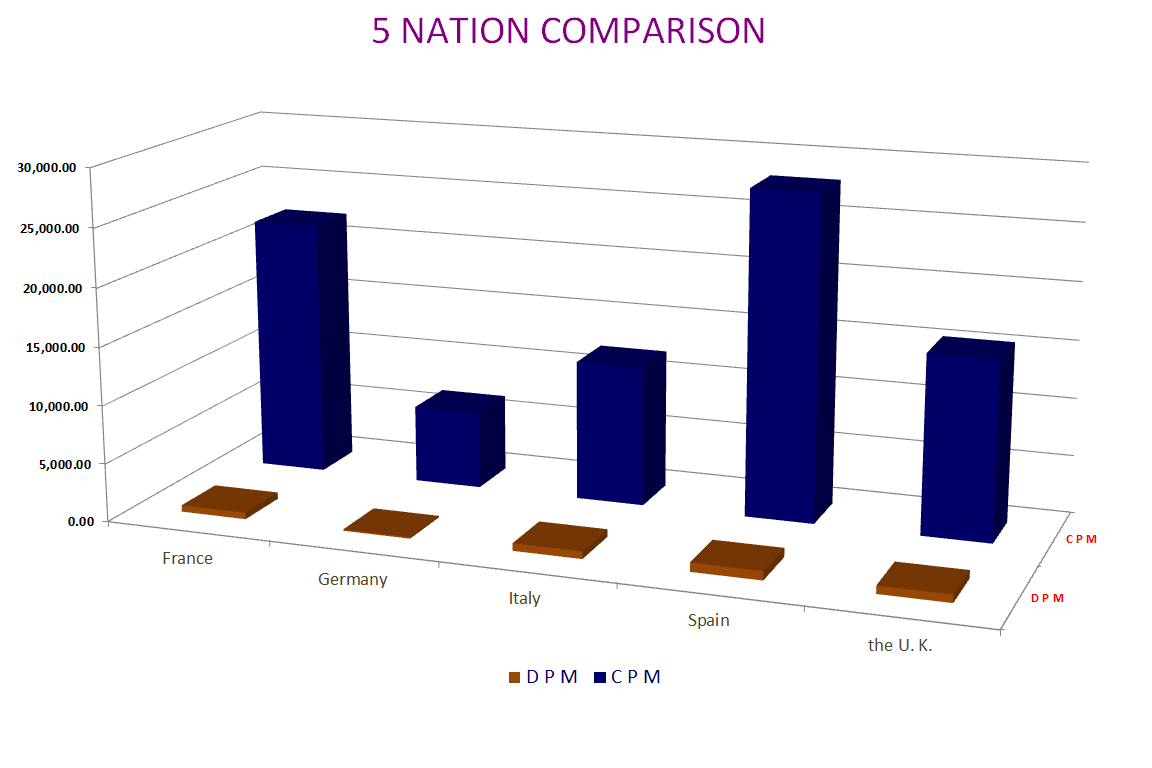
Special Section on France, Germany, Italy, Spain, and the U. K.
Case growth.
Jim Noble mentioned he'd like to see the US numbers added here. I added them
in on 06/21/2020. I did not add them to the chart because it would have
dwarfed the European nations chart lines. (they would have been reduced to
about 15% of their normal size)
Let's Look at Some Numbers in Five Day Increments:
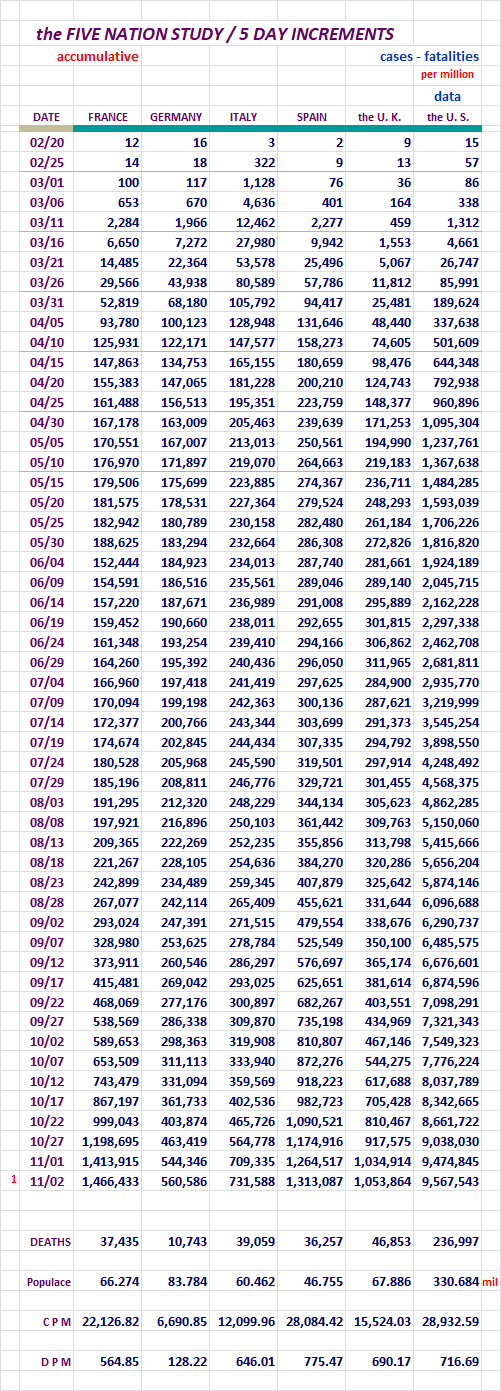
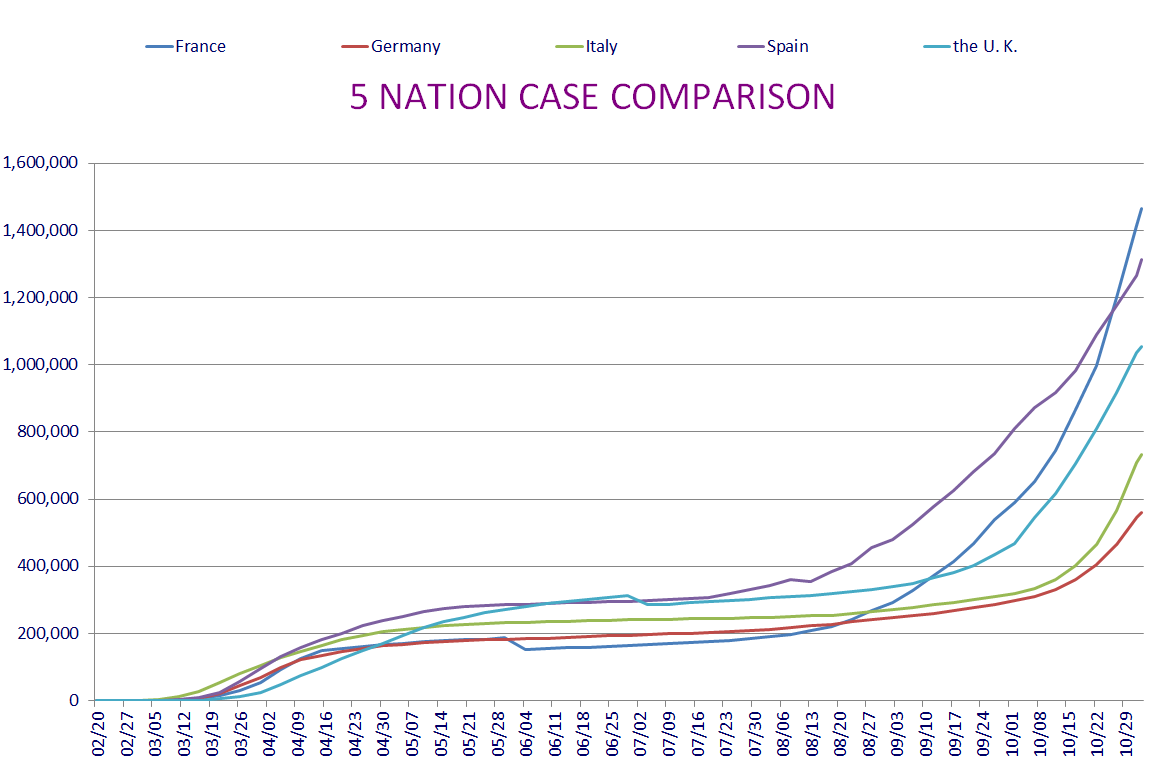
Ug!
The best way to read these line charges, is to take each individual
nation and compare what it's doing now in relation to what it was
doing.
Sweden and It's Neighbors, Who Has the Best Tactic Against COVID-19?
Sweden is doing its own thing with regard to isolating. I think most people
are aware of it by now.
Here are some numbers to help us look at this issue.
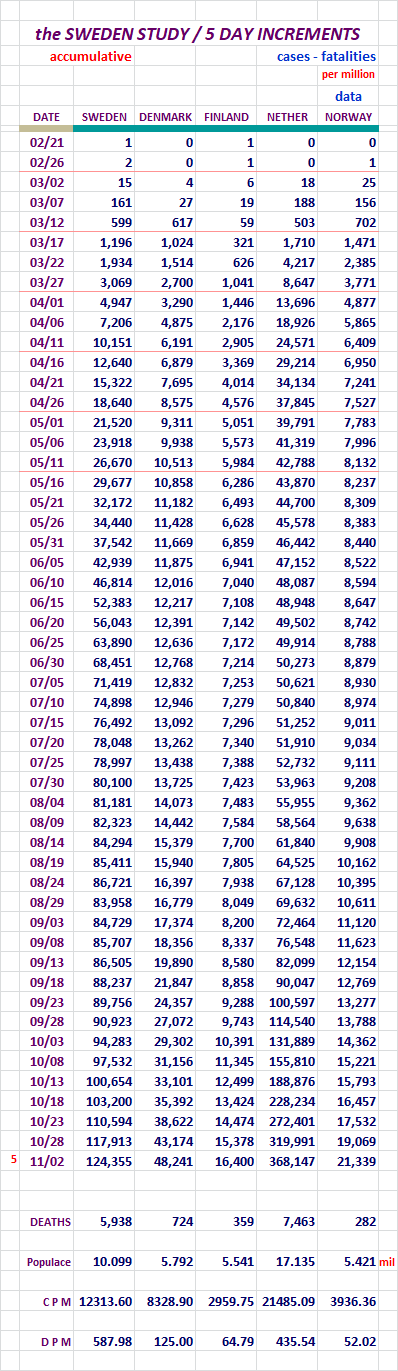
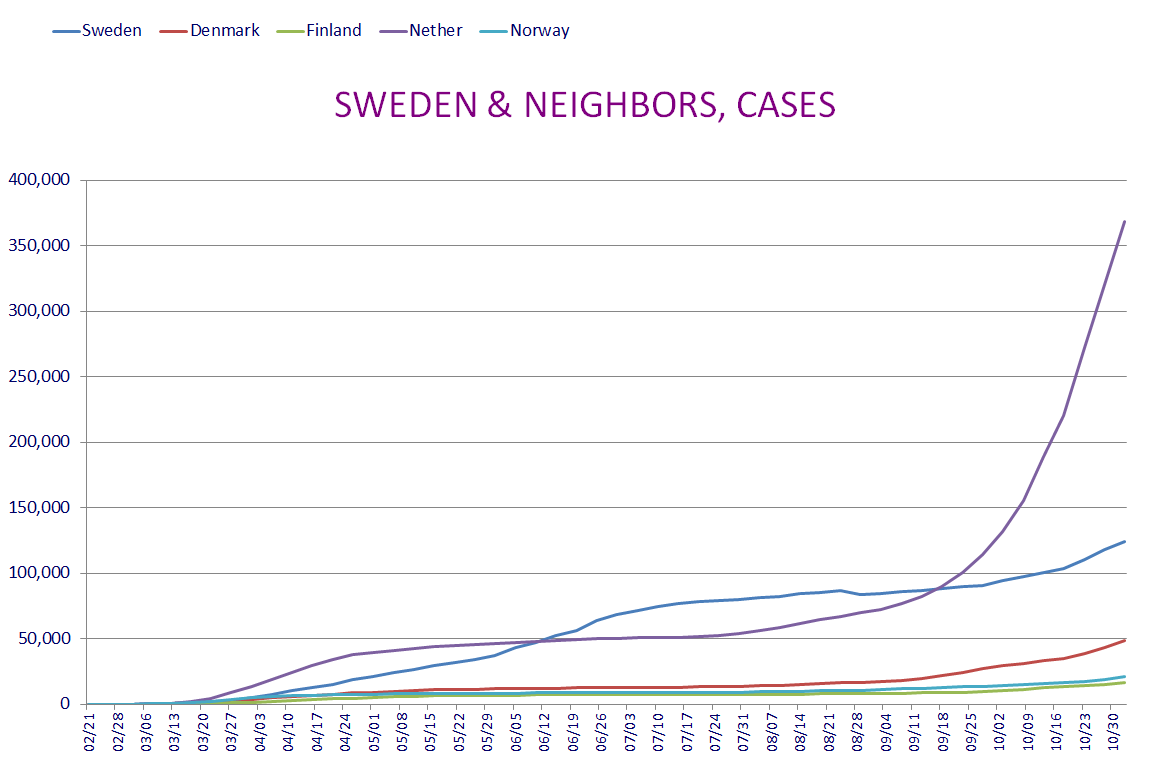
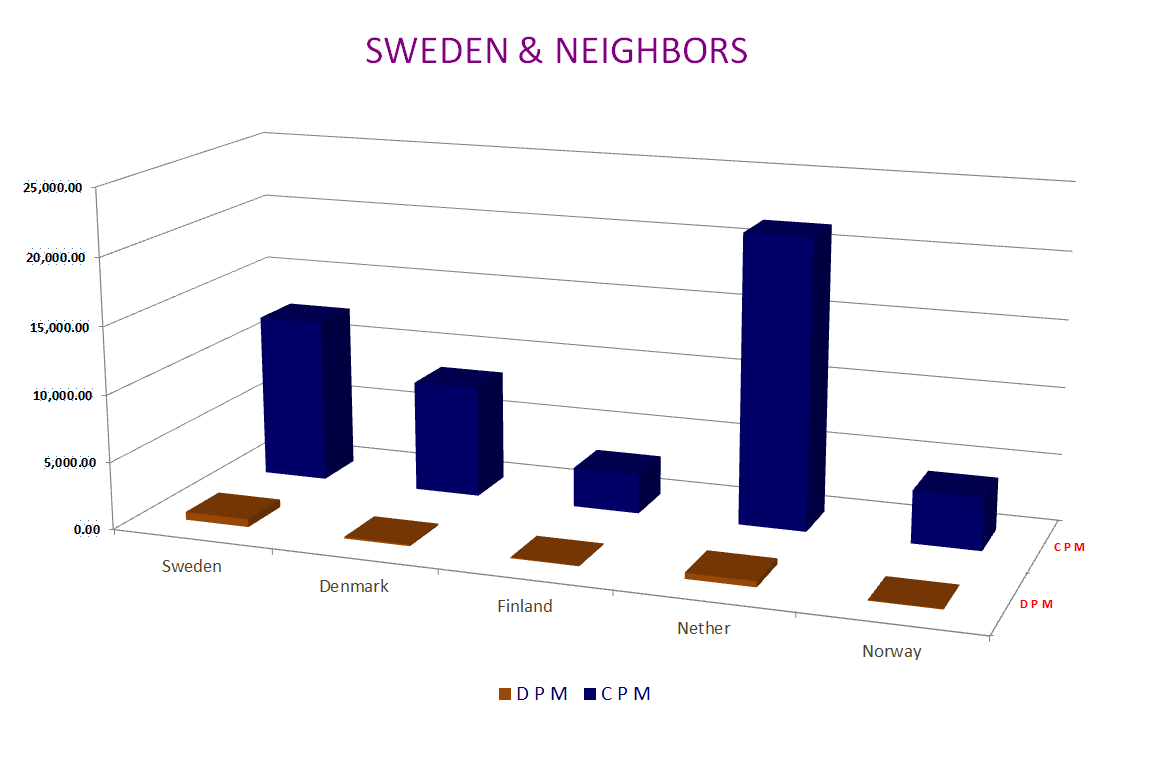
Sweden had flattened out a bit after that correction a while back, but it
is drifting up now, and so is Norway.
The best way to read these line changes, is to take each individual
nation and compare what it's doing now in relation to what it was
doing.
The Netherlands... yikes.
Global Movers and Shakers...
I will present the top fifty nations with the most New Cases and New
Fatilities.
Here we go...
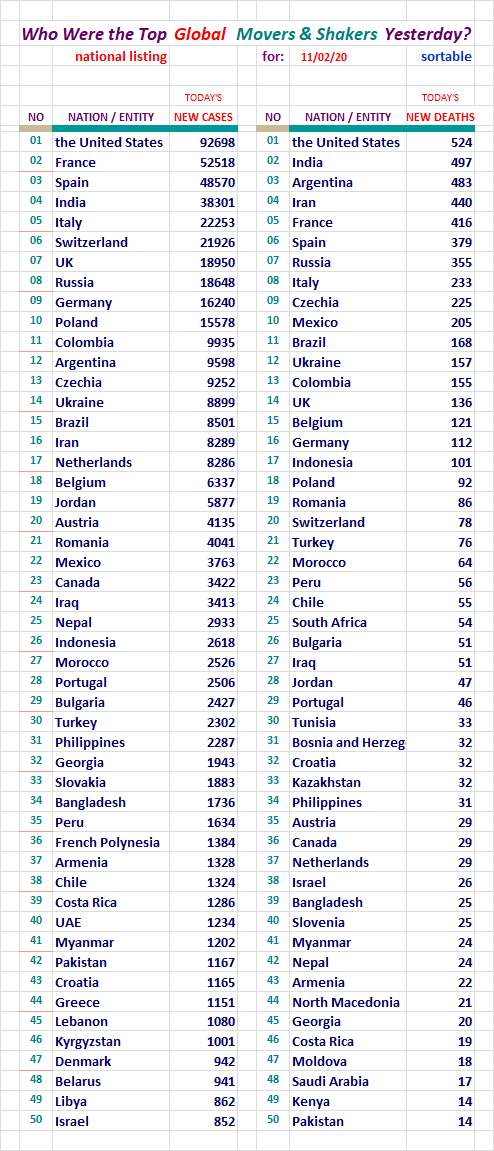
The United States took both spots here yesterday.
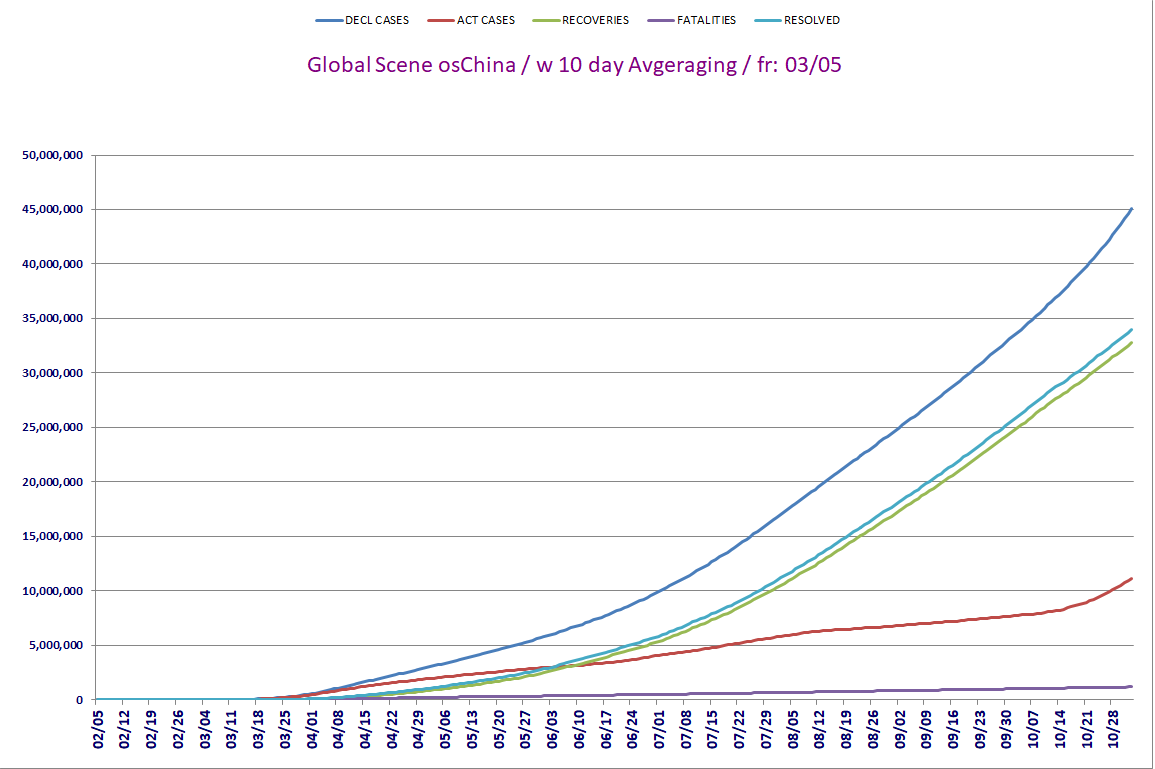
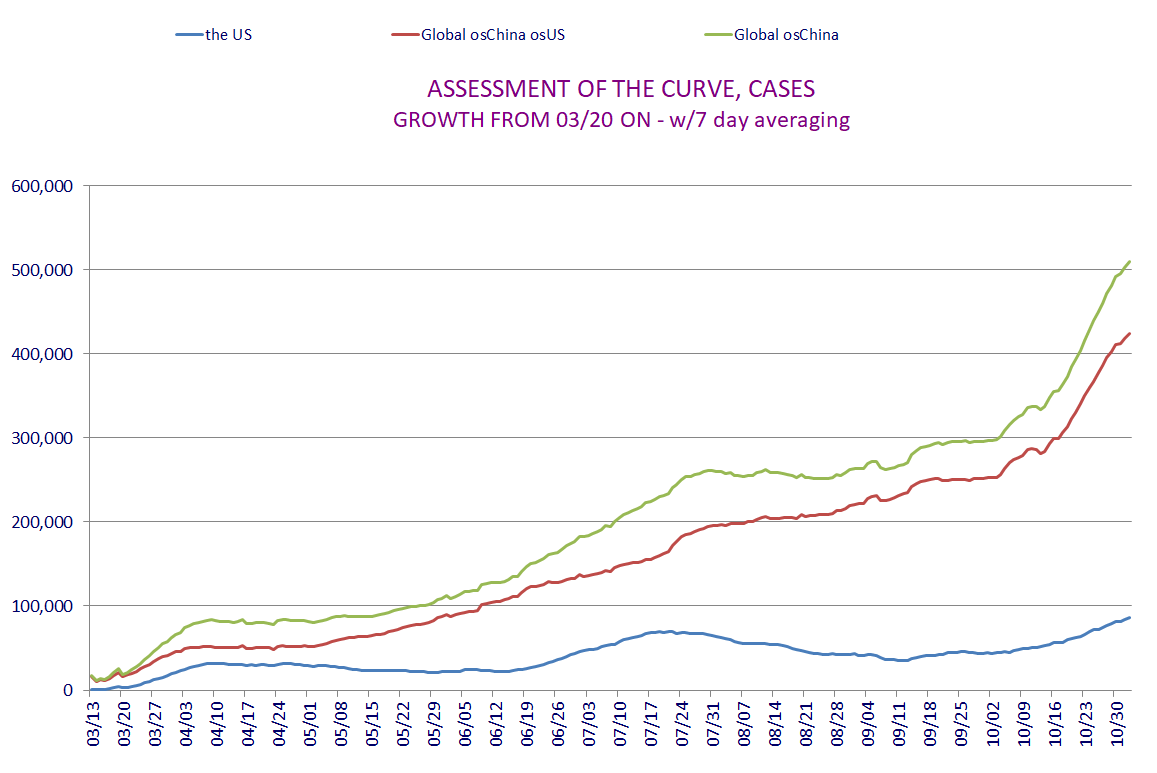
Global osChina Stats / w 10 Day Agveraging / Fr: 03/05
Requested by: Texas Eagle
This data and chart presents things in a little different way. In the
chart it is easy to see the relationship of these numbers.
The Chart will use the data all the way back to 03/05, but the data
displayed here will only go back one month.
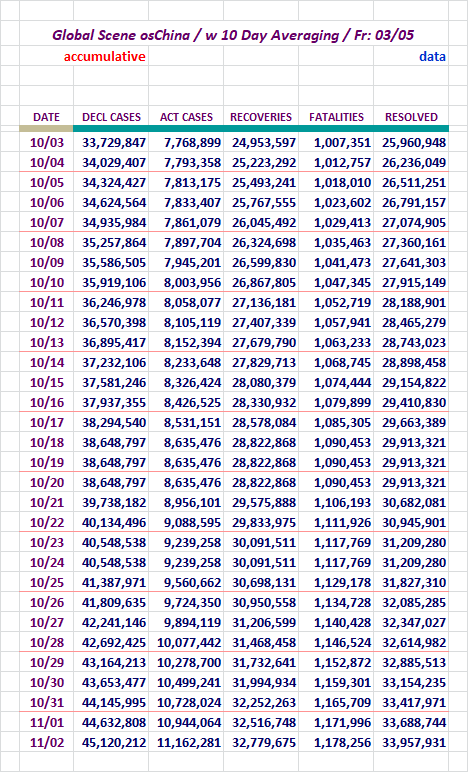
Here is the chart to match.
The Active Case chart line is turning up. Sorry to see it.
In the United States chart like this one, the Recoveries, and Resolved
Case lines have not shown near the strength as is revealed here with these
upward bound lines.
That chart is provided here, in a small version, but you can see it full size
if you right click view.
Section: 04
The Following Addresses the Global Numbers
including Mainland China*
Mainland China's numbers are 0.529% of today's total global numbers.
(this was larger than normal change here, and there may have been
something I didn't pick on - keep that in mind as you review this)
A Look at Declared, Resolved, and Active Cases, Includes M/L China
End of day figures follow:
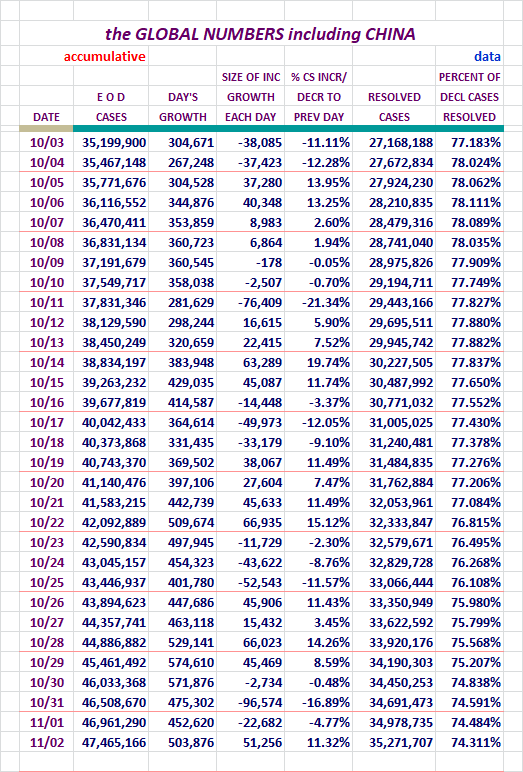
The Resolved percentage is declining for all groups at this time. Just
peak at it once in a while.
Folks should view up the column to see what the trend here has been
recently.
Fatalities, Recoveries, Resolved, Active, and Serious/Critical
Cases Globally, Including M/L China
Concept of adding in Active Cases and
Serious/Critical here, courtesy of amorphous
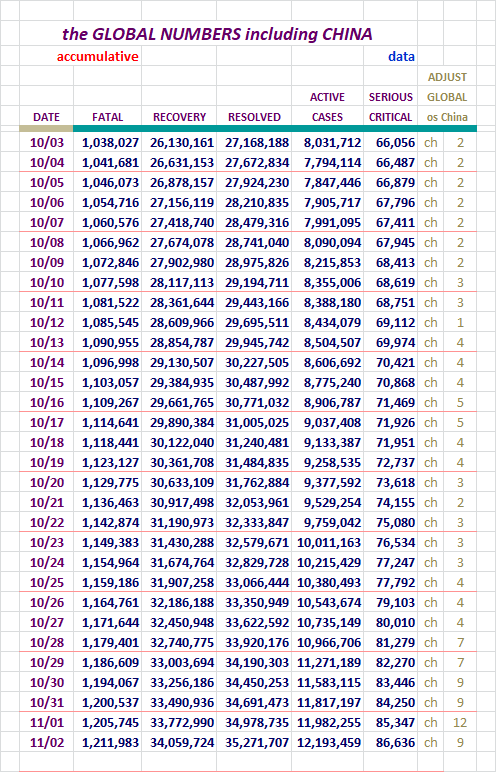
Active Cases rose up 210,904 cases to come in at 12,193,459 yesterday.
Serious/Critical cases rose 1,290 cases. The total there
is a large number.
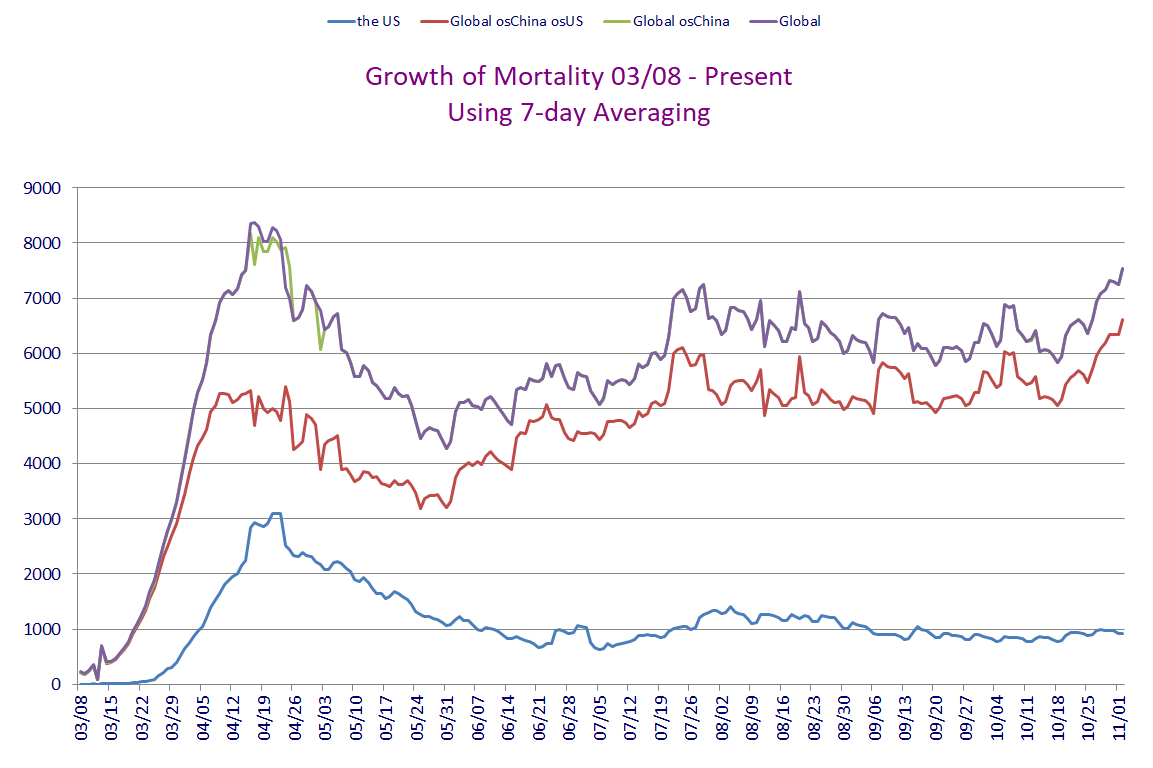
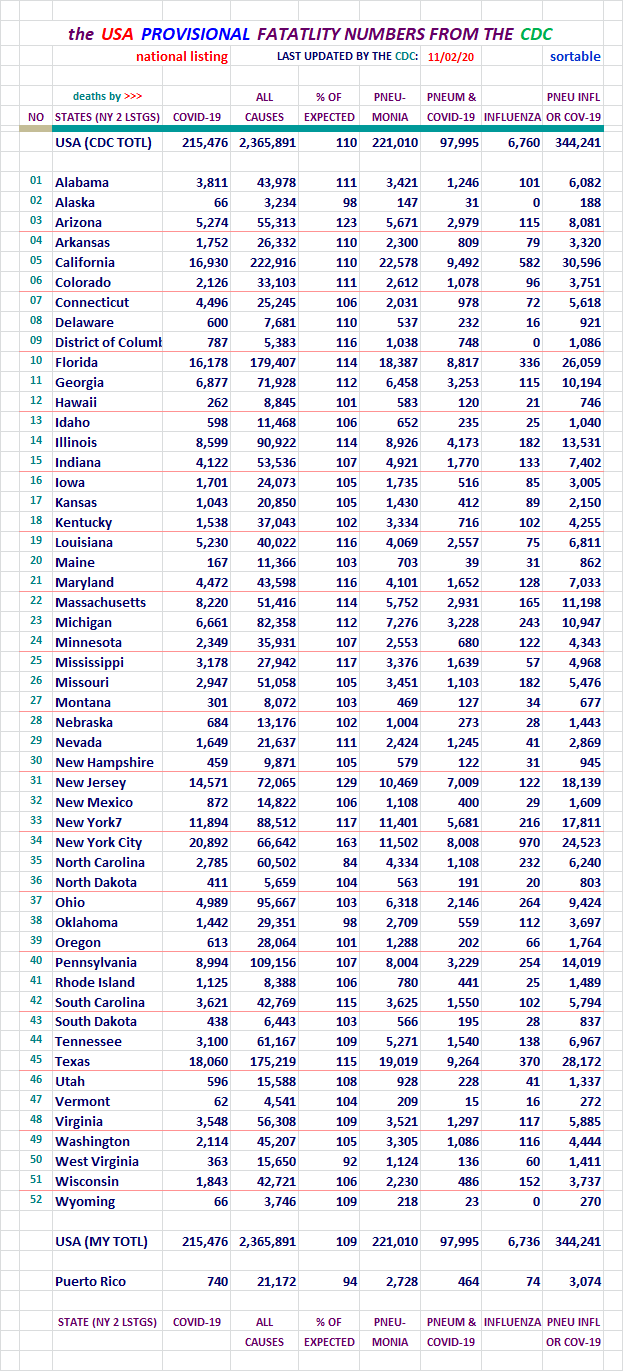
Section: 05
the Mortality Report
Here is the data for four entities...
Here are the figures for the growing case totals for four entities.
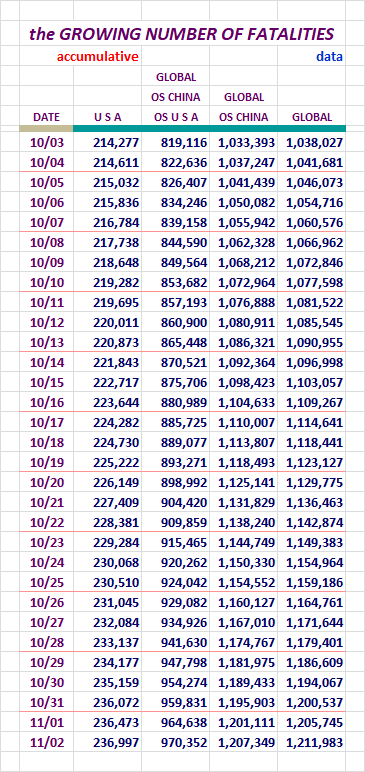
We hear all sorts of stories about how these figures are wildly off. The CDC
has studied them and seems to think they may actually be on the low side of
things. I am providing the CDC Provential Numbers down below. Not sure if
anyone has a rock solid number. I doubt it is possible. This is what is
reported out by WoM and JHU. Check out the CDC numbers too.
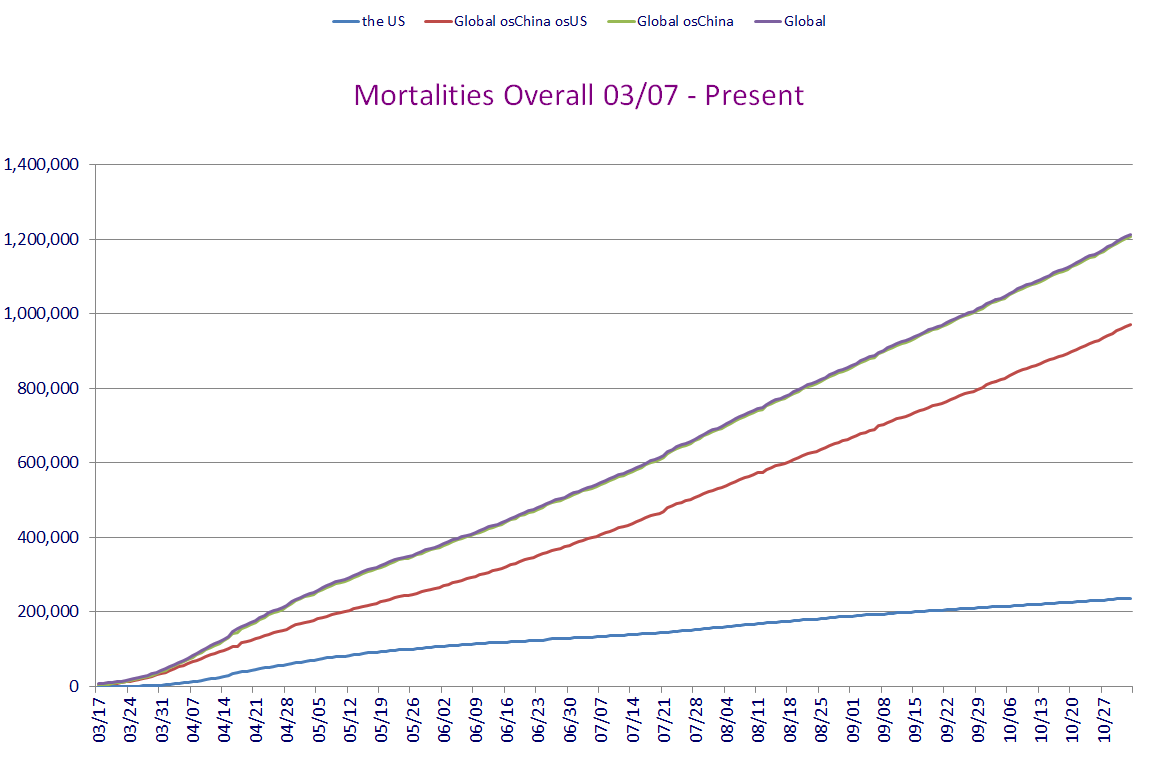
Charts like this one only show growth. That's why I recently took the advice
of a FReeper and added in a new chart for the U. S. and Global outside China
regions.
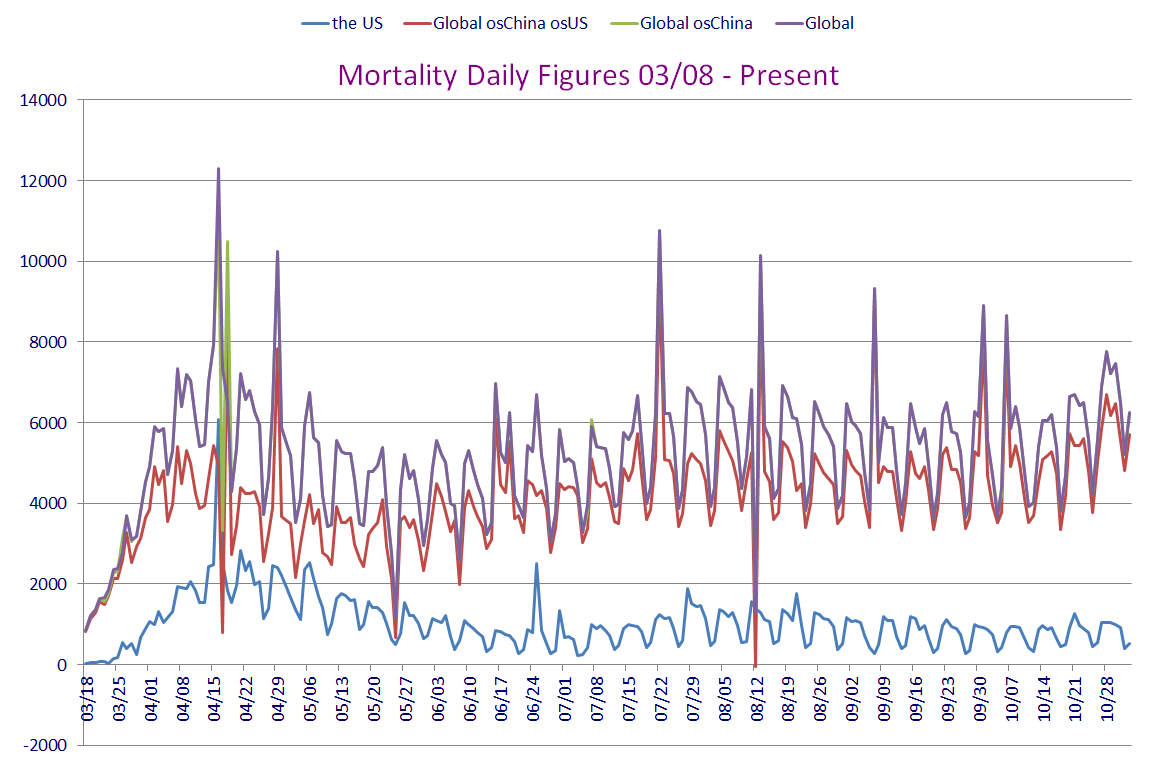
Here are figures revealing the daily growth for those four entities.
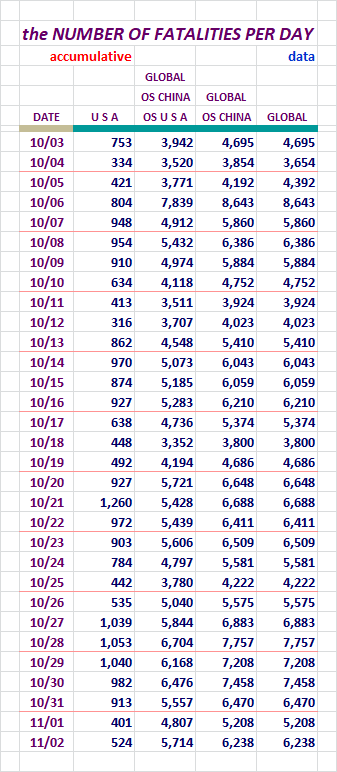
It was a mixed bag when it came to Fatality moves yesterday. Check them
out.
Since the beginning of COVID-19's activity in the U. S., higher New Cases were
soon followed by elevated Fatalities. If we have gone to school on the data
of this disease, we know who should avoid exposure the most. So if the
demographic that has little to fear from the disease is out there getting
infected, it may not be a bad thing at all. If the Fatalities remain low,
vastly higher cases may simply increase the rapidity of the saturation of the
people in public who have already fought it off. And that may facilitate the
end of the disease. I'm sure others know this, but I did want to explain why
my thinking has fluctuated over time regarding these dynamics.
Here, let's look at data for the United States broken out by itself.
This figure was lower than the same day last week. Nice...
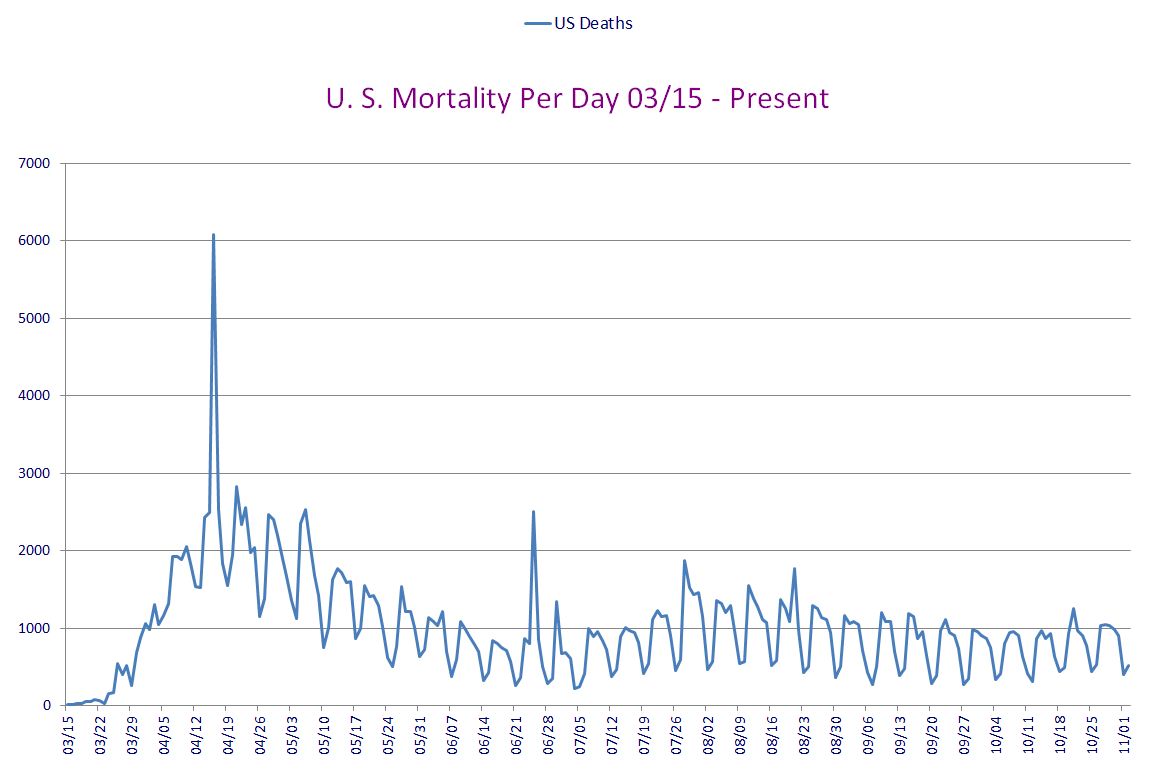
Look how broad that last week is. Note that it hasn't dropped down nearly
as much as it normally does. Sunday and Monday will be key, as they may
tip off what to look forward to this week.
Section: 06
Population Saturation
Here are figures revealing how many people in each population base represent one
case. I'm also showing what percent of each population base is infected at this
time.
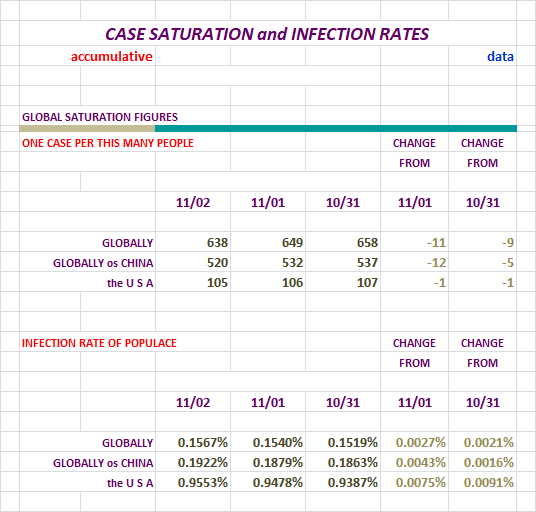
This area hasn't looked too good lately. Not good...
Nations With Lots of Cases
At the end of the day yesterday, there were:
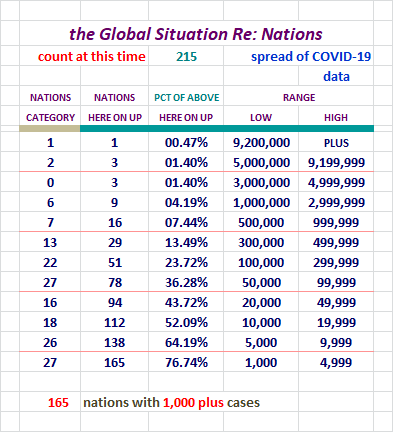
I expanded the levels here. We had nations who were seeing serious
growth, and their levels weren't showing up very well at the top.
Over 50% of the 215 nations we're tracking now, have declared over 10,000 cases,
but they have far less of them still Active. Over 30% of the nations we're
tracking have delared over 50,000 cases along the way. None of them have
anything near their declared amount remaining active. Keep that in mind.
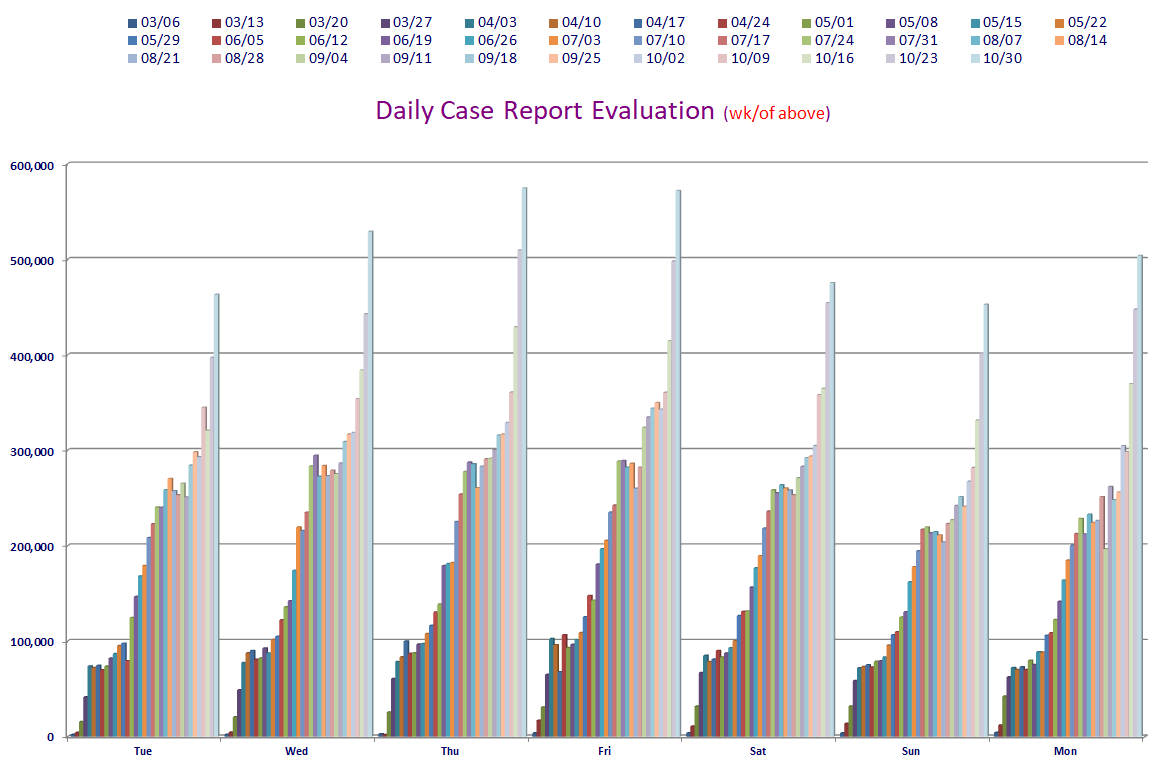
Daily Case Report Evaluation
I'll be keeping tabs on the daily tallies for days of the week for a while. Folks have
noticed some patterns of larger and smaller data entry on certain days, and on Fridays
sometimes the numbers get noticeably larger because of it.
And we now know Thursdays have potential to break out also. Yikes!
IMO Let's check out the numbers and a chart.
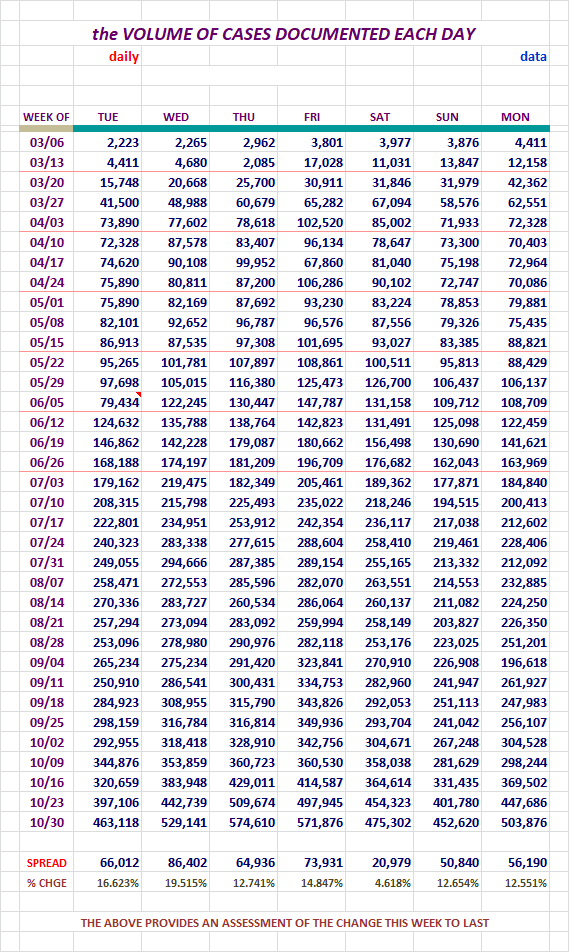
Please take note of the new tally line down below the numbers up above.
I'm now showing the case number change and percentage of this week's number
to last weeks number.
On Monday, generally a lower day of the week, came in over 500k. That
doesn't bode well for the week. We'll see how it plays out.
Section: 07
The Top 200 Counties in the U. S., by Number of Cases
This little report lists 200 Counties in the United States in declining Case numbers.
There is also a listing that is alphabetical. This report list only the entities
and the number of Cases in the two different sorts.
It will also be available as a downloadable Excel file in Section 12.
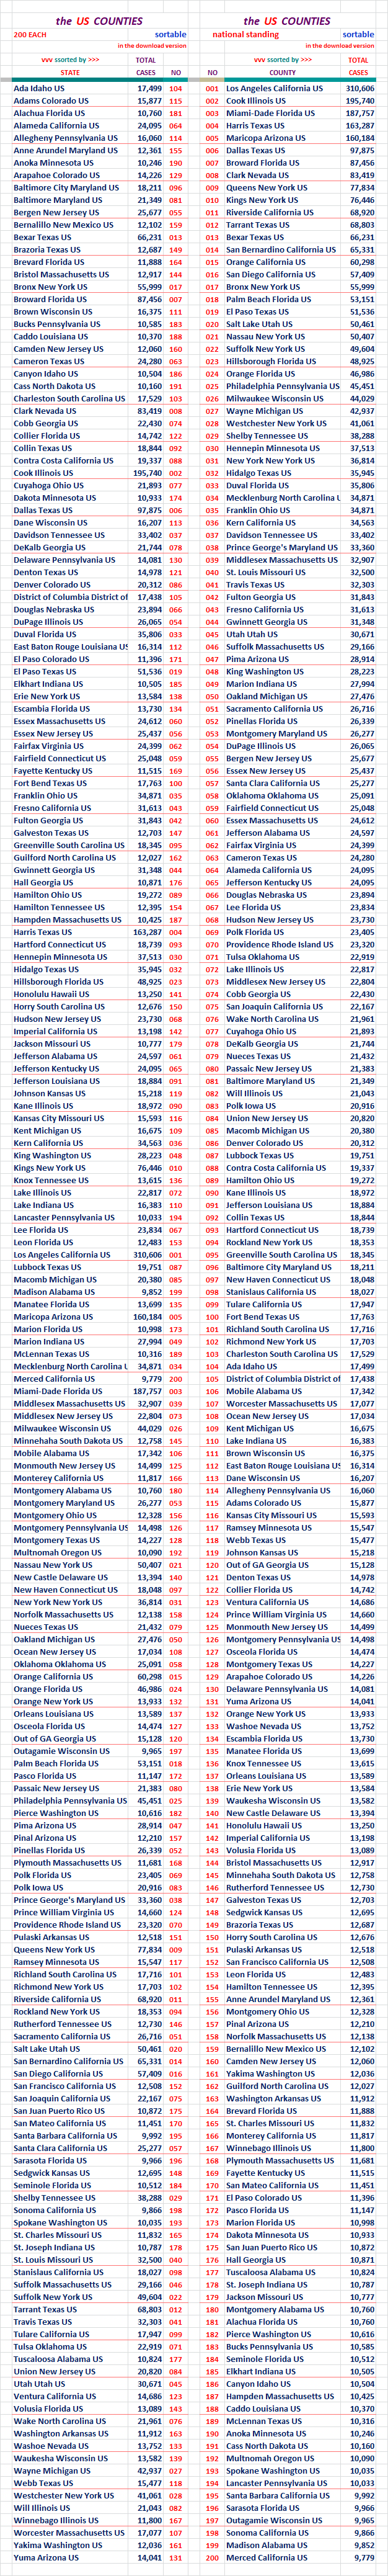
For months Puerto Rico was showing up with the Counties. That stopped in early July
if memory serves me well.
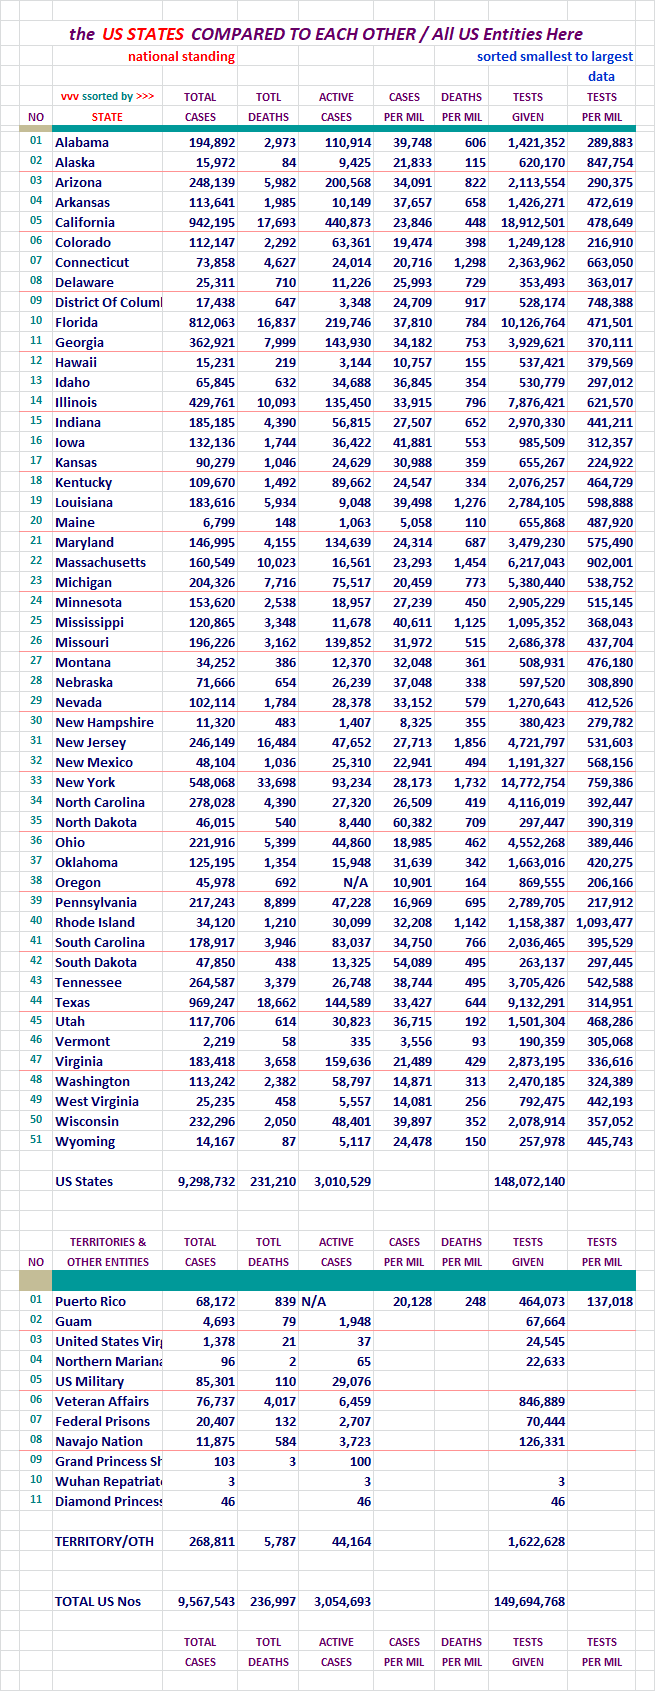
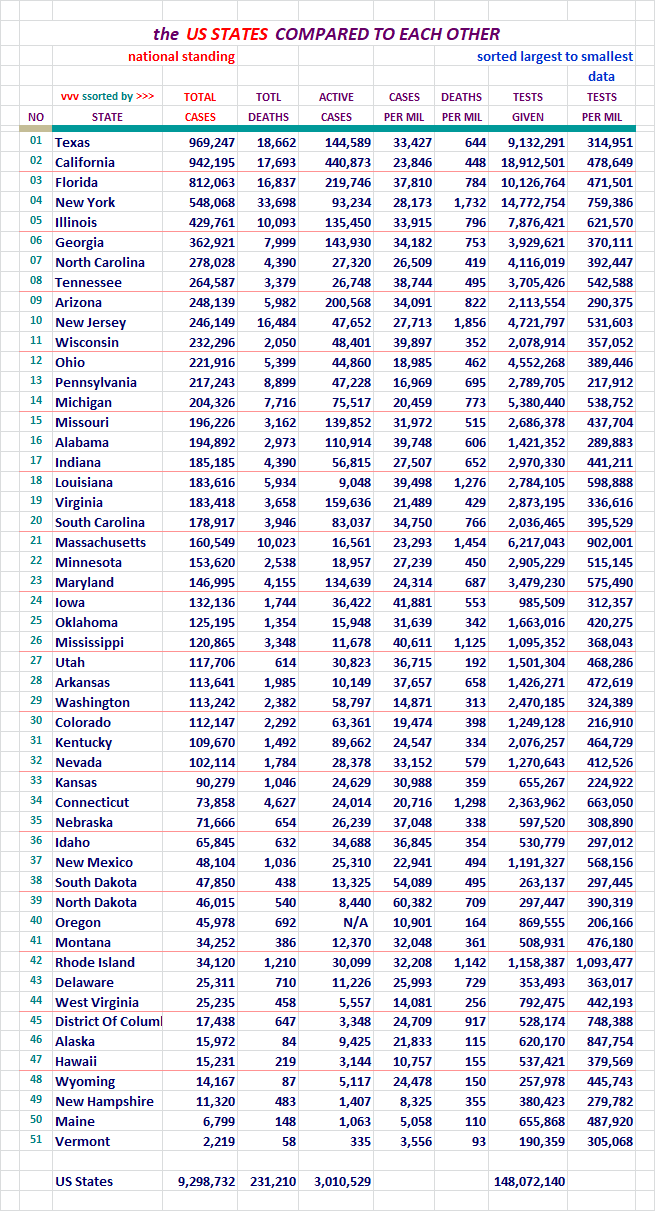
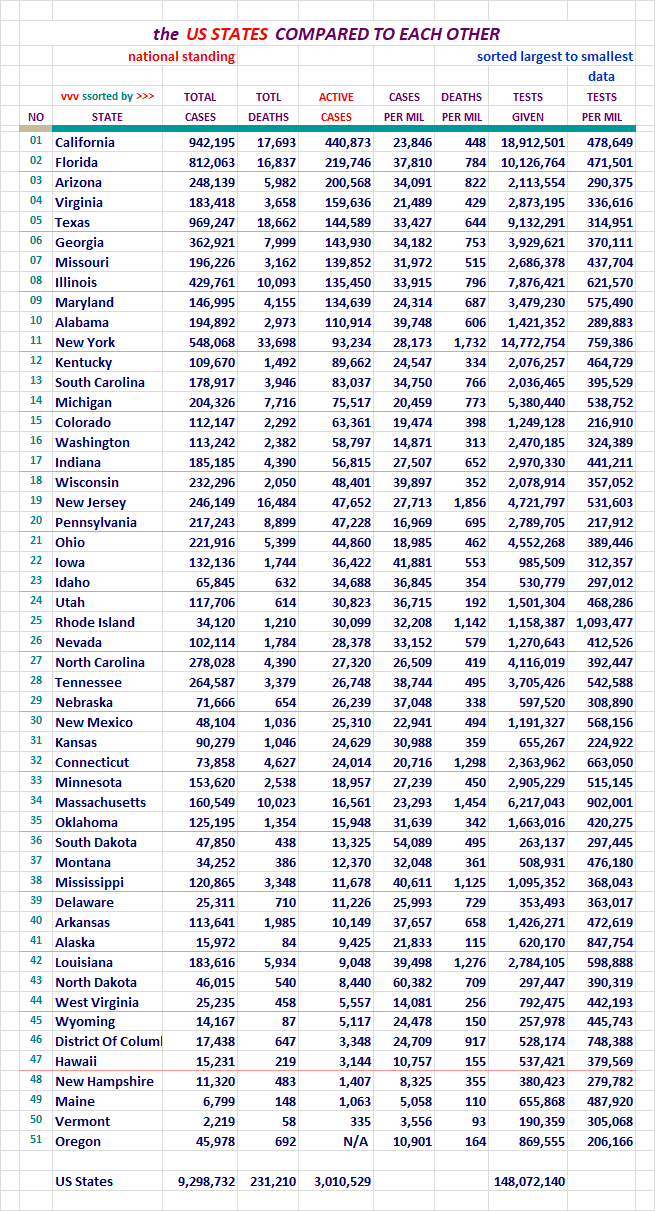
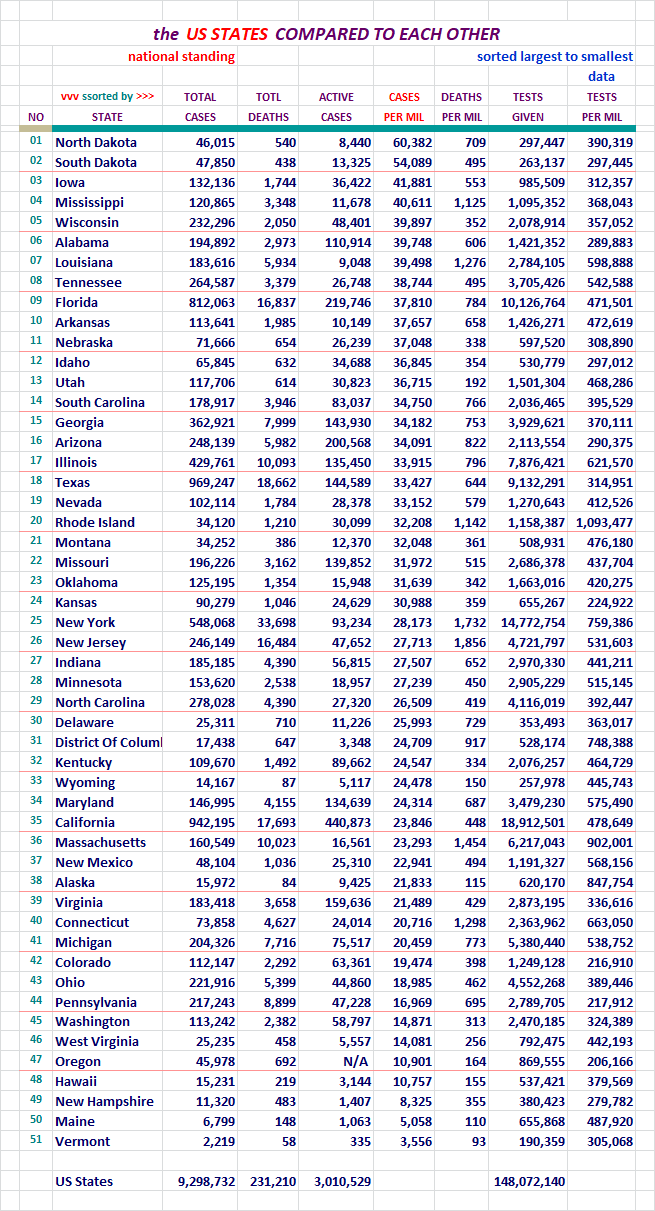
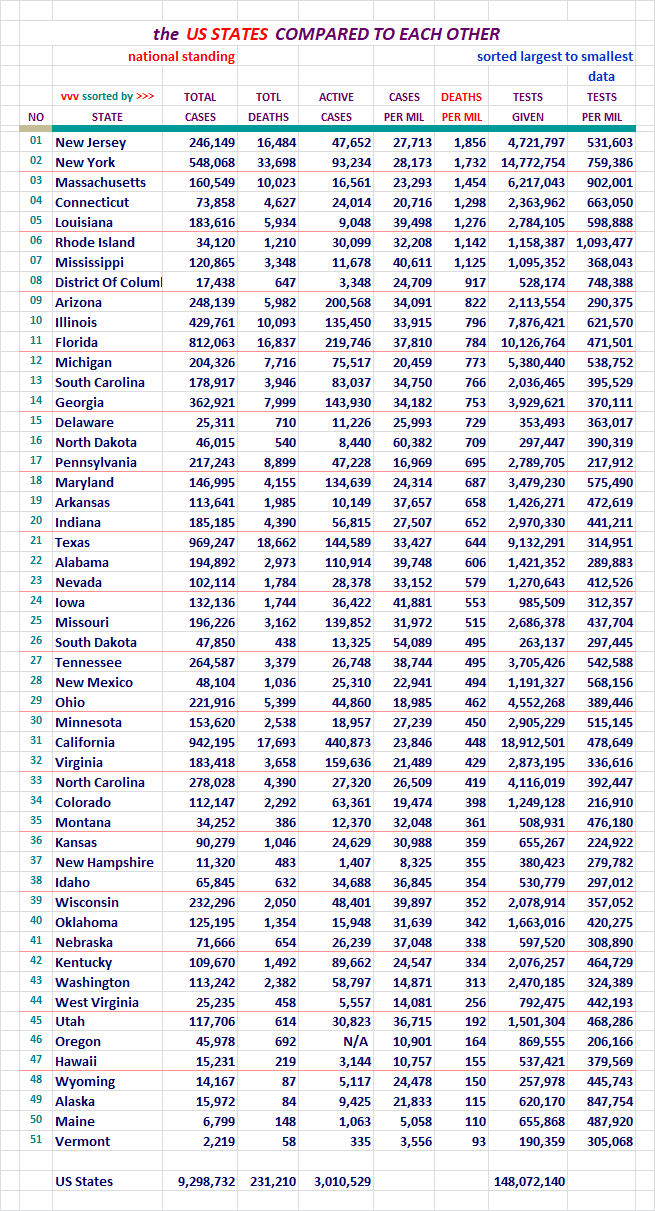
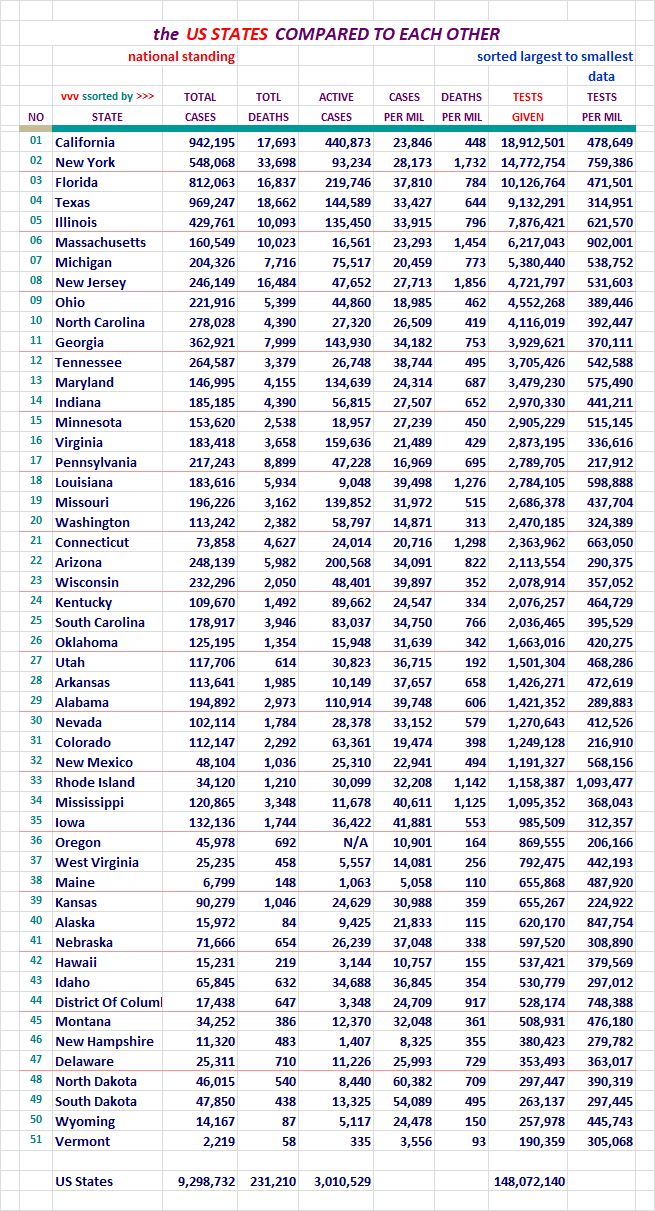
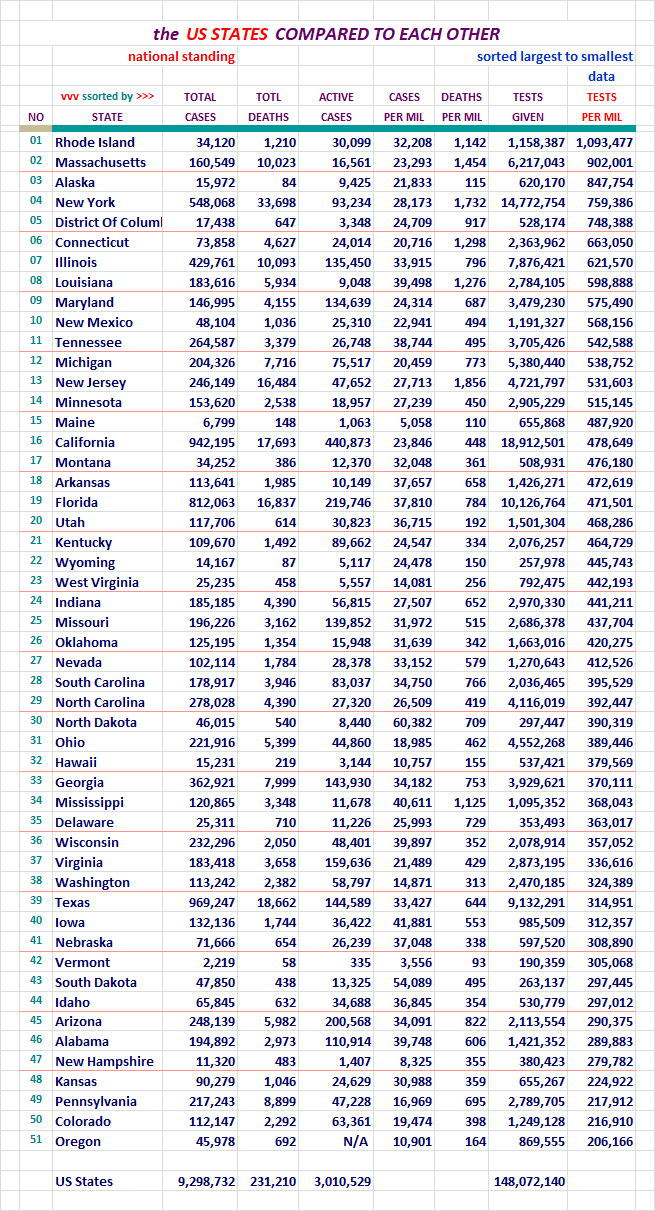
Section: 08
States of the Union and the District of Columbia, Compared to Each Other
Each of these pages is sorted differently. Look at the red header above
the columns to see which column was used for the sort on any given page.
For your review...
For your review...

For your review...
For your review...
For your review...
For your review...
For your review...
For your review...
For your review...
If this area interests you, please use this LINK to the source, and review
the lengthy description and explanation of it's development process.
There are two reports. The presentation above comes from the second one,
and the detailed segmented information below it, may interest you.
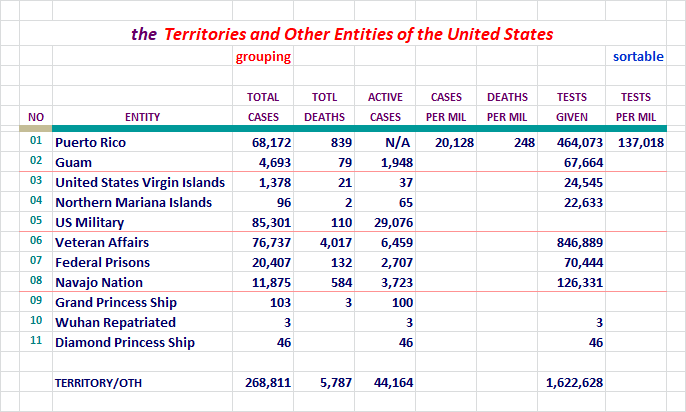
These can now also be found under the states on the Alphabetical list. The
states and these entity's numbers should be combined to match that of the
U. S. figures each day.
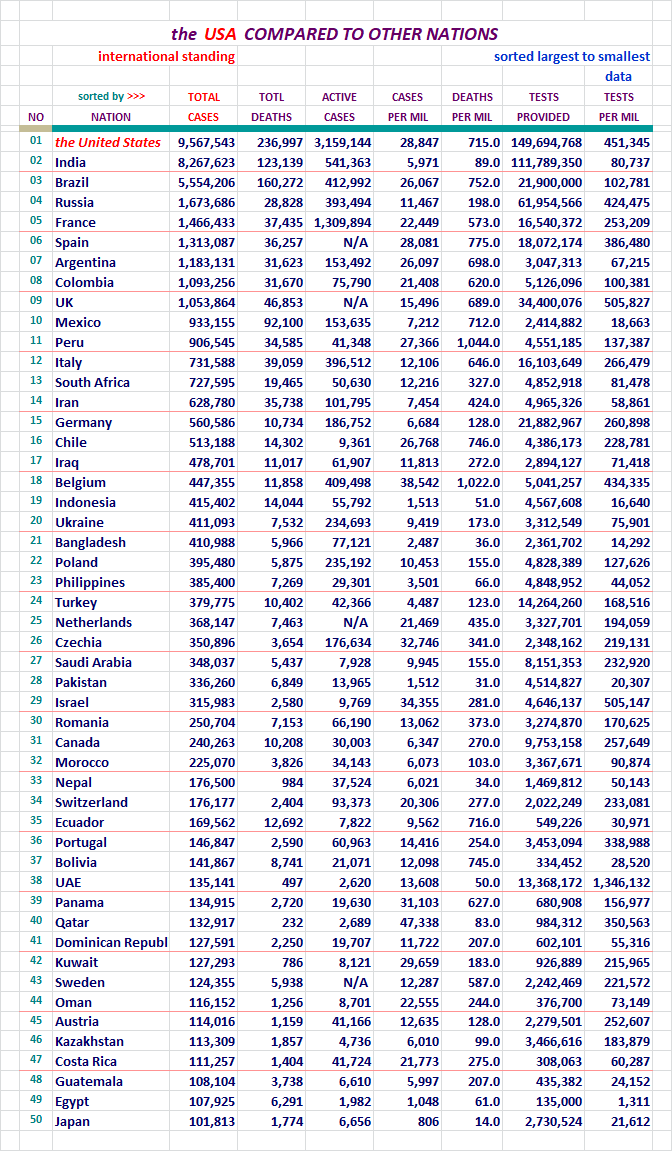
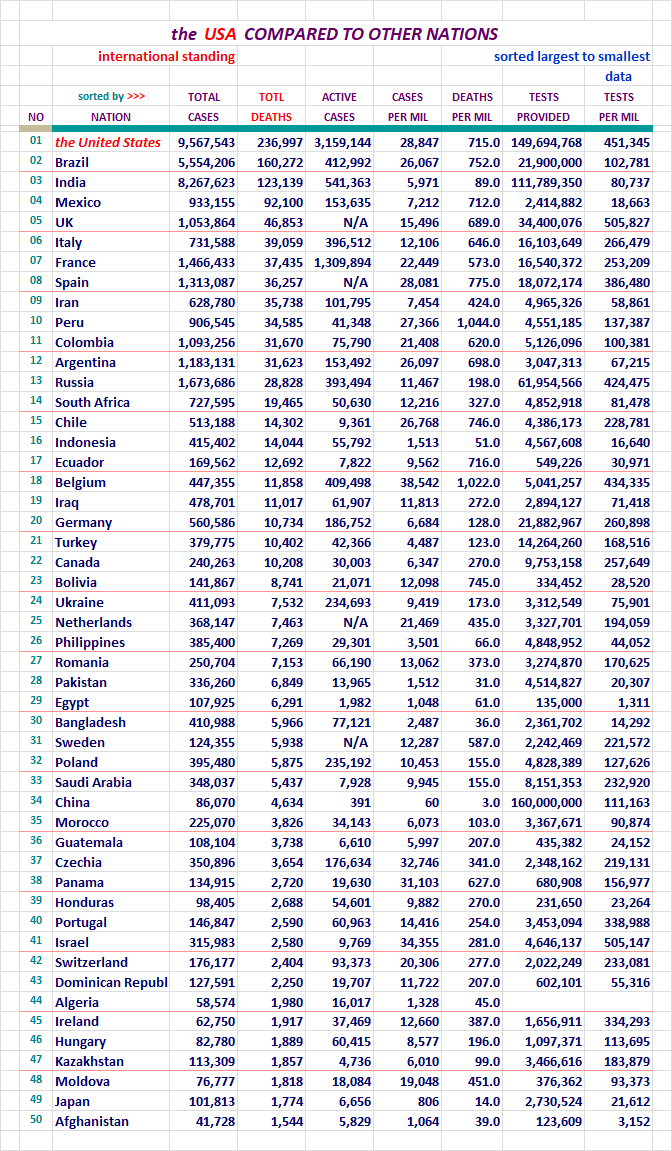
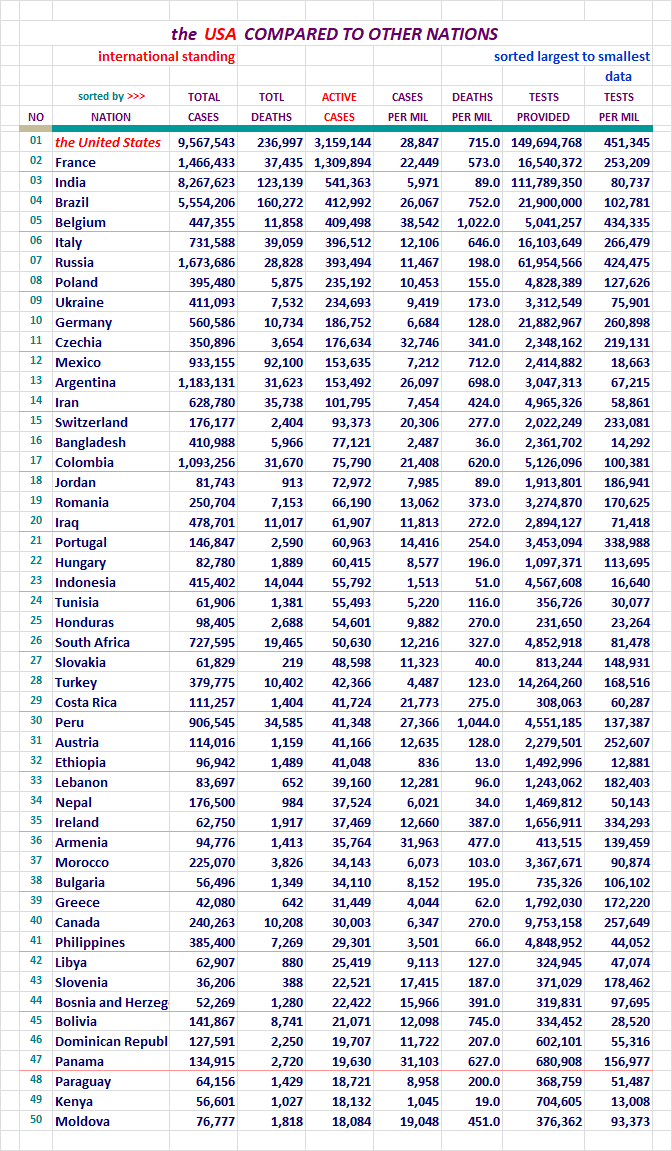
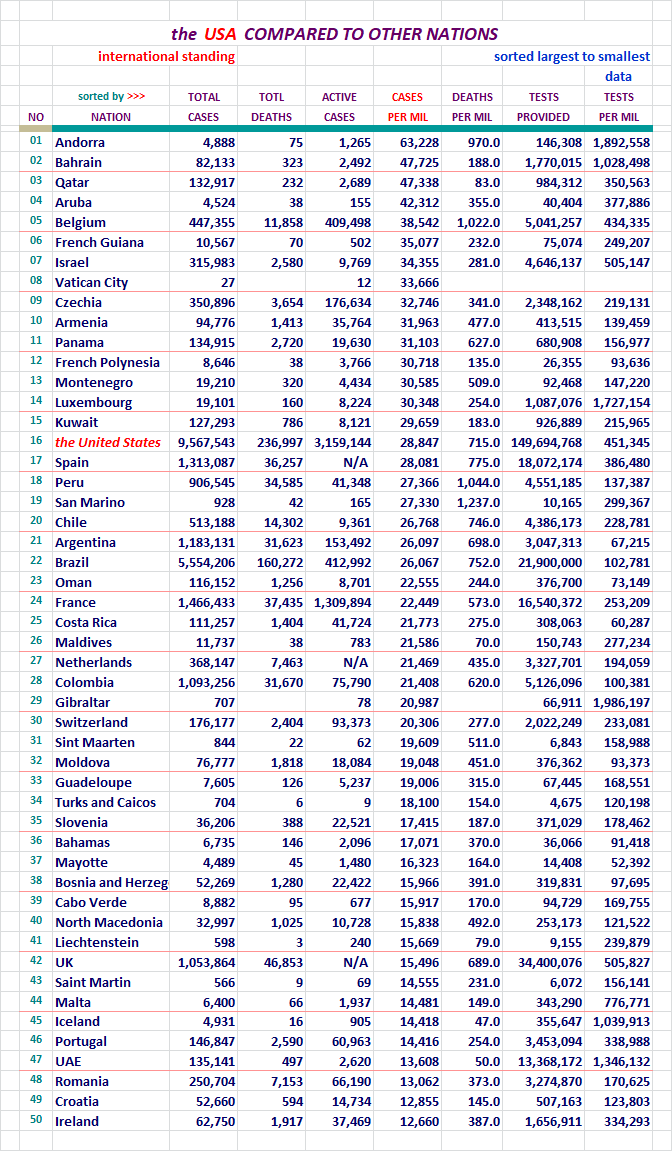
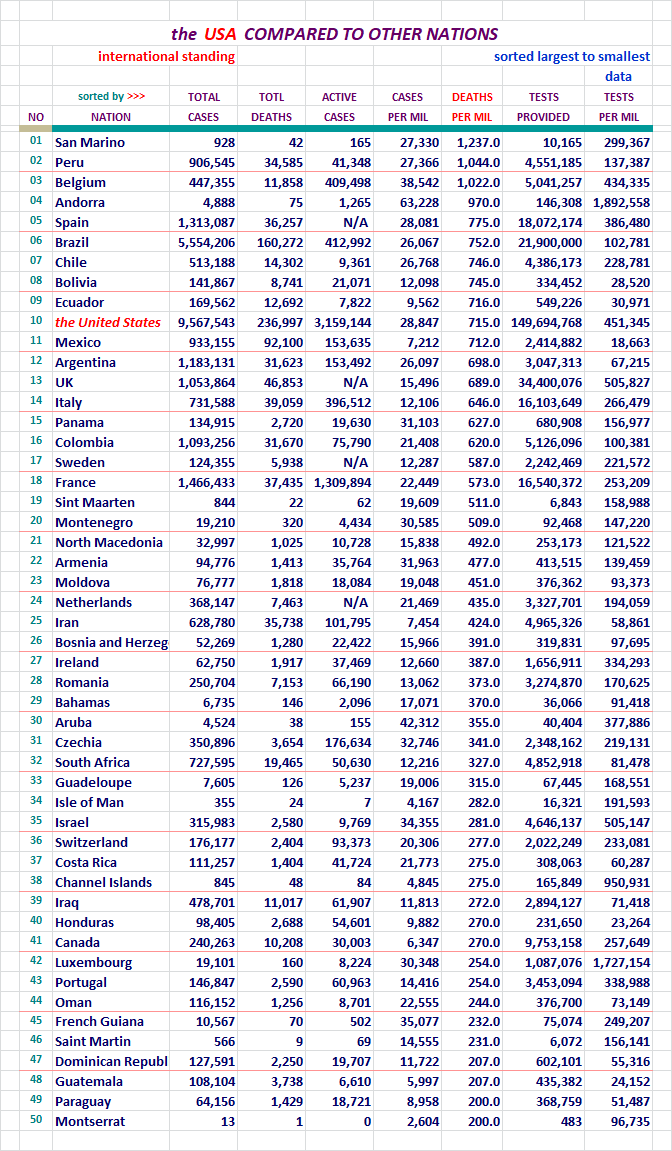
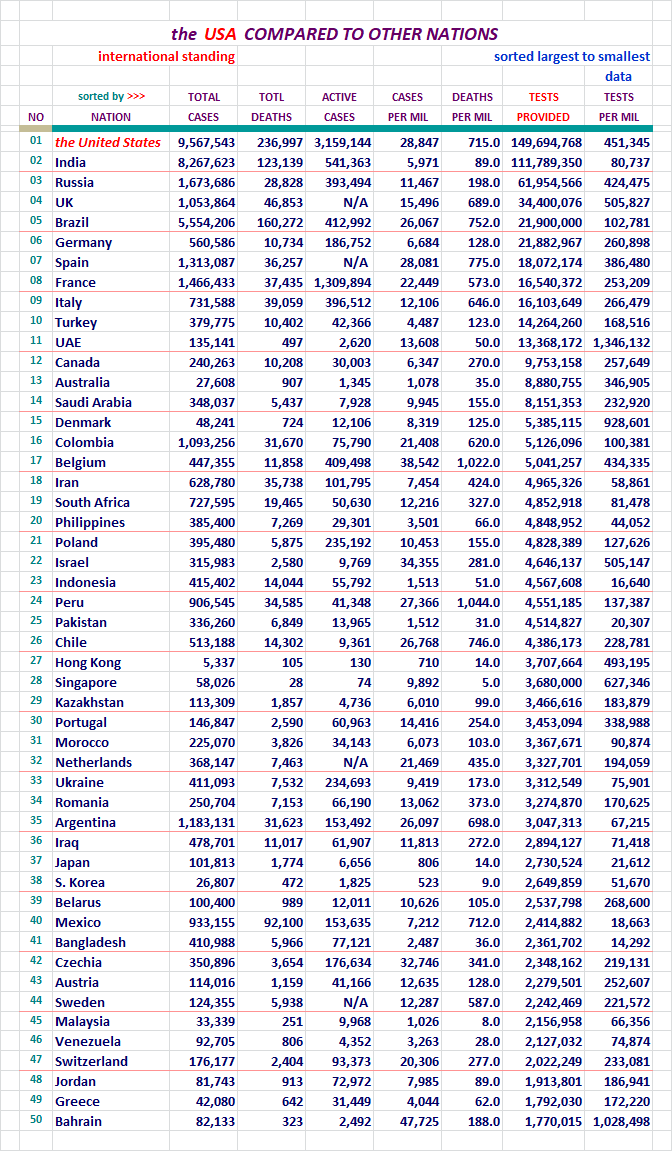
Section: 09
The United States, Where it Ranks With Other Nations?
Each of these pages is sorted differently. Look at the red header above
the columns to see which column was used for the sort on any given page.
The U. S. will be highlighted red here so we can find it easily in the list.
There was 215 nations on this list last night now. I didn't want to post
seven lists with 215 nations on it, so I picked the top 50. Coincidentally,
one report category had the U. S. at 41st, so it wasn't showing up on the
list with the 31 top nations on it. That wasn't the reason why I extended the
list length, but it did work out well.
I work on the nations right next to the states on my spreadsheet. The
states with the District of Columbia come in at a total of 51 lines.
I decided to keep the international reports near that length, and 50
was good enough.
Here we go... for your review.
For your review...
For your review...
For your review...
For your review...
For your review...
Around 06/23, China started putting out it's testing numbers. I thought
they were suspect. The number they put out was 90,410,000. Ours and most
everyone else's numbers are specific. For instance on 06/28, our number of
of tests at the ned of the day was 32,592,368. That specificity separates it
from the number China put out. It was rounded to the 10 thousandth place. In
addition, China did not update that number until 09/02/20. On that date they
raised the number to 160,000,000. As of October 3rd, 2020, they haven't updeded
it again. So I do not inlude China in the Nation's Comparison Sort regarding
Testing, and any place that reports out global testing numbers for a top level
comparison.
Please note that global testing on the Dashboard was only deducting China's
90,410,000 figure from 09/02 through 10/02/2020. I should have been
deducting the 160,000,000 figure, and all global figures during that period
were 69,590,000 tests too high.
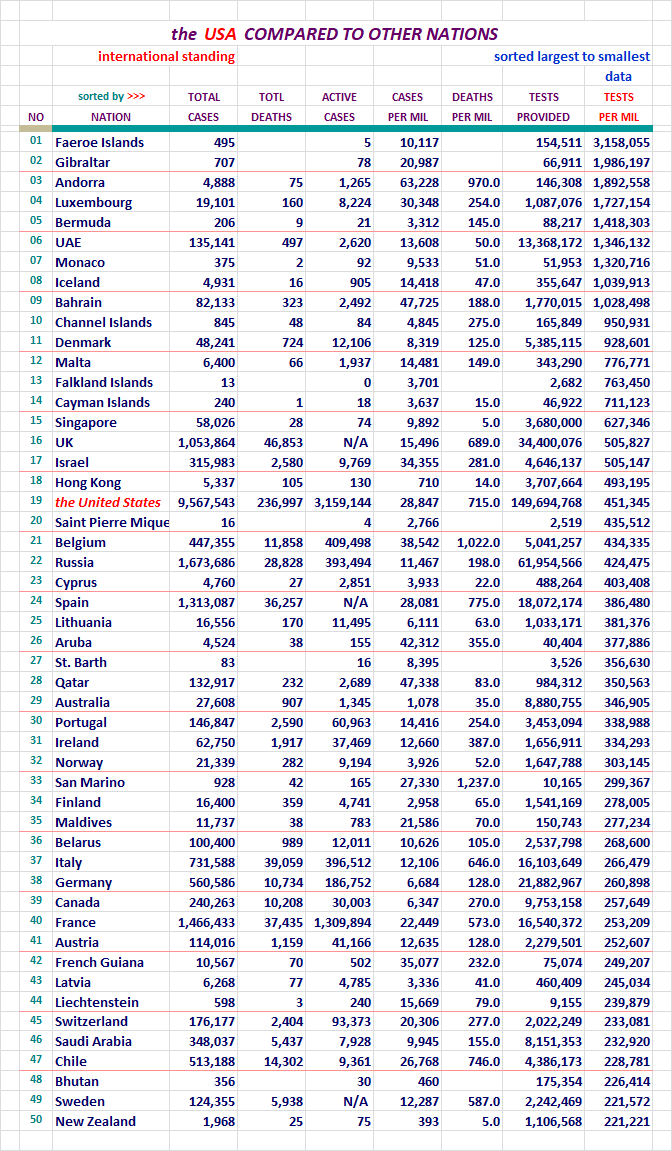
We remained in 19th place yesterday.
Section: 10
Here is what it is all about. From January 20th to the present.
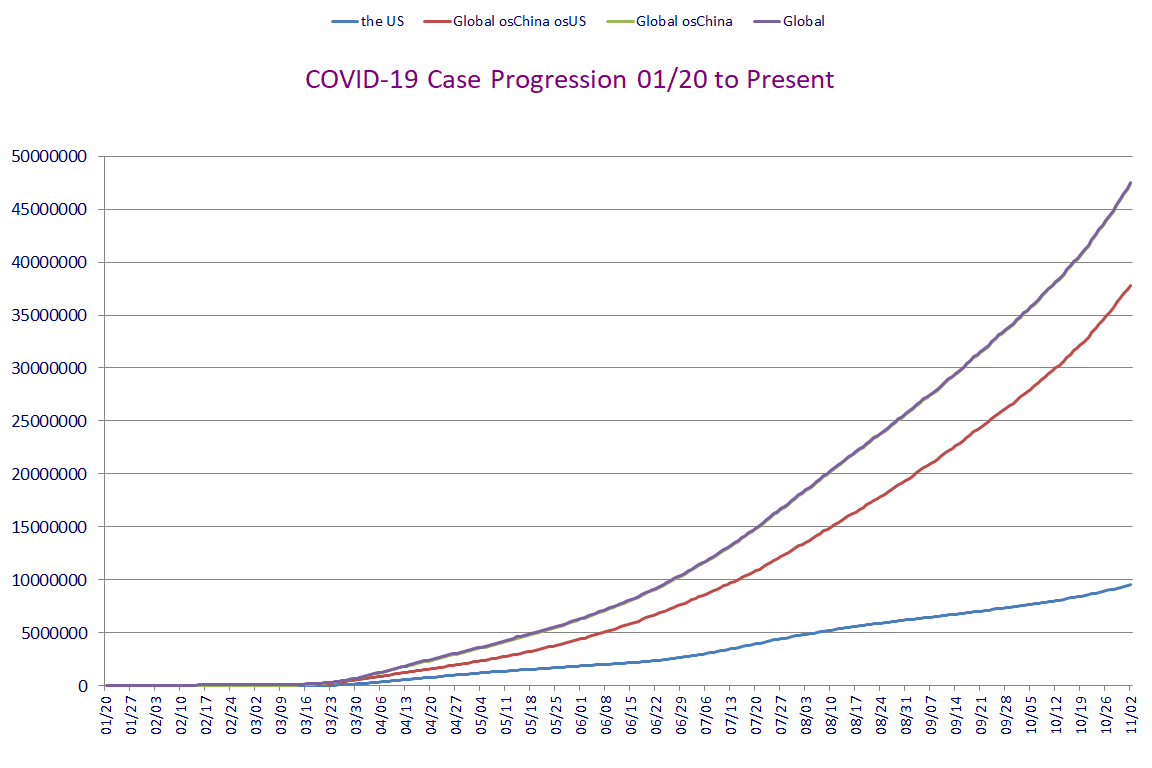
This concludes our look back at yesterday's data. Take care...

Section: 11
Data for this Report Sourced From:
LINK WorldoMeters
LINK Johns Hopkins University
The Center for Systems Science and Engineering (CSSE)
LINK United States Center for Disease Control - Provisional Numbers
Listed in the order of current utilization...
LINK You are Invited to Review My COVID-19 Spreadsheet (XLSX)
There is not an XLS version available for distribution at this time.
Section: 12
Other Features:
LINK US Counties200, States & DC51, Territories & Other Entities11, Nations219,
and the CDC Provisional Counts53
Five Excel Spreadsheet datasets you can sort for your own studies...
Section: 13
Links to other resources:
I cannot vouch for these sites. Please use your own judgement.
LINK Adventist Health Coronavirus Resource Hub - Scroll down for useful info
LINK Antibiotic Vitamin, the (Vitamin D)
Good article on Vitamin D's likely role in prevention of infection. Thanks Blam.
LINK CDC Data for Download - Scroll down - Excel required. Includes death stats.
LINK CDC National Center for Health Services
Provisional deaths as determined by review of vital documents. Much lower...
LINK CDC Secondary Data and Statistics - Portal Entry / Look around
LINK Coronavirus (COVID-19) Map
LINK Coronavirus infection risk may be reduced by Vitamin D
by Former CDC Chief Dr. Tom Frieden
LINK Coronavirus Spread Quickly Around the World in Late 2019, Study Shows
the University College London Genetics Institute
LINK COVID-19 Deaths Broken Out by Thirds, 05/07/20 Map of US Counties
Very revealing display of Concentrated Death Zones - thanks hoosiermama
LINK COVID-19 First U.S. Case, Treatment, features Remdesivir
New England Journal of Medicine article
LINK Cytokine Storm, med Actemra, Physician near death saved
LINK Diamond Princess Review at 634 Case Point of Eventual 712
LINK Hydroxychloroquine Article: International Poll
Daily Mail Reports, Most Effective Treatment According to 6,000 Physicians
LINK Hydroxychloroquine Has about 90 Percent Chance of Helping COVID-19 Patients
the Association of American Physicians and Surgeons, reports 91.6% of patients improved clinically
LINK IHME - Institute for Health Matrix and Evaluation
LINK National Institutes of Health - Cornavirus (COVID-19)
LINK Nasal Irrigation is the Key, COVID-19 Related
LINK New York City - interesting breakdown, borough, age, sex
LINK On the Origin of CCP Virus, A Documentary Movie (turn up the sound)
Epoch Times: I highly recommend this very well documented report.
LINK Rt COVID-19
Calculates and displays the Rt Factor for each state. Thanks FreedomPoster.
LINK World Health Organization

Nobody will care about the KungFlu tomorrow.
COVID is over starting tomorrow...
Pennsylvania Nursing Home (LTC) death stats for November 3
Data from PA Department of Health as of midnight November 2-3
LTC deaths = 5816 (increase of 6)
Total deaths = 8855 (increase of 42)
Cumulative LTC deaths as percentage of total = 65.7%
An Election Day miracle! LTC deaths have dropped to a percentage not seen since October 24. /s
COVID is a scam.
This is an enormous effort on your part and I admire and appreciate all that went into this.
That said, I know more people that had to pets down this year than caught or died from ChiComFlu.
Facts and figures won’t sway anyone. Wearing a mask has become the epitome of Virtue Signaling.
When Fear becomes a Virtue, the ignorant will do all they can to keep that Fear alive.
I’m a veteran and COVID survivor. The Communist Chinese Death Plague is very overrated.
Knew a few other friends that caught it. One person was young (low 20's) and it hit him hard, but they recovered. He was exposed at work in a mall where another employee had it.
The Chicom Cooties is overrated. If you get sick, stay away from MeeMaw and PeePaw, just like you would with the common cold or the measles.
Good news to hear. We take vitamin D3, Quercetin, Zinc and multi-vitamins besides. So far so good. I’m 62.
Has anyone postulated why the present European “wave” (cases OR fatalities) is increasing so much more rapidly than the US?
My impression of Europe is that for the most part it is a little further North than the U. S. I think it gets a bit
more cold, and this virus seems to do well in cooler
weather.
That’s off the top of my head. I may be wrong about Europe
being a bit farther North.
Perhaps someone else will weigh in.
You may want to post your question again on today’s
thread.
Thanks for the reply, but, in fact, most of Europe’s climate is actually a bit milder / warmer than that of the continental US. There is quite a bit of good discussion of this online if you wish to check.
Thanks Paul.
I wouldn’t be able to provide another reason for a cause then.
I have for some time now wondered if someone was spreading
infection by some method. I guess that is another reason,
but I’m not backing it fully.
There is talk about how viruses present in waves, and that
seems to be what is taking place here naturally, or perhaps
not.
Hi, D1,
Thanks all the more to you for these threads!
Over on the Garden Thread I’ve received a little good natured ribbing for sometimes posting questions and then coming back later and answering my own questions. :-)
Of course, sometimes simply(?) expressing the question in writing to others can assist oneself in analyzing it a little differently, point toward new sources of information, etc.
Note to anyone not familiar with my earlier posts on many threads: This is NOT a comparison with Asia. Asia, even excluding China, is a whole ‘nother ball of wax. And, again, my focus is on fatalities, not “positives”.
In this case, I have no major new insight, but I do think these are “possibles”:
1) I agree about the waves, but there still has to be a reason behind the timing and intensity, IMO. Random chance / “bad luck” could be part of the timing, I suppose, but does not explain the intensity. Granted that our wave could still undergo rapid intensification. I hope not, but, no matter how one distributes them over recent days, the GA fatalities numbers are not encouraging.
In any event, I don’t put a lot of stock in “bad luck” with something like this.
2) Despite efforts by the Left to quash it, Americans still retain a little more of a heritage of individualism than do Euros. Perhaps that shows up in subtle or not-so-subtle ways in how we interact socially, enough to affect COVID-19’s transmissibility.
3) My brother who was in parts of Europe in his military service days (multiple tours) says one really has to go about some of the Euro cities extensively to understand how packed in they are @ street level, effectively, compared to ours.
4) Mitigation fatigue.
5) Different strain(s) of the virus.
6) Less resolve / effort to protect or treat the elderly. (Fatalism?)
7) Medical system quality.
8) Sort of related to “4” and “6”: Less prayer.
Disclaimer: Opinions posted on Free Republic are those of the individual posters and do not necessarily represent the opinion of Free Republic or its management. All materials posted herein are protected by copyright law and the exemption for fair use of copyrighted works.