
Posted on 10/11/2020 8:11:33 PM PDT by DoughtyOne
PING LIST - Please contact me as needed...
COVID-19 Update # 207
As of 10/10/2020 23:15 PDST United States CDC - Provisional Numbers
As of 00/00/2020 23:45 PDST Johns Hopkins University - Capture Nations Informaton
As of 00/00/2020 23:45 PDST Johns Hopkins University - Capture Counties Information
As of 00/00/2020 23:46 PDST Johns Hopkins University - Process JHU Data
As of 00/00/2020 23:59 PDST WorldofMeters - Document Core Numbers
As of 00/00/2020 23:59 PDST WorldofMeters - Capture Nations Information
As of 00/00/2020 23:59 PDST WorldofMeters - Capture States Information
As of 00/00/2020 00:00 PDST WorldofMeters - Data Processing begins...
As of 00/00/2020 ??:?? PDST Publish COVID-19 Update - 00/00/00
Thank you for stopping by to check out the COVID-19 Update.
Here you can find...
Section: 01 Commentary, Special Reports, COVID-19 Update Info, & System Notes
Section: 02 the United States Situation
Section: 03 the Global Community Situation Outside China
Section: 04 the Global Community Situation Including China with reservations
Section: 05 the Mortality Report
Section: 06 Miscellaneous Reports of Interest
Section: 07 the United States, Counties (alphabetical / case no descending)
Section: 08 the United States, States Ranking, Provisional Numbers, & Territories
Section: 09 the United States, Ranked with Other Nations
Section: 10 the End of this COVID-19 Update
Section: 11 Data Sources and a Link to My Own Spreadsheet
Section: 12 Linked Spreadsheet: Counties, States, Provisional, Territories, & Nations
Section: 13 Links to Other Resources
Section: 01
Commentary, Special Reports, and COVID-19 Update Information3
Interesting Tid-bits (hopefully)
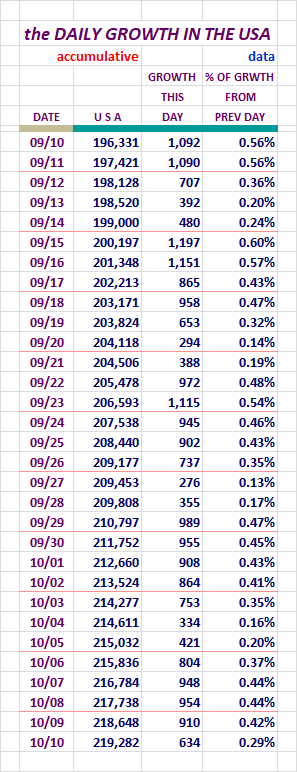
Fatalities and New Cases in the United States
Fatalities fell off by 276 cases from the previous day, to come in at 634
yesterday. That was a 15.80% decrease from the same day the week before.
New Cases fell off by 9,688 from the day before, to come in at 51,027
yesterday. That was an 0.96% decrease from the same day the week before.
Fatalaties and New Cases on the Global Scene
Fatalities fell off by 1,132 cases from the previous day, to come in at 4,752
yesterday. That was a 1.21% increase from the same day last week.
New Cases fell by 2,507 cases from the day before, to come in at 358,038
yesterday. This was a 17.52% increase from the same day the week before.
Global Recoveries Pass New Milestone
Global Recoveries have gone up over 28 million cases now.
Section: 02
The Following Addresses the Numbers Here in
the United States of America
Here we go...
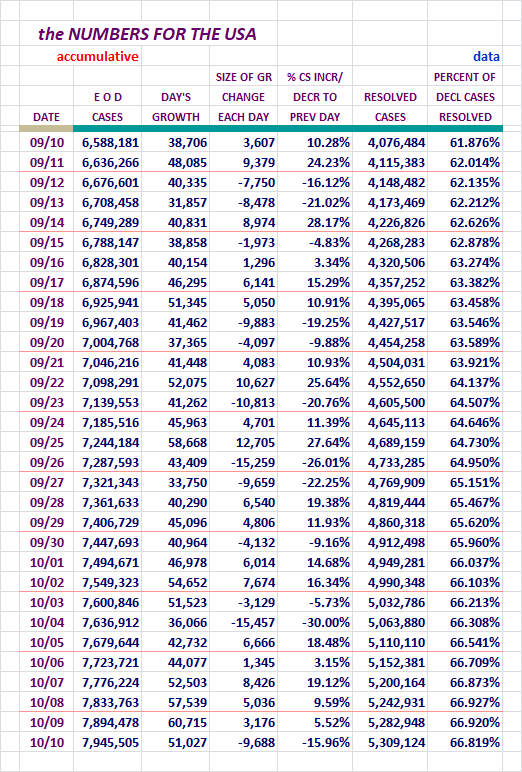
New Case Declarations fell off by nearly 9,700 cases yesterday.
Please take note of the Resolved Percentage level on the right.
It dropped again yesterday.
It's significant enough now to take note of it daily.
Concept of adding in Active Cases and Serious Critical here, courtesy of amorphous
Here are more of our numbers...
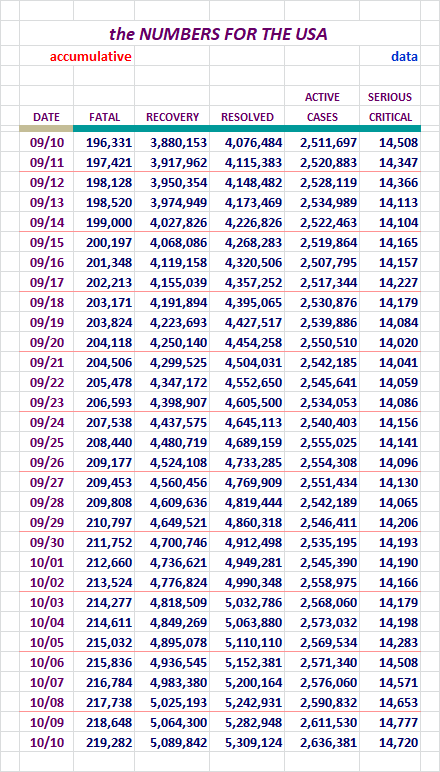
Active Cases concinue to grow, and Critical Cases dropped by 57 yesterday.
Our Slice of the COVID-19 Pie
The growth of our slice of the pie has been decreasing recently.
Here are the numbers I've been tracking, Globally Declared and Active Cases.
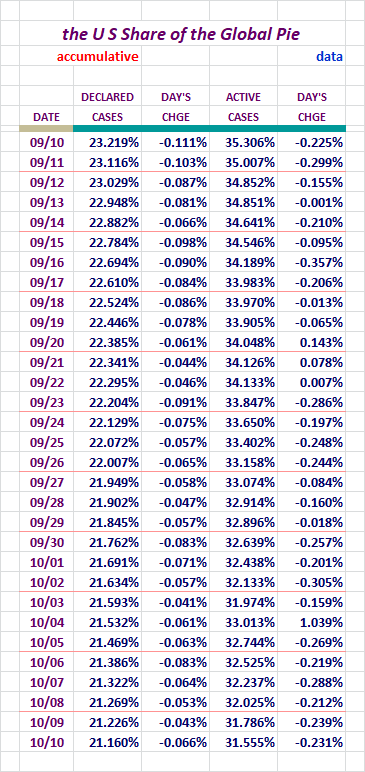
I had to revise the figure on the right there, for the day before yesterday.
I noticed a clerical error, which flipped the standing for the day. The last
two days now show that we were better in both categories on both days.
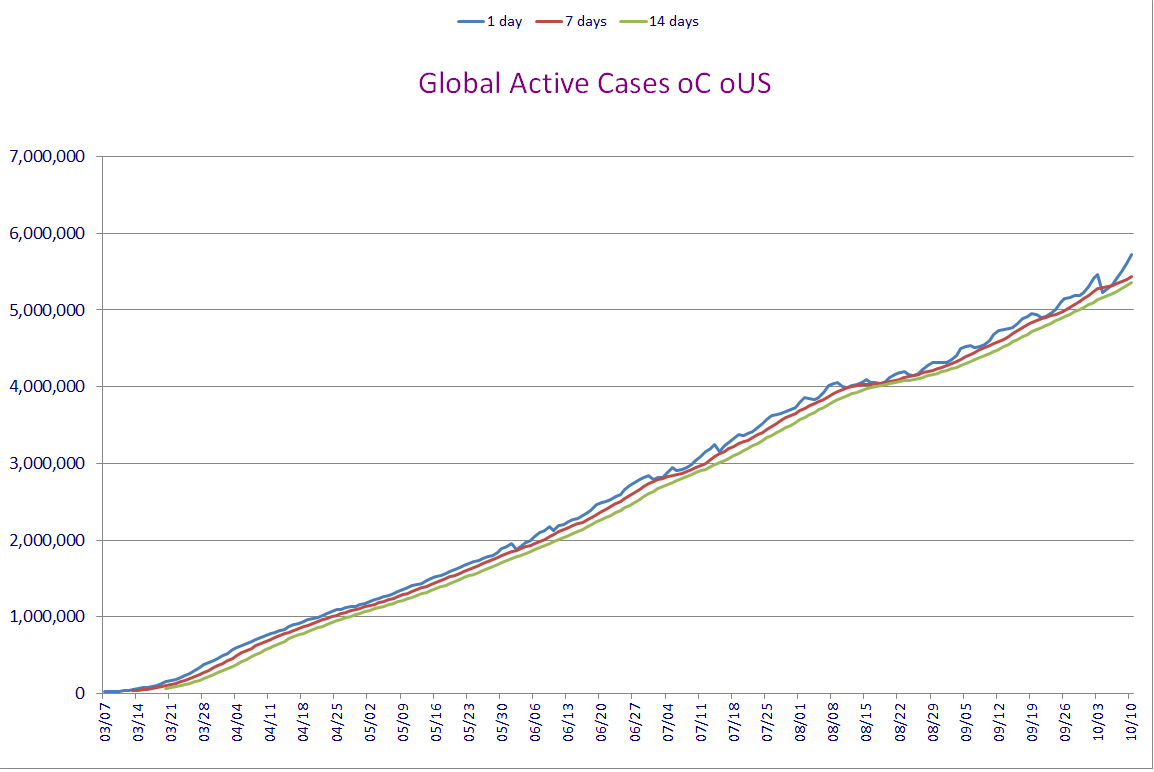
Active Cases in the United States / Chart
Unlike some of the other charts here, we should see a good rise and
fall at some point withone.
Note that this presents the single, seven, and fourteen day averaging versions.
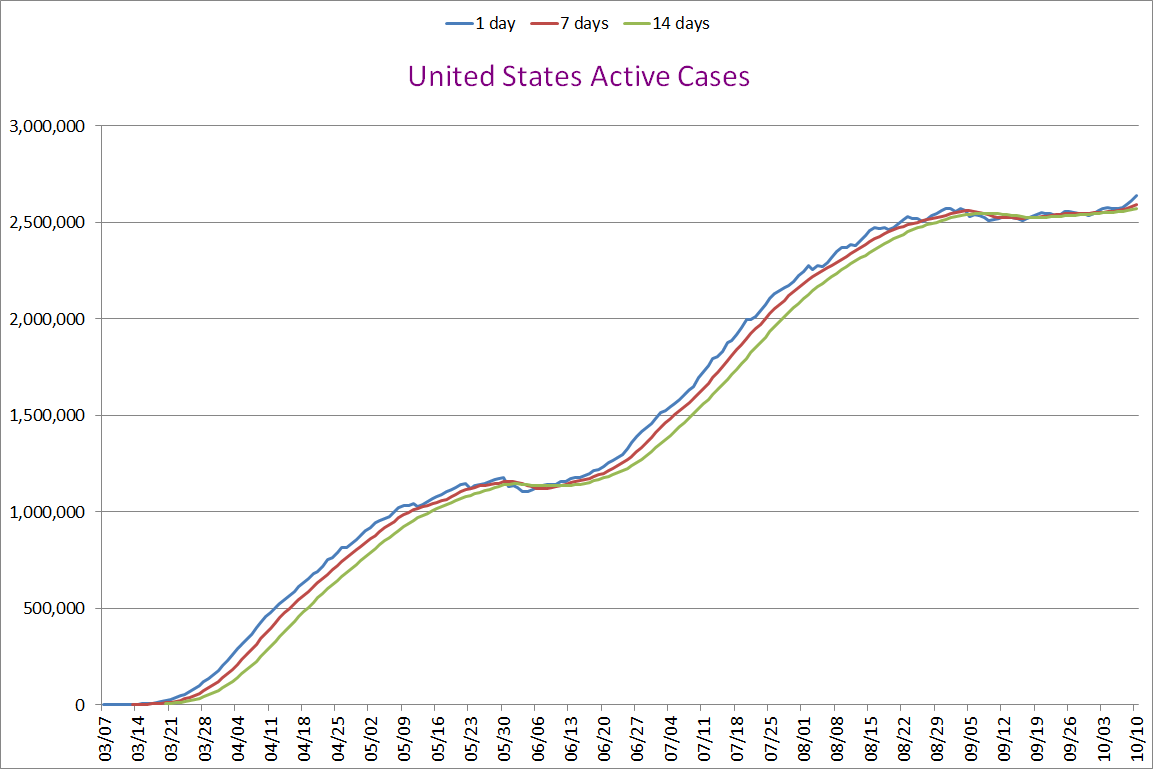
Remember, these are not new Declared Cases. These are remaing Active Cases.
Active Cases rose yesterday. The chart is showing signs of rising. We are
at our highest level of Active Cases now, and with our numbers climbing up
again, that is likely to increase.
The question is, where do we go from here? Are we positioning for a third
wave or are we going to start moving down in earnest? We'll soon find out.
In the last few days, Active Cases have risen a little. i'm worried about a
third wave right how. Globally the cases are hot, and our numbers are up a
little also. Right now our average daily cases are higher than they have
been in seven seeks. I'm not sure how far beyond that it goes back.
Fauci has let it be know, he still thinks were on the first wave. He may be
right. I'm not sure what the scientific requirements are to declare a wave
over. If it settles down, that seems like an end to me, and the chart looks
for all the world like a second wave to me. Now I'm seeing troubling signs.
Testing and New Case Figures
Requested by stocksthatgoup
Some folks have shown an interest in seeing the COVID-19 Test figures compared
to the New Cases being declared. The following Data addresses that. The size
of it just doesn't seem reasoned to me.
Why/how could the posive portion of the popoulace vary ass much as 2.0% from day
to day? I could a lot easier see a 2.0% trend over three or four days. One day?
Nah.
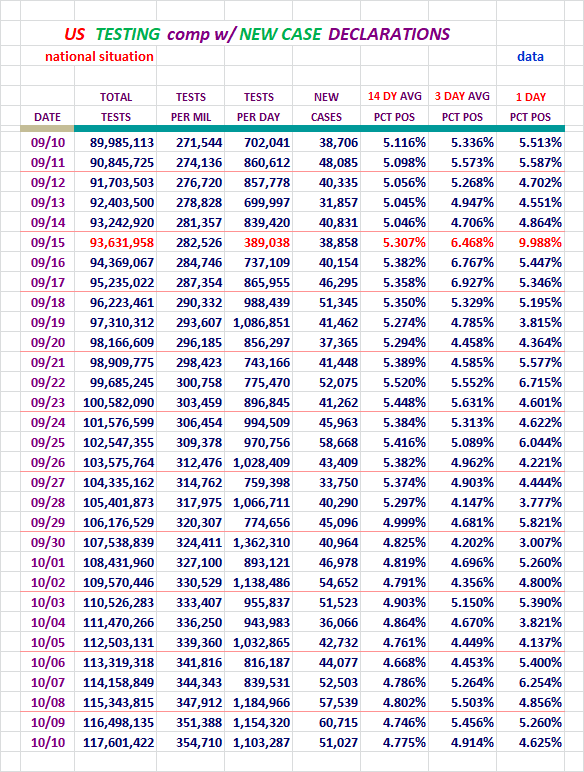
Testing fell off a small amount again yesterday. Figures are still looking
good here. The 14-day is hanging in the 4.65 to 4.80% range.
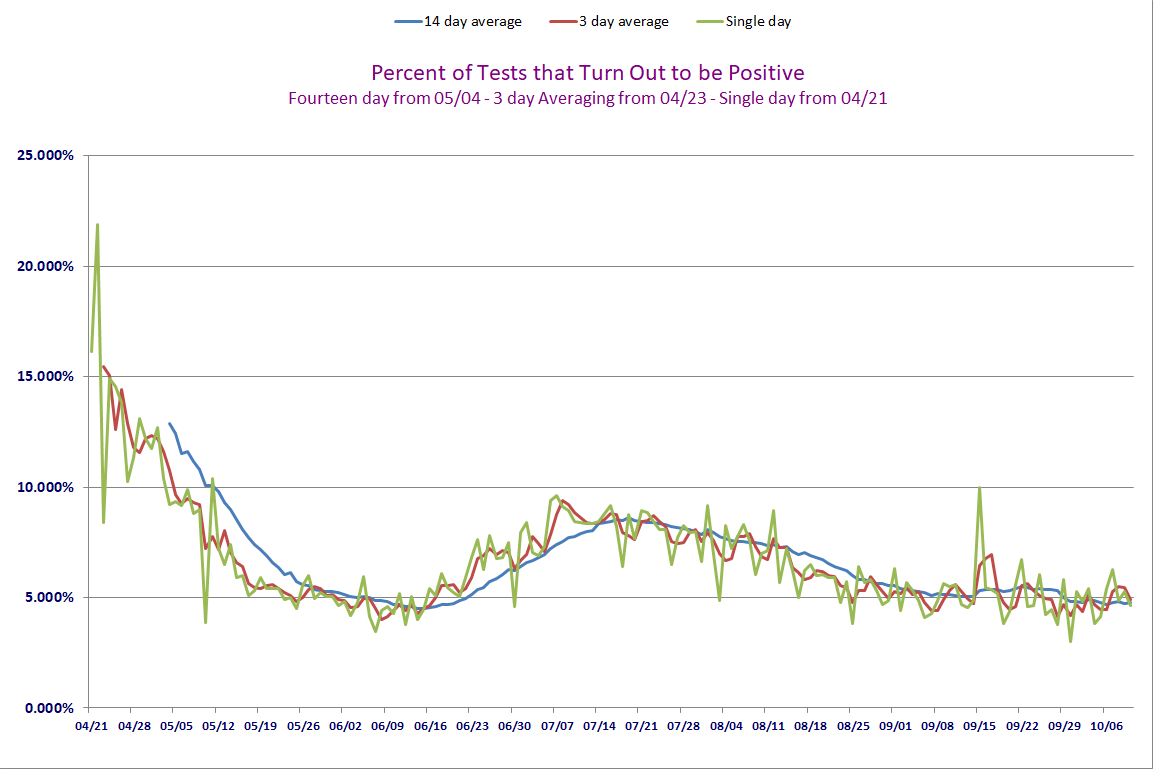
Just another day in paradise yesterday. Sure would love to see a drop down
below 4.00% right about now.
The U. S. Stats / w 10 Day Averaging / Fr: 03/17
Requested by: Texas Eagle
This data and chart presents things in a little different way. In the
chart it is easy to see the relationship of these numbers. I may be wrong
not to do so, but I don't plan to put much weight in those figures for a
few days until they normalize.
The Chart will use the data all the way back to 03/17, but the data displayed
here will only go back one month.
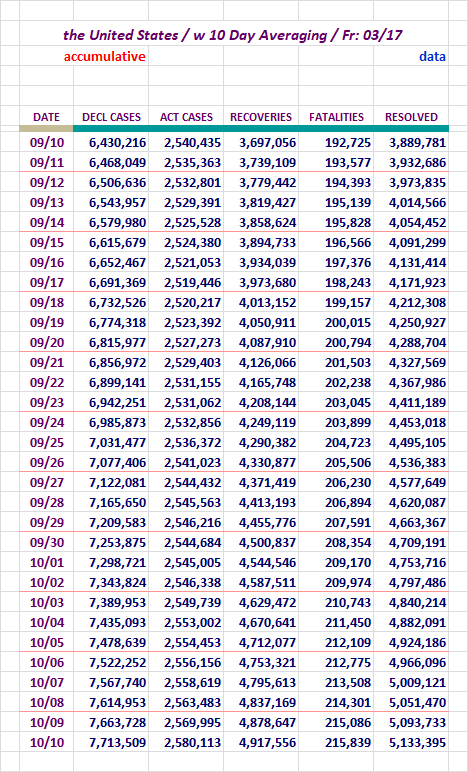
Here is the chart to match.
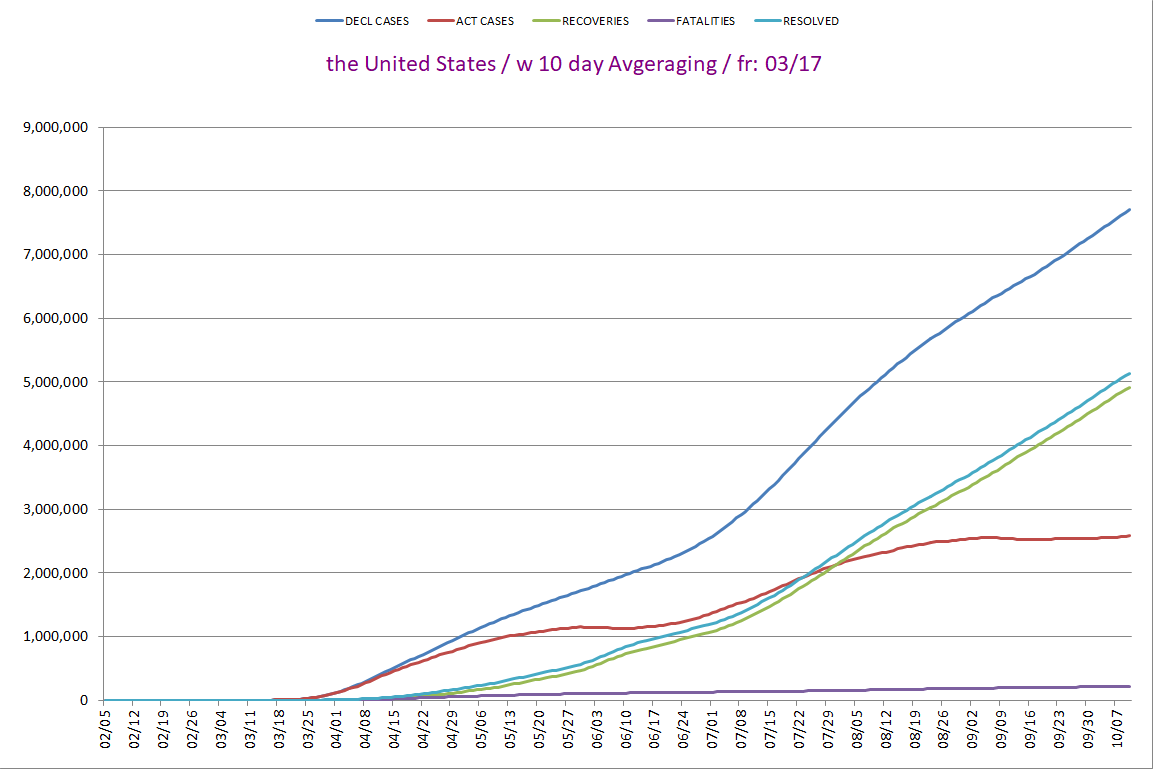
The New Case Declarations line is moving on up.
The Active Case line has flattened out, with a small bias upward.
If this weren't a ten day averaging line, we might see more of an
increase in it's trajectory.
I have been saying I wasn't too happy with the Recoveries and Resolved Cases
lines there. At the present time they don't seem moving toward flattening any
longer. They may show some strengthling almost imperceptibly.
Compare to the rise of Recovered and Resolved cases on the Global Scene to see
a different more healthy trajectory. These look lethargic by comparison, but a
a little less so.
You can right click view to see the Global Chart enlarged.
United States Movers and Shakers...
I will present the U S States with the most New Cases and New
Fatilities rankings.
Here we go...
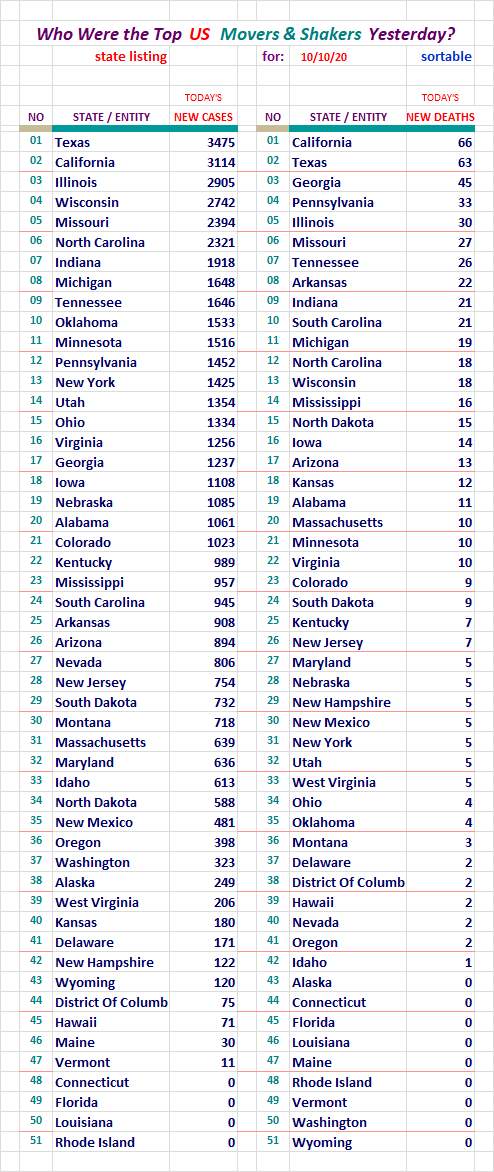
Texas and California took the top spots yesterday.
Section: 03
The Following Addresses the Global Numbers
without Mainland thereChina
Here is the first set of Data for the Global Outside China
Territories
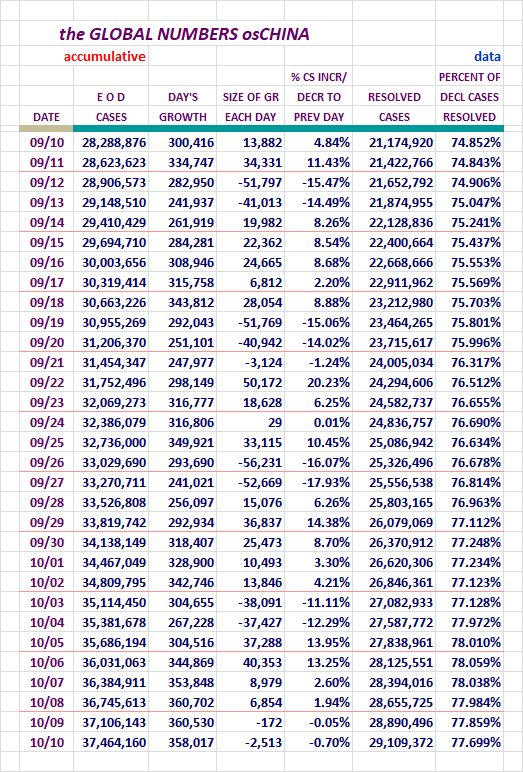
New Case Declarations fell off a very small amount yesterday. Every day
Monday through Friday was in excess of 300 thousand.
The Resolved percent came in at 77.699% yesterday, a hair down from the
previous day. It has reversed directions and has been trending lower recently.
Fatalities, Recoveries, Resolved, Active Cases, and
Serious/Critical Cases - Globally, Excluding M/L China
Concept of adding in Active Cases and
Serious/Critical here, courtesy of amorphous
Here we go...
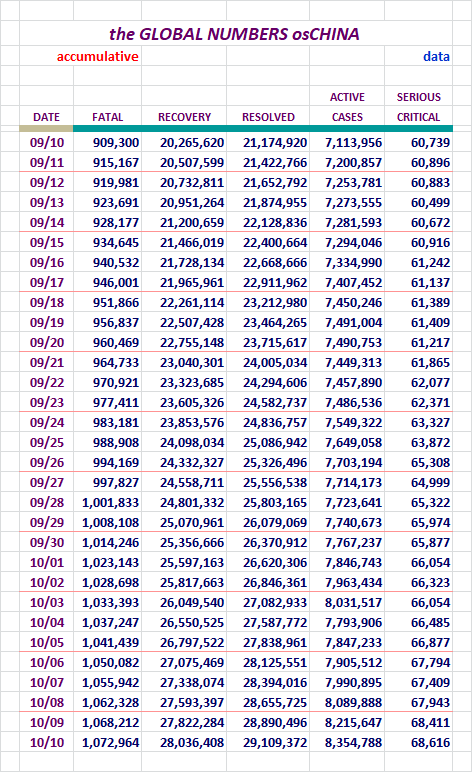
Active Cases rose by around 139k yesterday. Serious/Critical cases grew
by 205 cases.
How is the Global Community Outside China Doing,
Without U. S. numbers?
Let's see...
The important number here rose up yesterday. The Global numbers remained
high but the United States number fell. For this reason the Global area
carried more of the weight, setting a new record in this area.
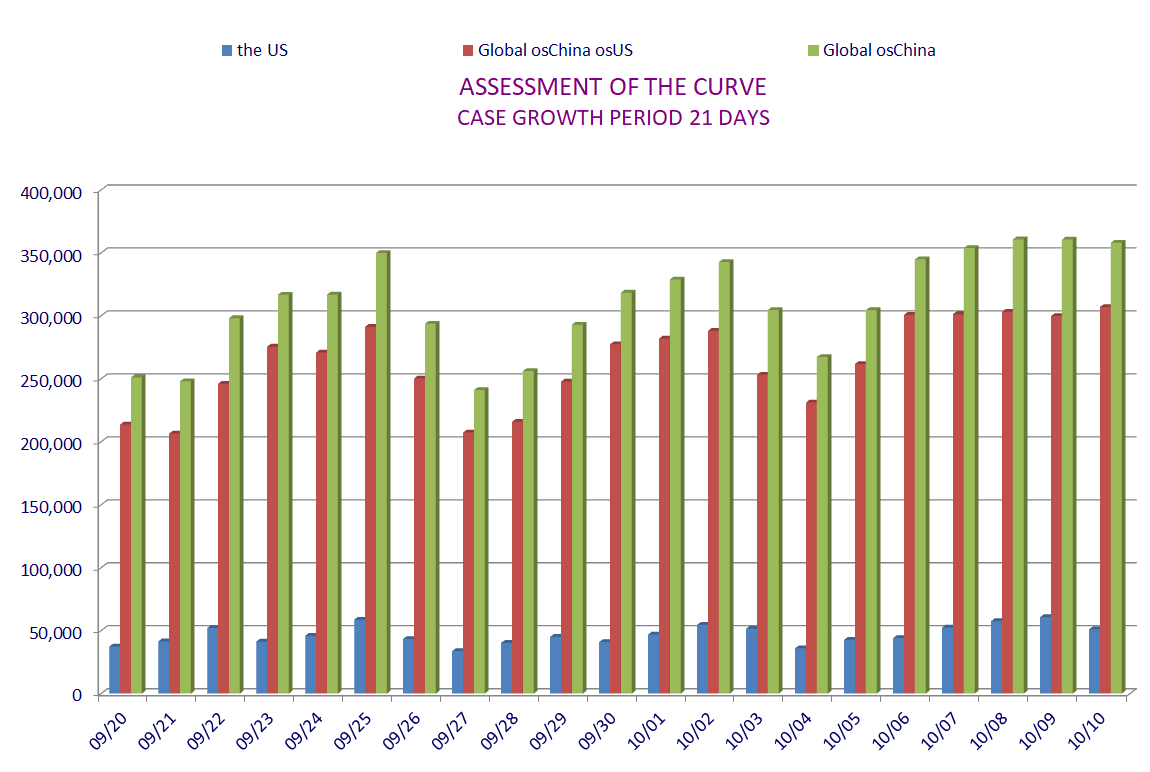
The last five days have been pretty brutal.
The blue depicting New Cases, has leveled off. Hopefully it's having
reservations about it's decision to go up. Wish it was that simple.
The Active Cases outside China Globally / Chart
As in the United States' version of this, we should see a good rise and fall at
some point these two.
Note that these present the one day and then 7 and 14 day averaging versions.
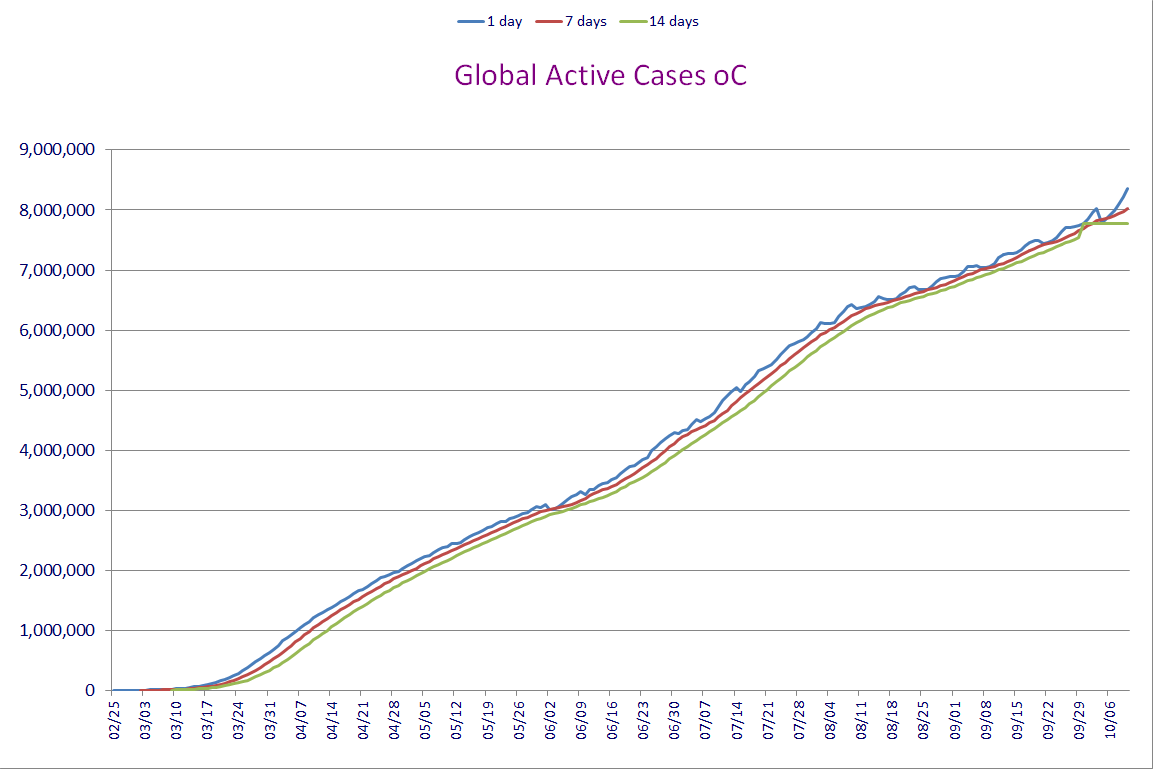
The two charts above had looked like they were revealing flattening, but as
the days went by, they began moving upward again.
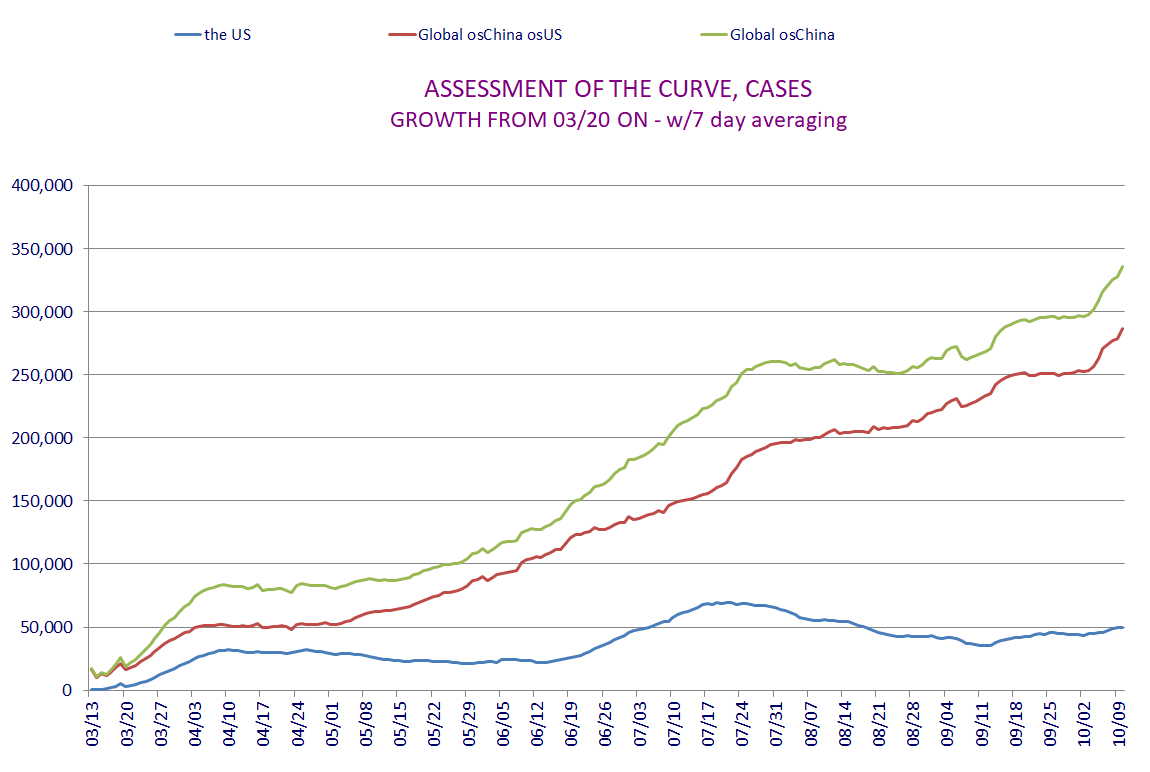
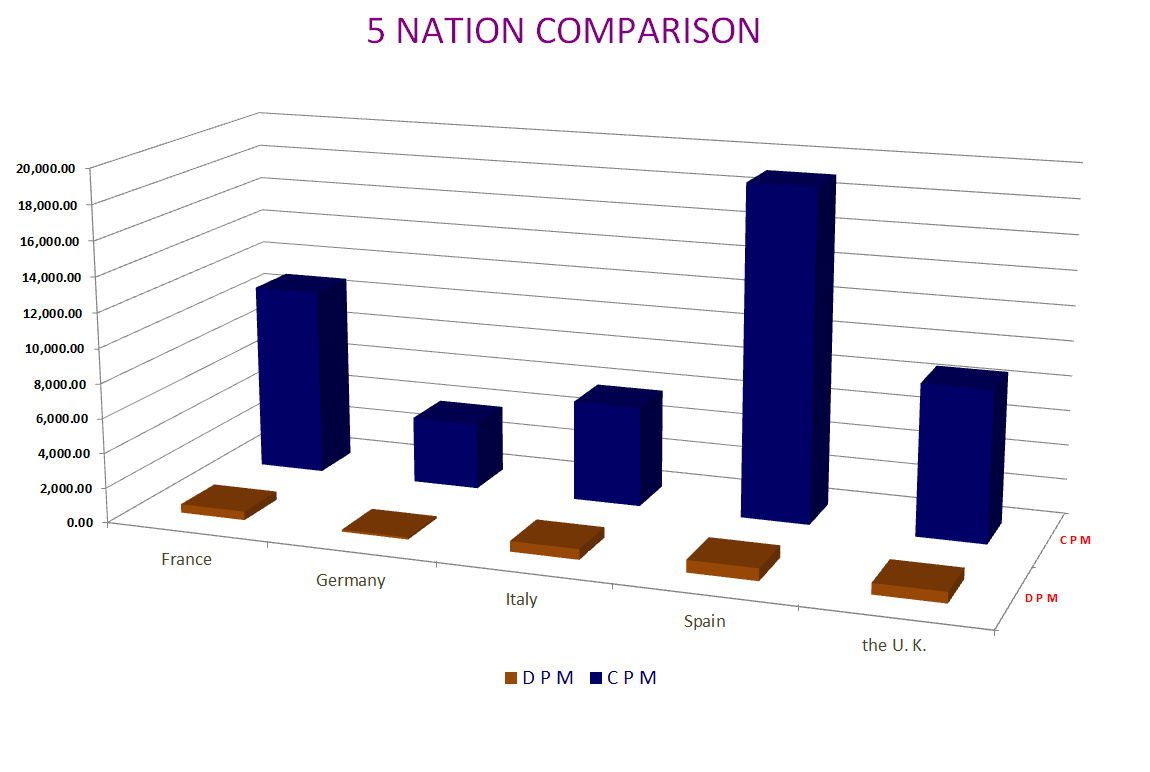
Special Section on France, Germany, Italy, Spain, and the U. K.
Case growth.
Jim Noble mentioned he'd like to see the US numbers added here. I added them
in on 06/21/2020. I did not add them to the chart because it would have
dwarfed the European nations chart lines. (they would have been reduced to
about 15% of their normal size)
Let's Look at Some Numbers in Five Day Increments:
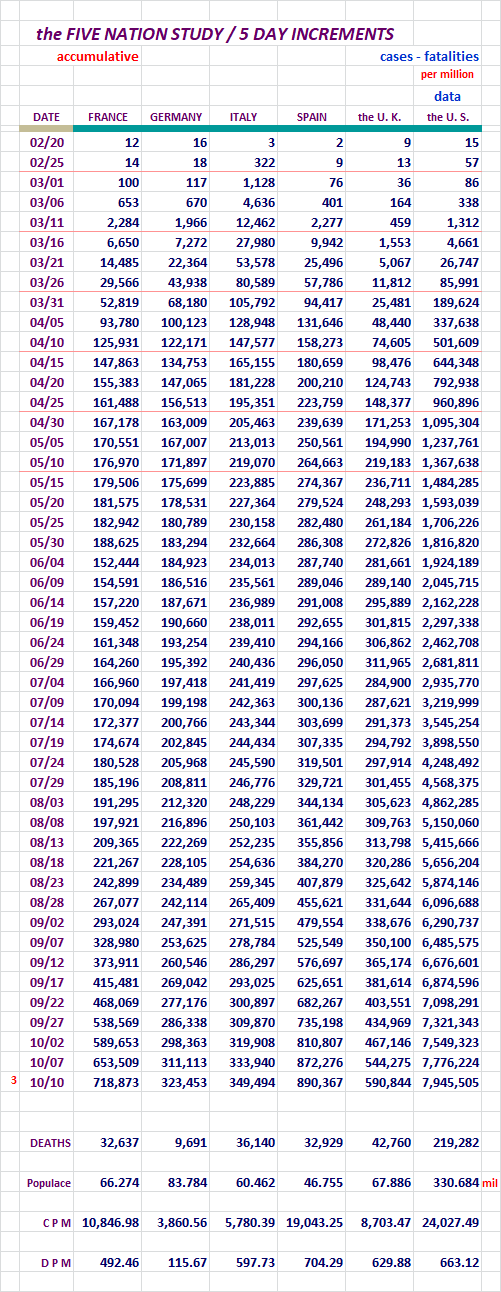
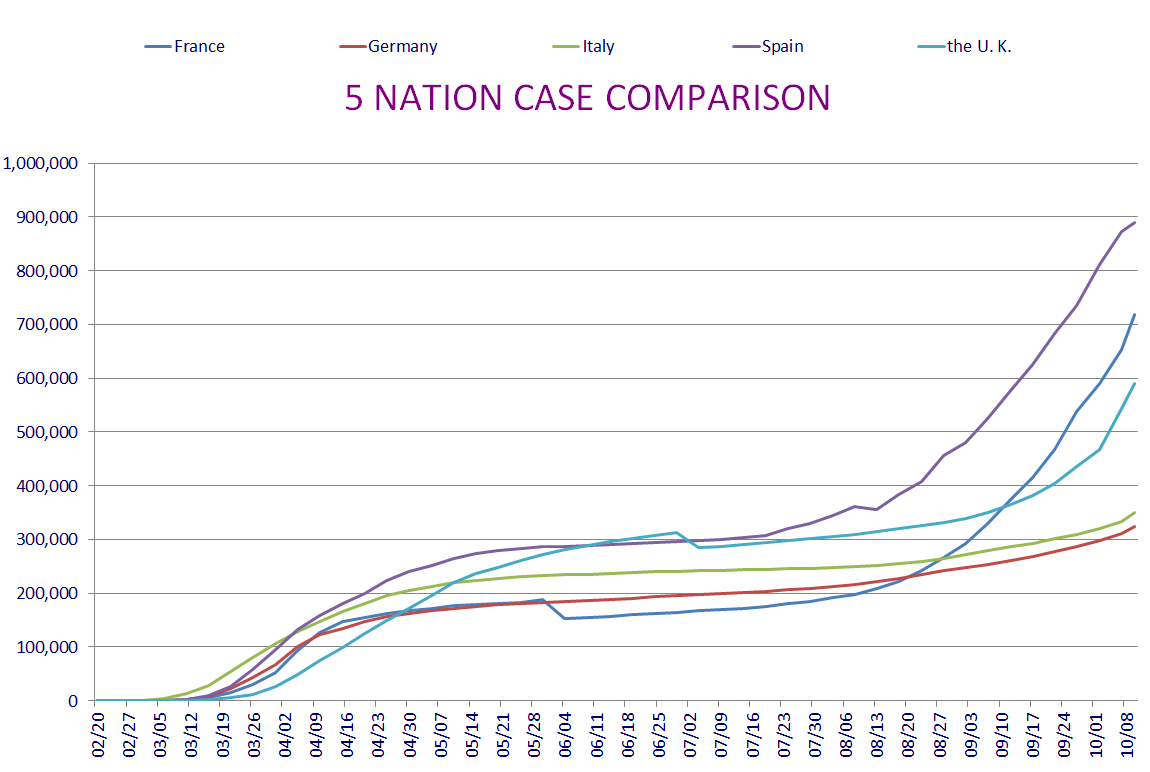
Is that a glimmer of hope for Spain? I certainly hope so. There appears
to be a correction showing up. The next day or two should tell...
France is still going up at a rapid rate.
To be honest, it looks like all these nations are showing an inclination to
move up.
Sweden and It's Neighbors, Who Has the Best Tactic Against COVID-19?
Sweden is doing its own thing with regard to isolating. I think most people
are aware of it by now.
Here are some numbers to help us look at this issue.
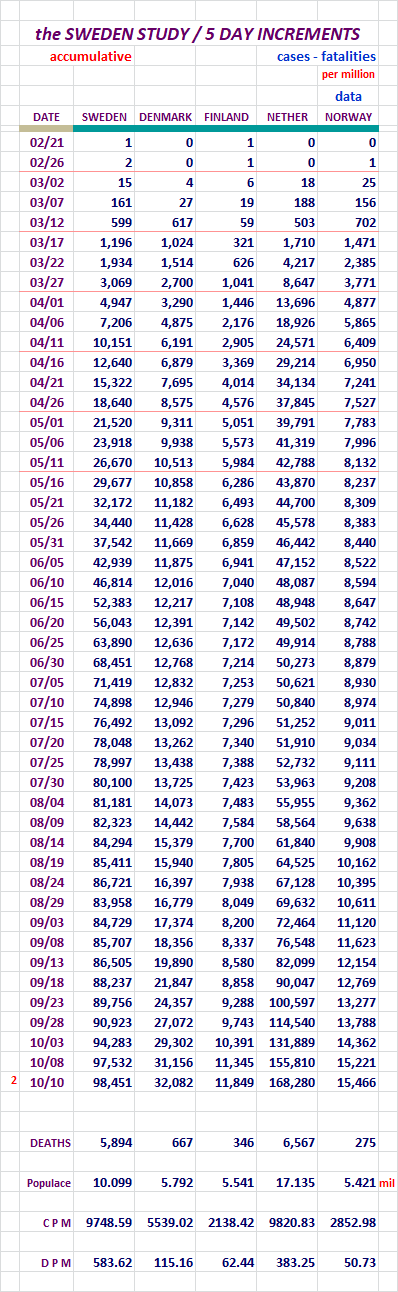
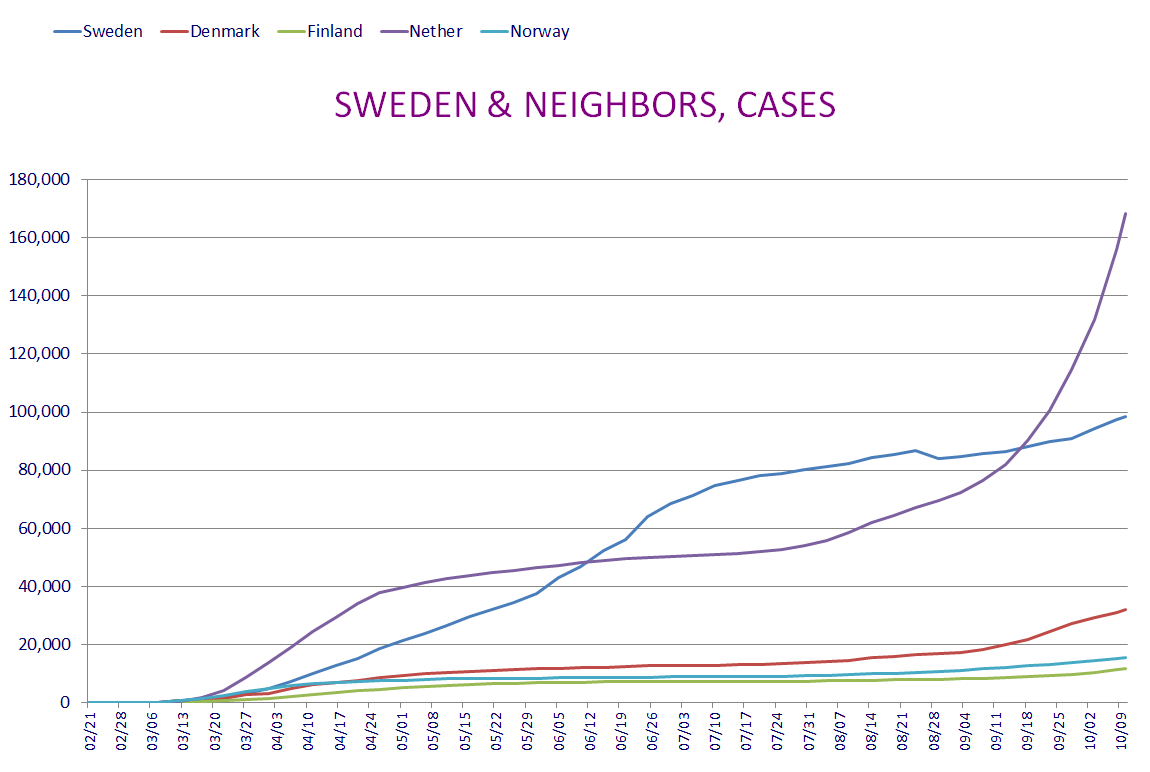
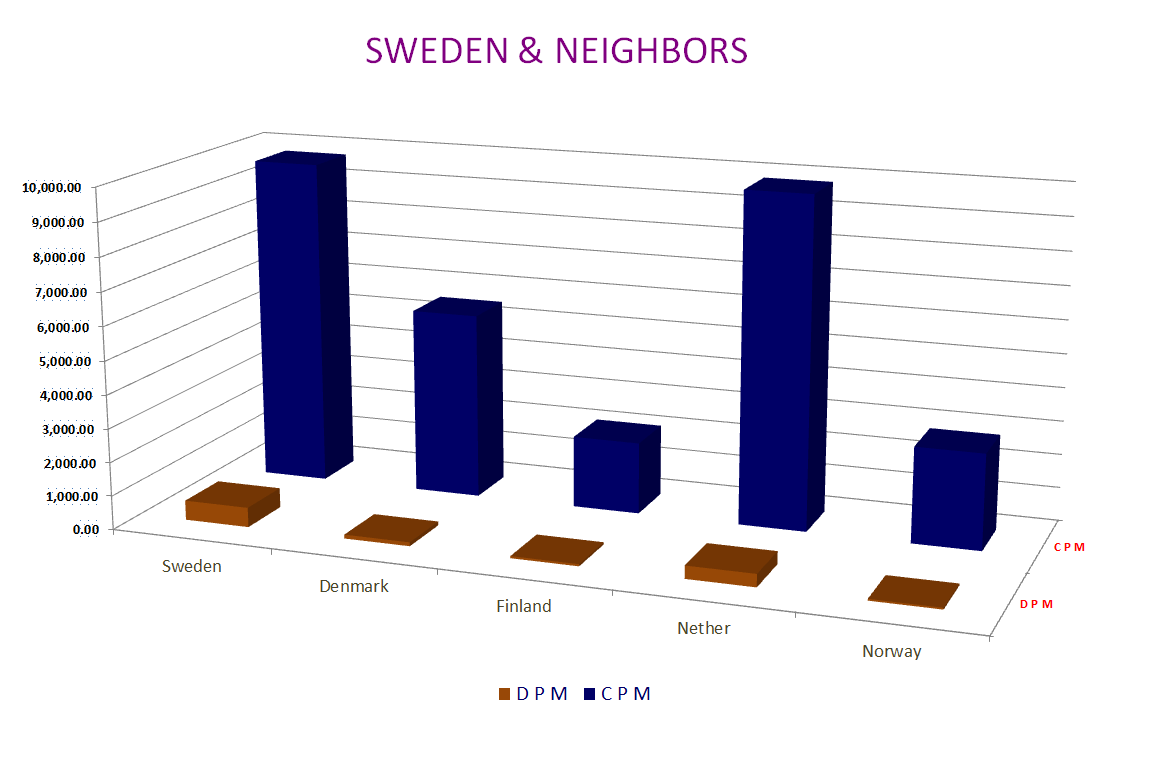
Sweden has flattened out a bit after that correction a while back.
The Netherlands is just going ballistic.
We do need to keep it in perspective though. While the raw numbers do show
the Netherlands to be going orbital, the per million figures are still a lot
less than Sweden's.
Global Movers and Shakers...
I will present the top fifty nations with the most New Cases and New
Fatilities.
Here we go...
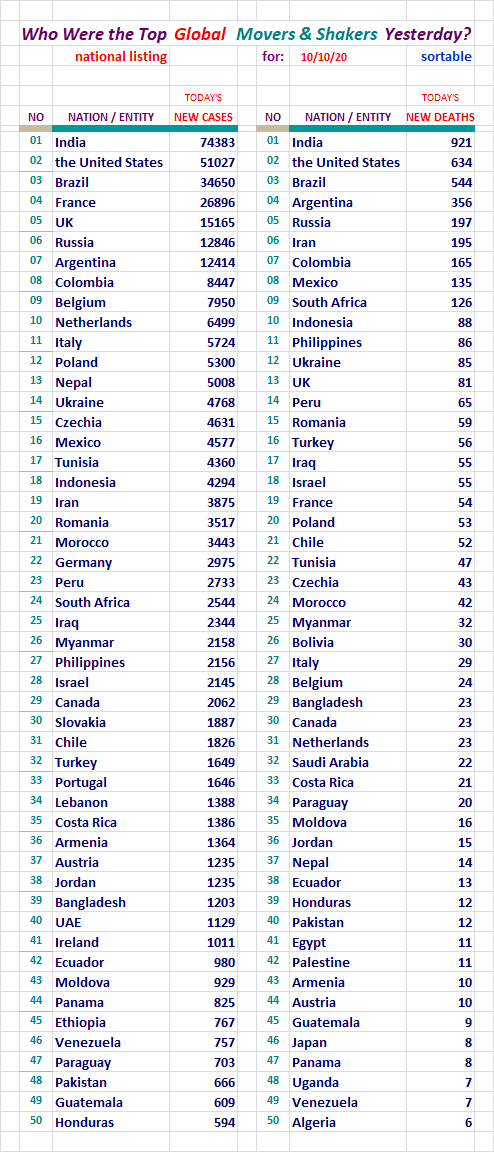
India led out in both categories yesterday. It's margins of lead were
declining gradually. The United States New Cases dropped yesterday, wo
the margin broadened.
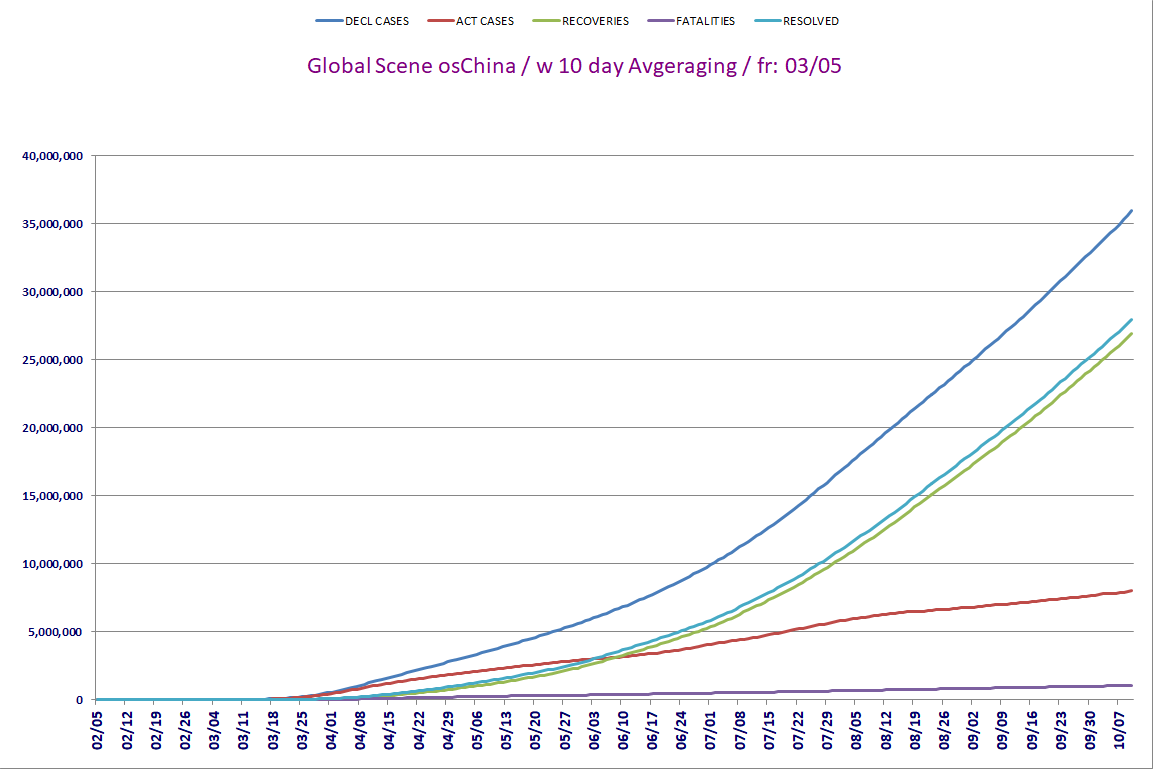
Global osChina Stats / w 10 Day Agveraging / Fr: 03/05
Requested by: Texas Eagle
This data and chart presents things in a little different way. In the
chart it is easy to see the relationship of these numbers.
The Chart will use the data all the way back to 03/05, but the data
displayed here will only go back one month.
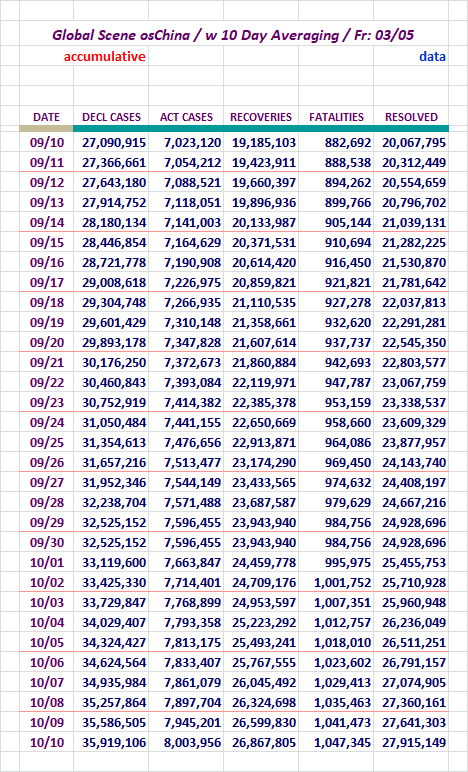
Here is the chart to match.
The Active Case chart line seem to be flattening more the other day, but didn't materialize. Some days a single day can depict a false indication
and I believe that's what happened here.
In the United States chart like this one, the Recoveries, and Resolved
Case lines have not shown near the strength as is revealed here with these
upward bound lines.
That chart is provided here, in a small version, but you can see it full size
if you right click view.
Section: 04
The Following Addresses the Global Numbers
including Mainland China*
Mainland China's numbers are 0.003% of today's total global numbers.
A Look at Declared, Resolved, and Active Cases, Includes M/L China
End of day figures follow:
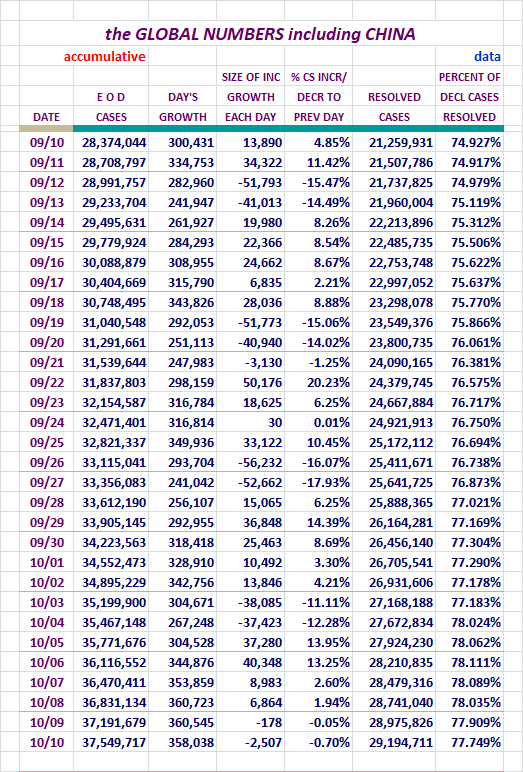
We wound up at 77.749% for Resolved Cases yesterday Globally. That was a
small decline. We have reversed course and are seeing this percentage decline.
This may be another indicator of a third wave starting. The United States
might not be the only region seeing a new wave brewing.
Fatalities, Recoveries, Resolved, Active, and Serious/Critical
Cases Globally, Including M/L China
Concept of adding in Active Cases and
Serious/Critical here, courtesy of amorphous
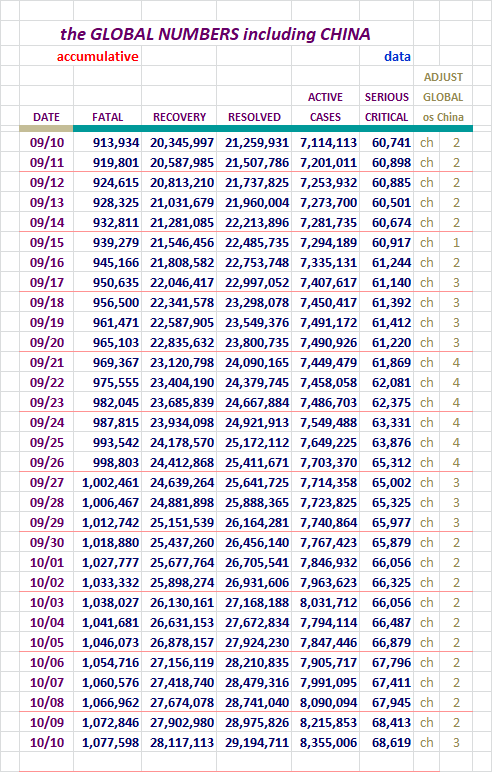
Active Cases rose by just close to 145k yesterday.
Serious/Critical cases rose up 206 cases.
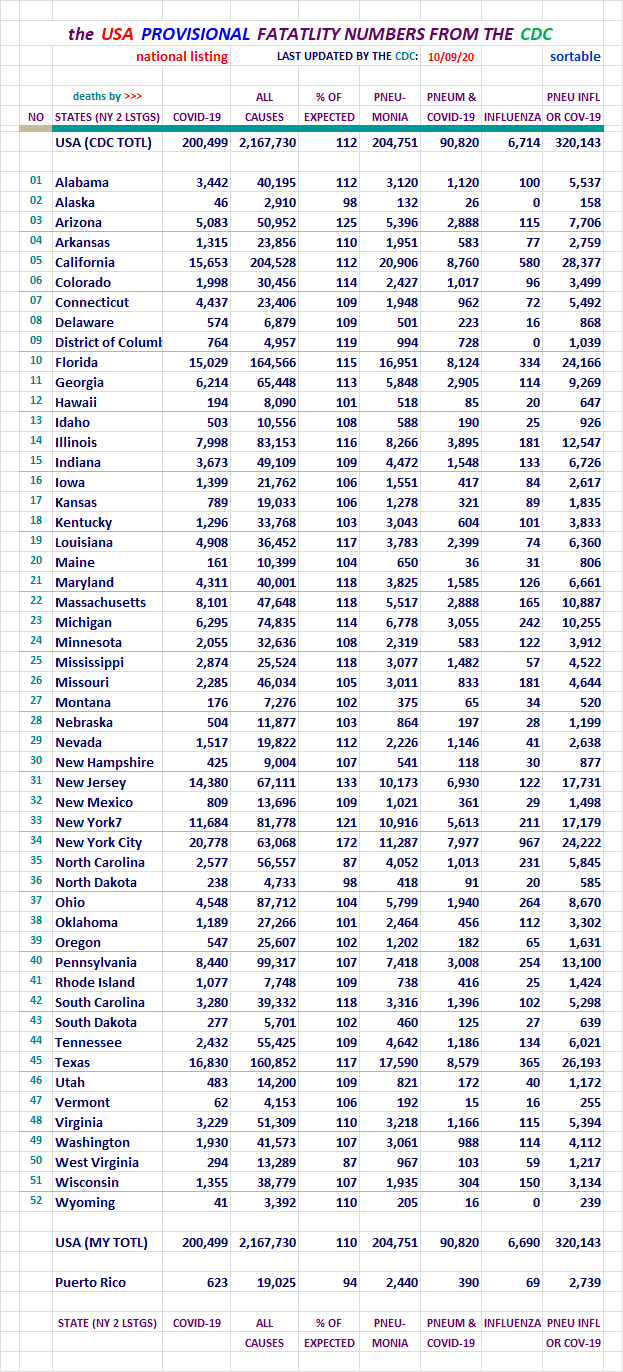
Section: 05
the Mortality Report
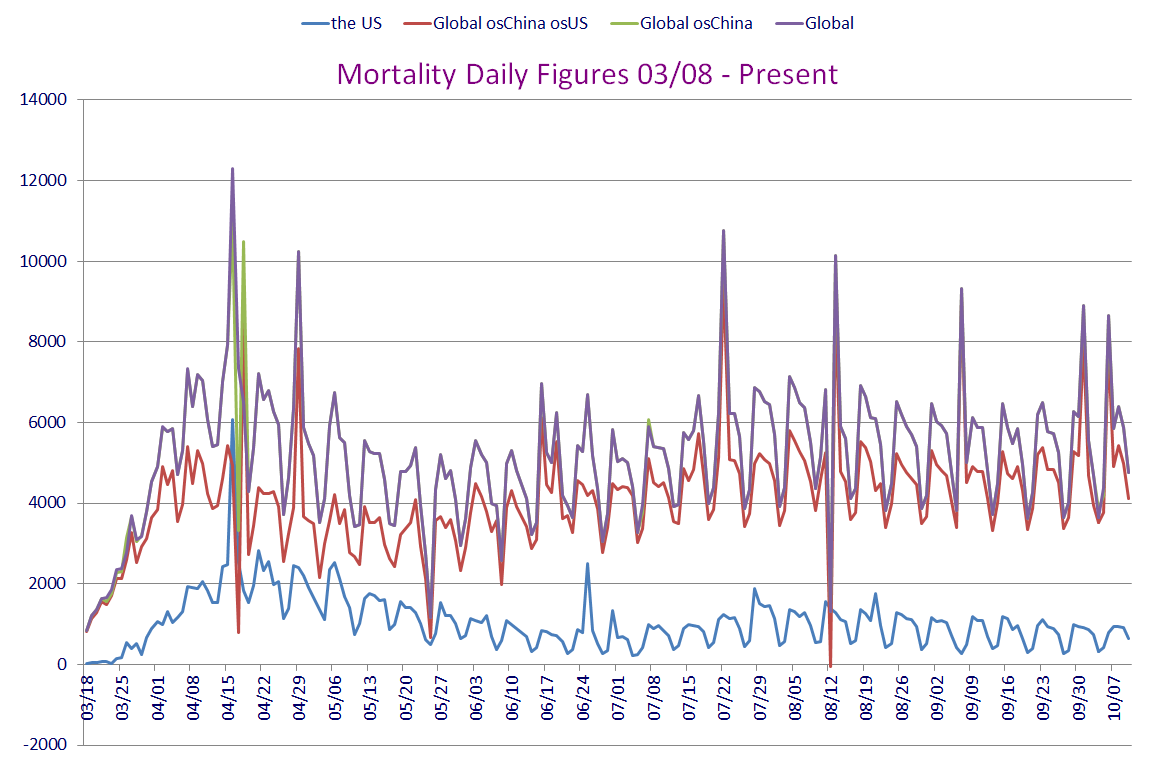
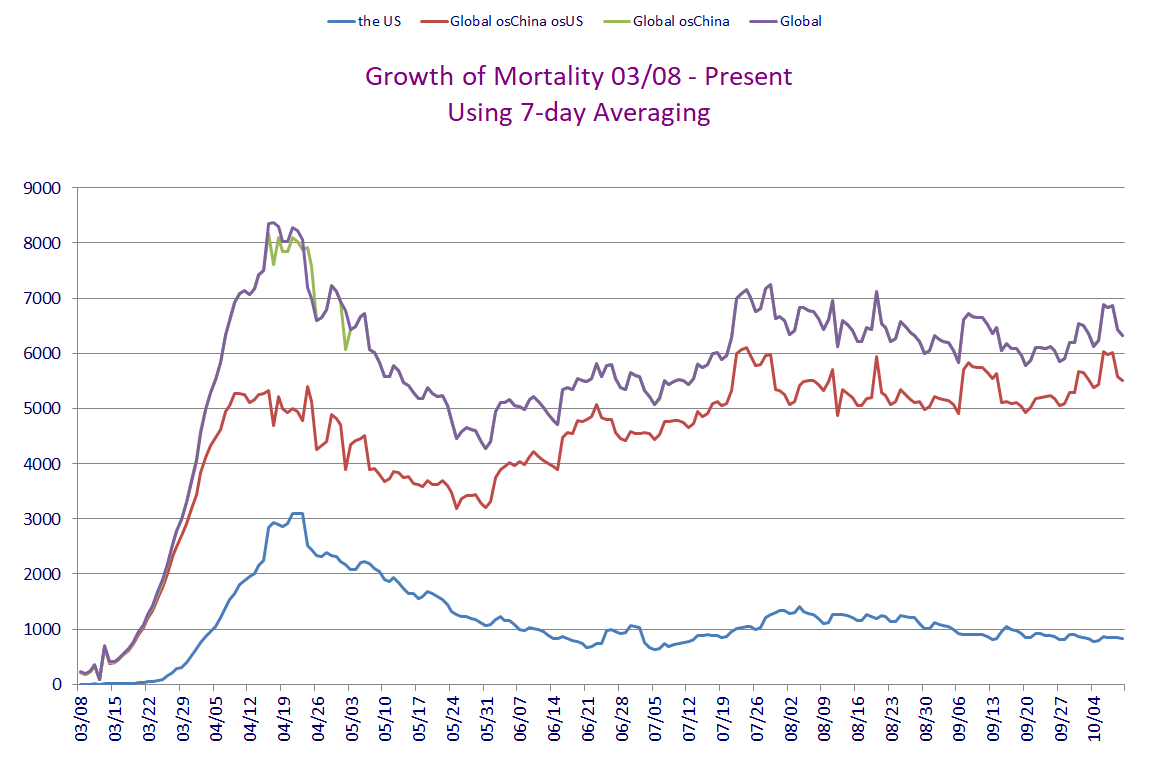
Here is the data for four entities...
Here are the figures for the growing case totals for four entities.
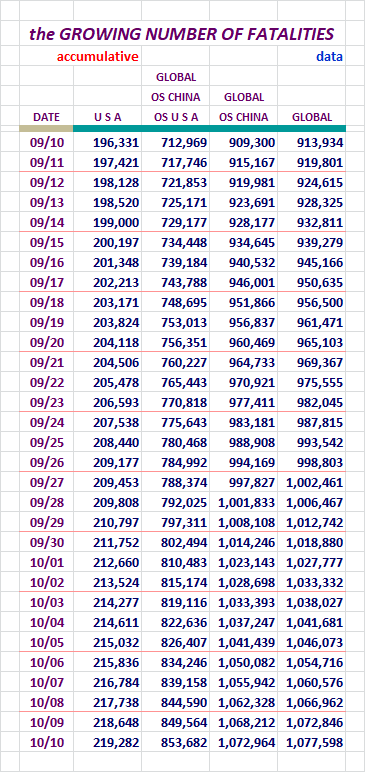
We hear all sorts of stories about how these figures are wildly off. The CDC
has studied them and seems to think they may actually be on the low side of
things. I am providing the CDC Provential Numbers down below. Not sure if
anyone has a rock solid number. I doubt it is possible. This is what is
reported out by WoM and JHU. Check out the CDC numbers too.
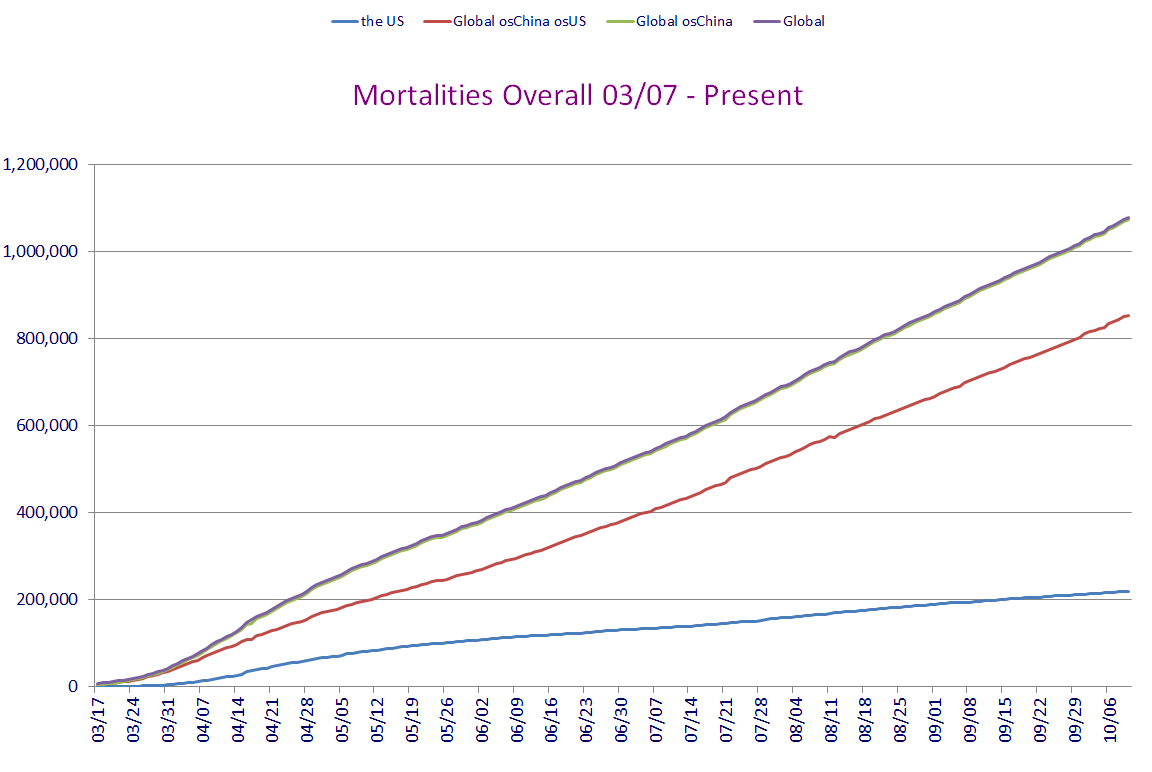
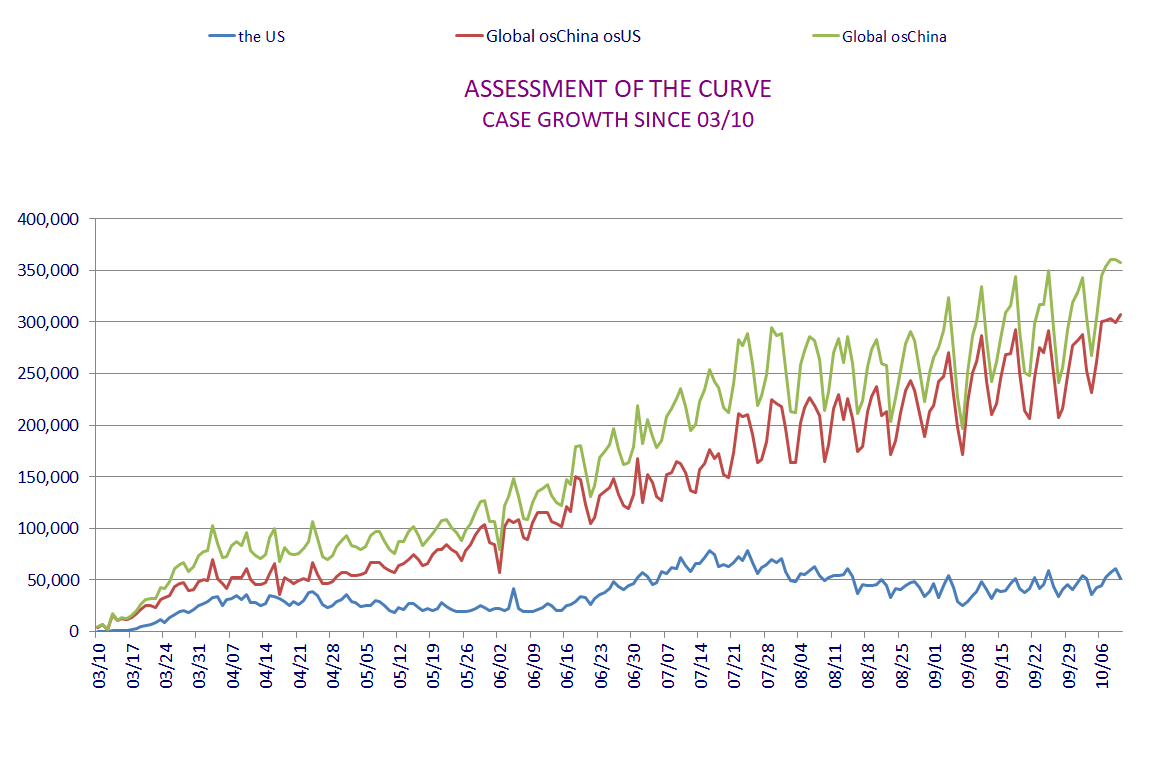
Charts like this one only show growth. That's why I recently took the advice
of a FReeper and added in a new chart for the U. S. and Global outside China
regions.
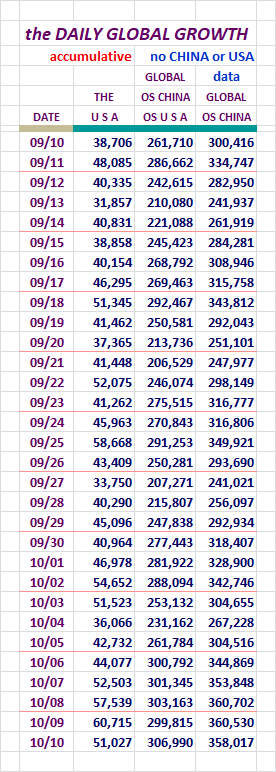
Here are figures revealing the daily growth for those four entities.
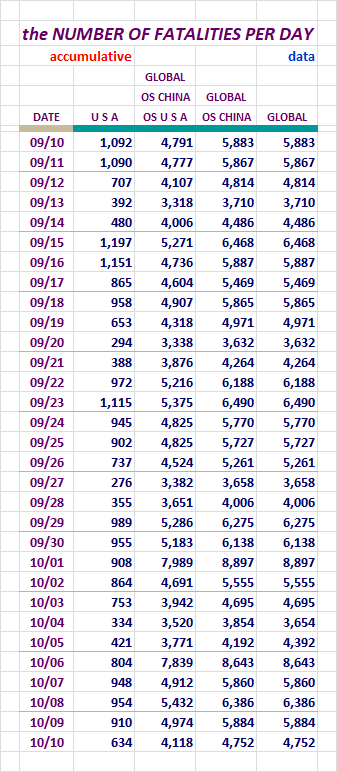
The number of fatalities fell off across the board yesterday.
Since the beginning of COVID-19's activity in the U. S., higher New Cases were
soon followed by elevated Fatalities. If we have gone to school on the data
of this disease, we know who should avoid exposure the most. So if the
demographic that has little to fear from the disease is out there getting
infected, it may not be a bad thing at all. If the Fatalities remain low,
vastly higher cases may simply increase the rapidity of the saturation of the
people in public who have already fought it off. And that may facilitate the
end of the disease. I'm sure others know this, but I did want to explain why
my thinking has fluctuated over time regarding these dynamics.
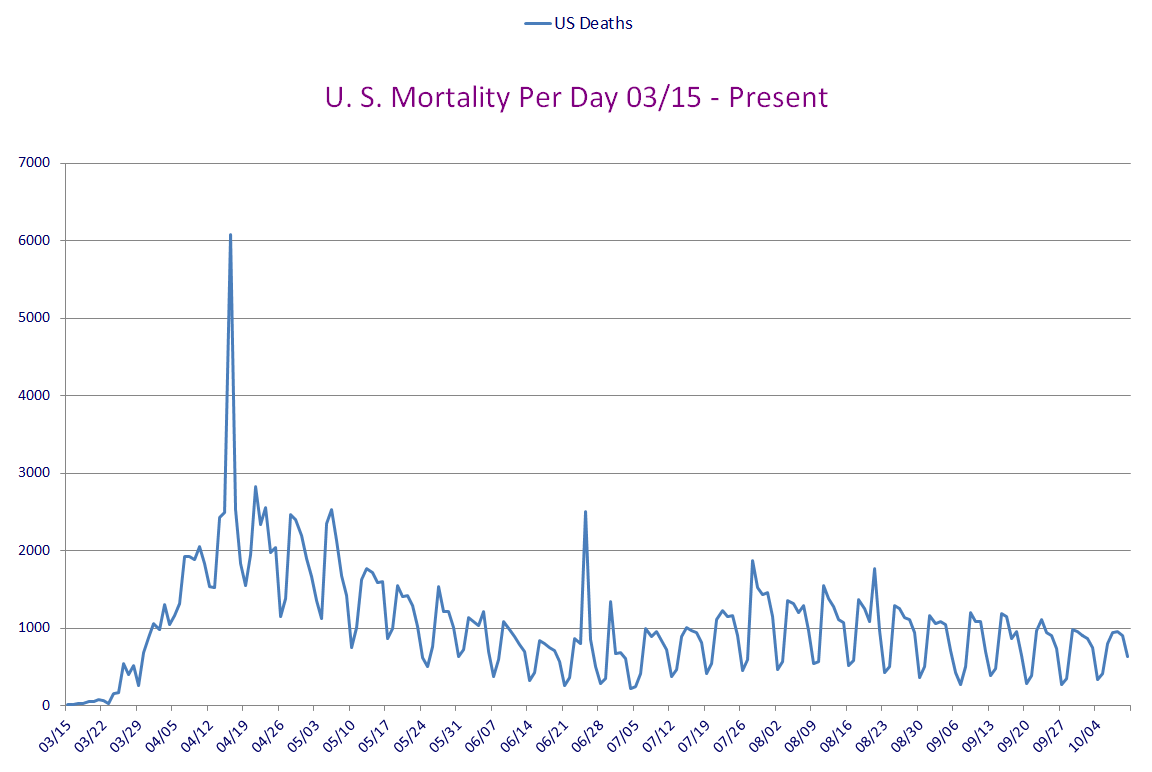
Here, let's look at data for the United States broken out by itself.
We made it through another week without going over 1,000 Fatalities.
What we saw last time a new wave came in, was that Fatalities were
soon to follow. We'll see if that holds true this time. Hopefully
we'll see cases drop off next week, and we won't have to see Fatalities
rise after all.
Seems like we've settled into a Ground-Hog day situation here, living the same
COVID-19 day over and over and over...
Section: 06
Population Saturation
Here are figures revealing how many people in each population base represent one
case. I'm also showing what percent of each population base is infected at this
time.
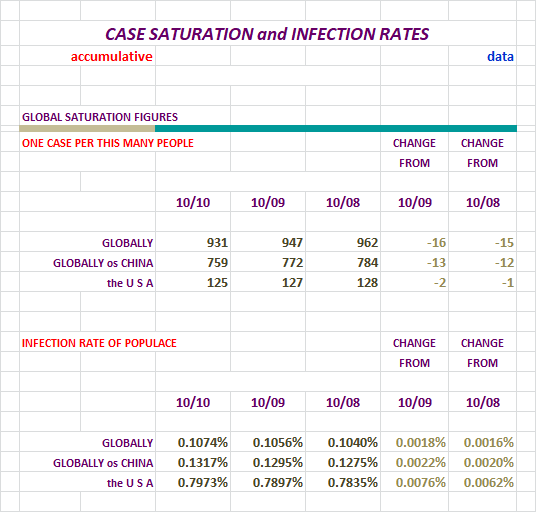
This area hasn't looked too good lately.
Nations With Lots of Cases
At the end of the day yesterday, there were:
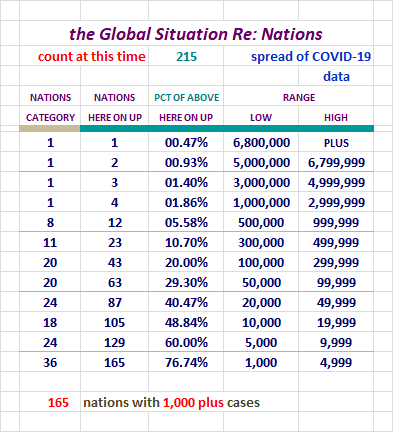
I expanded the levels here yesterday. We had nations who were seeing serious
growth, and their levels weren't showing up very well at the top.
Over 50% of the 215 nations we're tracking now, have declared over 5,000 cases,
but they have far lees of them still Active. Over 25% of the nations we're
tracking have delared over 50,000 cases along the way. None of them have
anything near their declared amount remaining active. Keep that in mind.
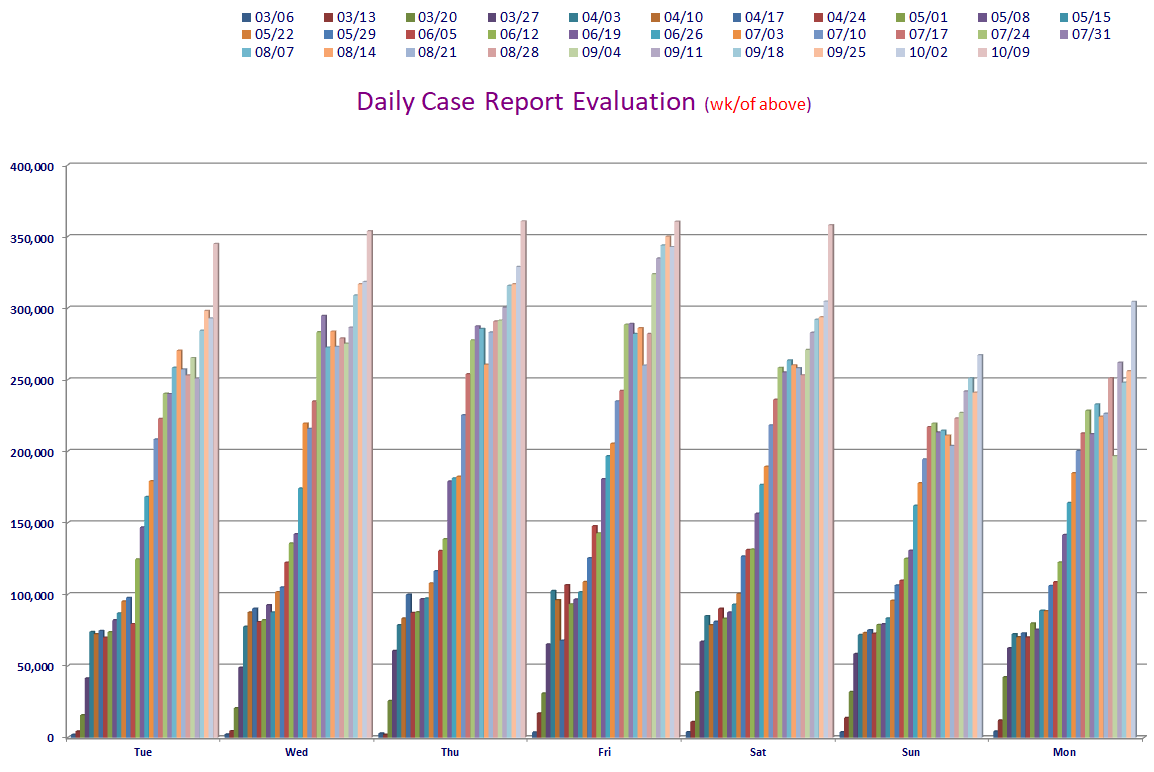
Daily Case Report Evaluation
I'll be keeping tabs on the daily tallies for days of the week for a while. Folks have
noticed some patterns of larger and smaller data entry on certain days, and on Fridays
sometimes the numbers get noticeably larger because of it.
And we now know Thursdays have potential to break out also. Yikes!
IMO Let's check out the numbers and a chart.
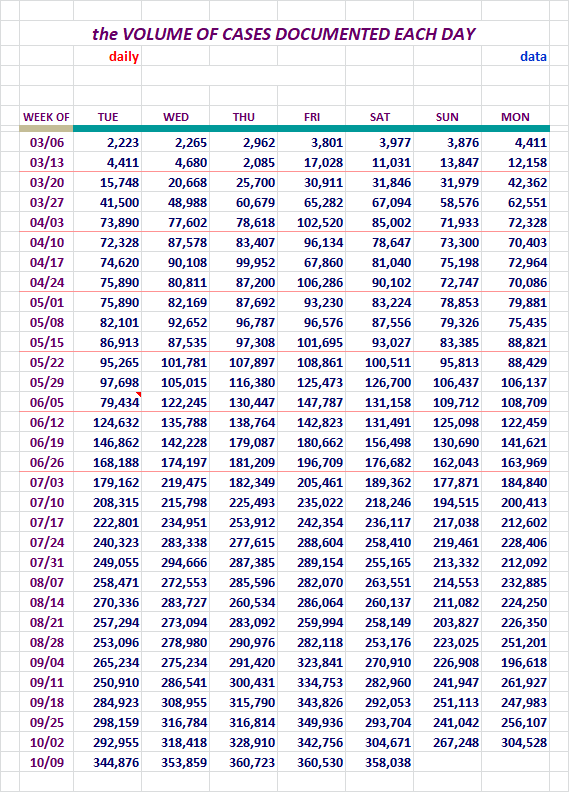
Saturday's Global numbers came in a little under Friday's. Saturday's
number was a new high for a Saturday though, coming 53,347 over the last
high Saturday set just the week before.
n Section: 07
The Top 200 Counties in the U. S., by Number of Cases
This little report lists 200 Counties in the United States in declining Case numbers.
There is also a listing that is alphabetical. This report list only the entities
and the number of Cases in the two different sorts.
It will also be available as a downloadable Excel file in Section 12.
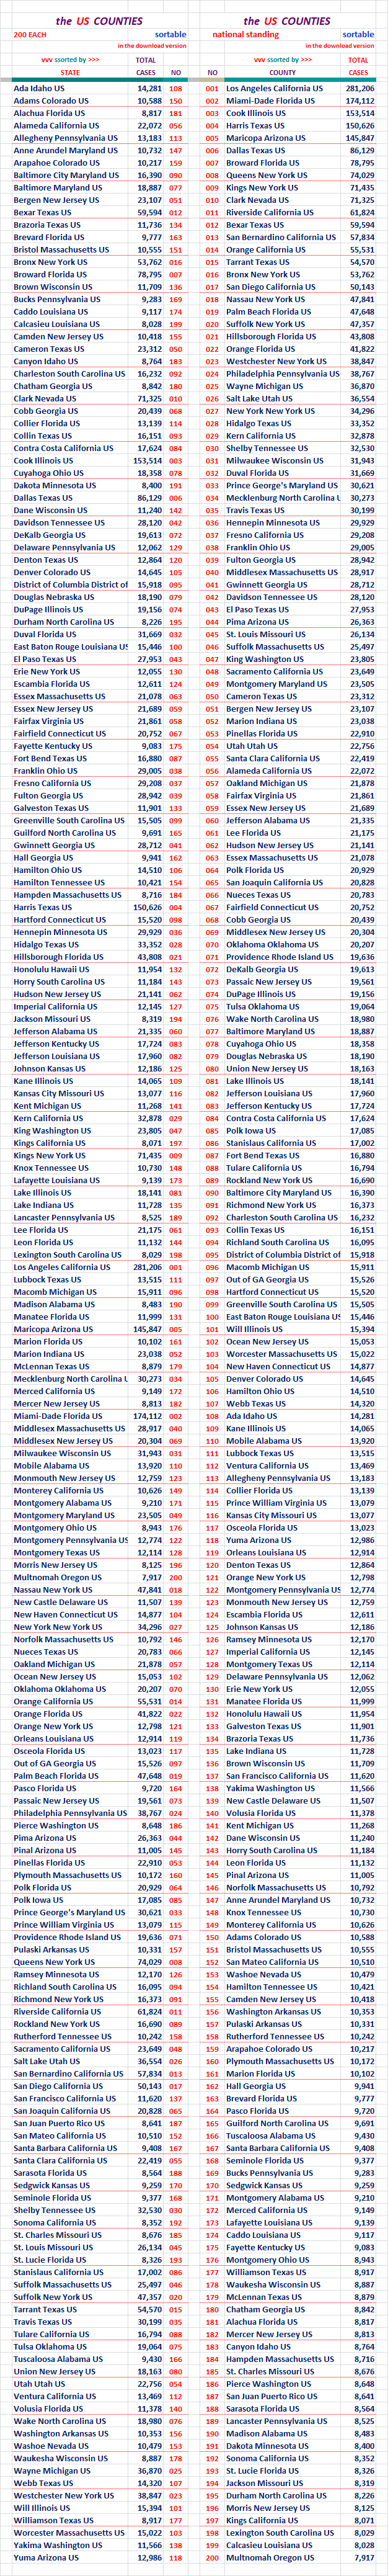
For months Puerto Rico was showing up with the Counties. That stopped in early July
if memory serves me well.
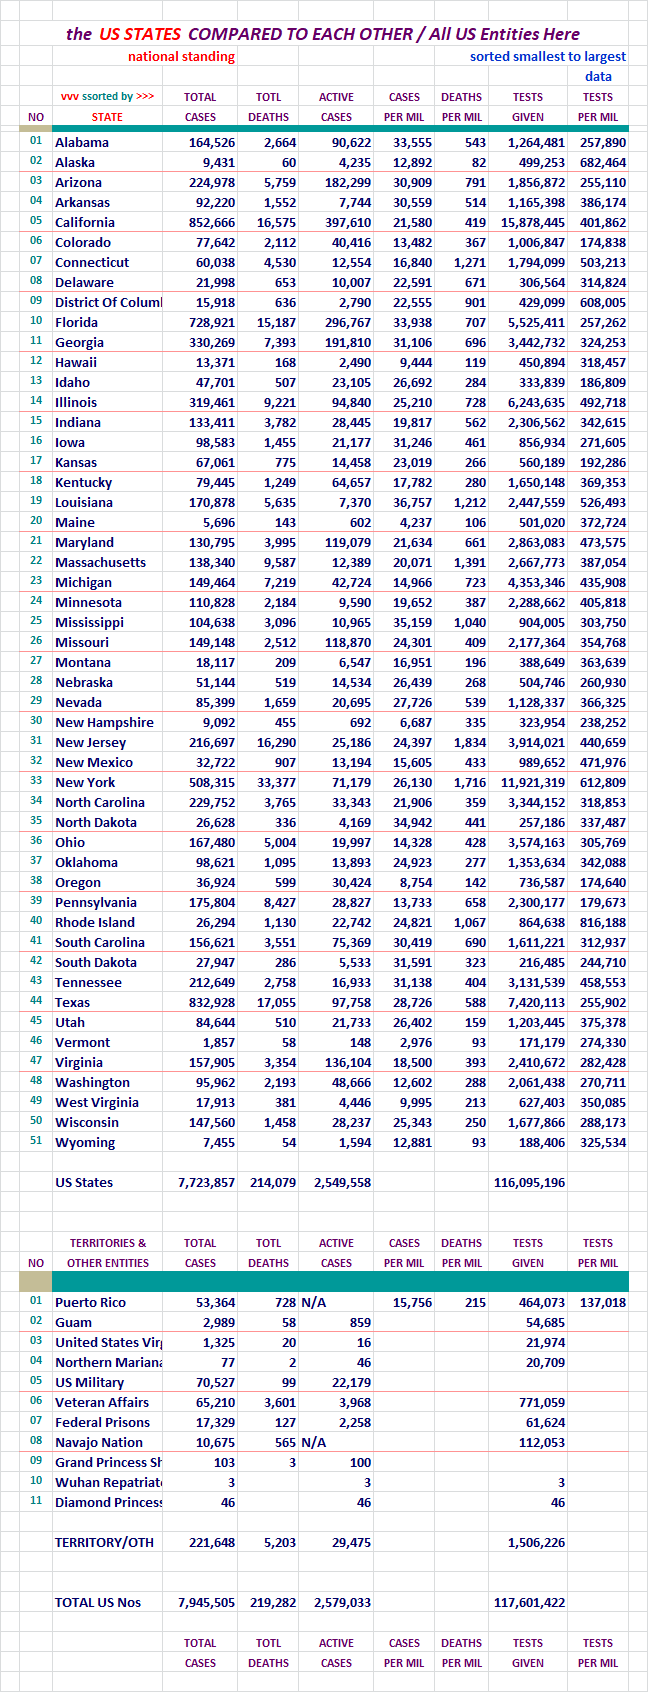
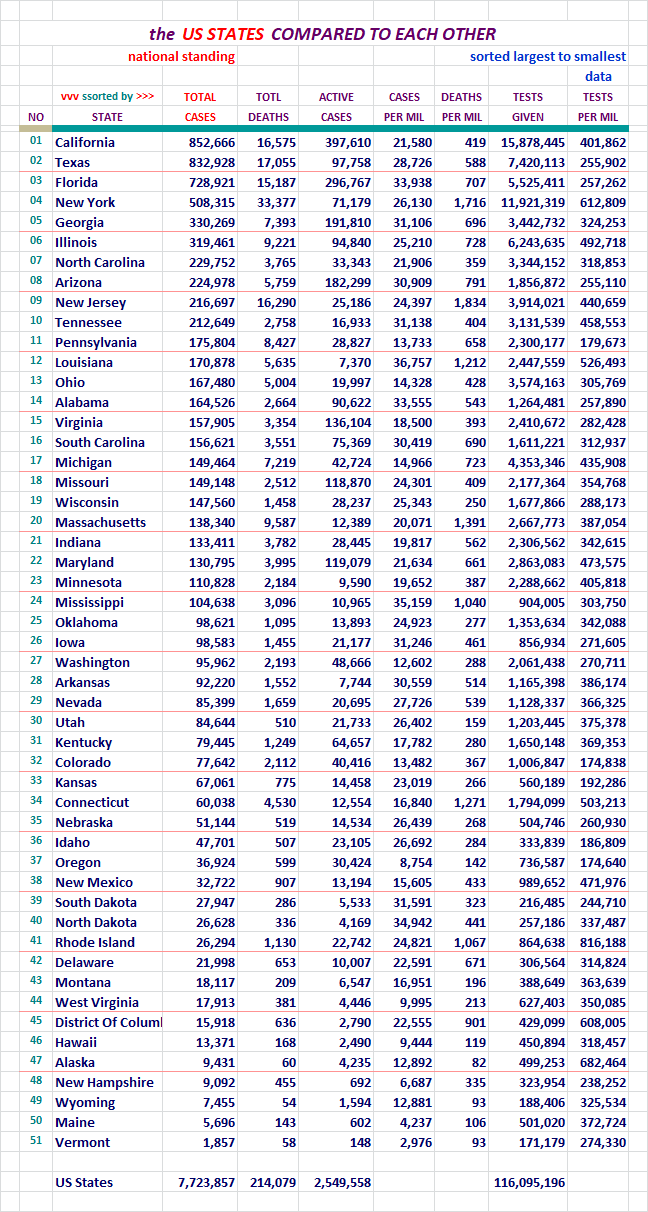
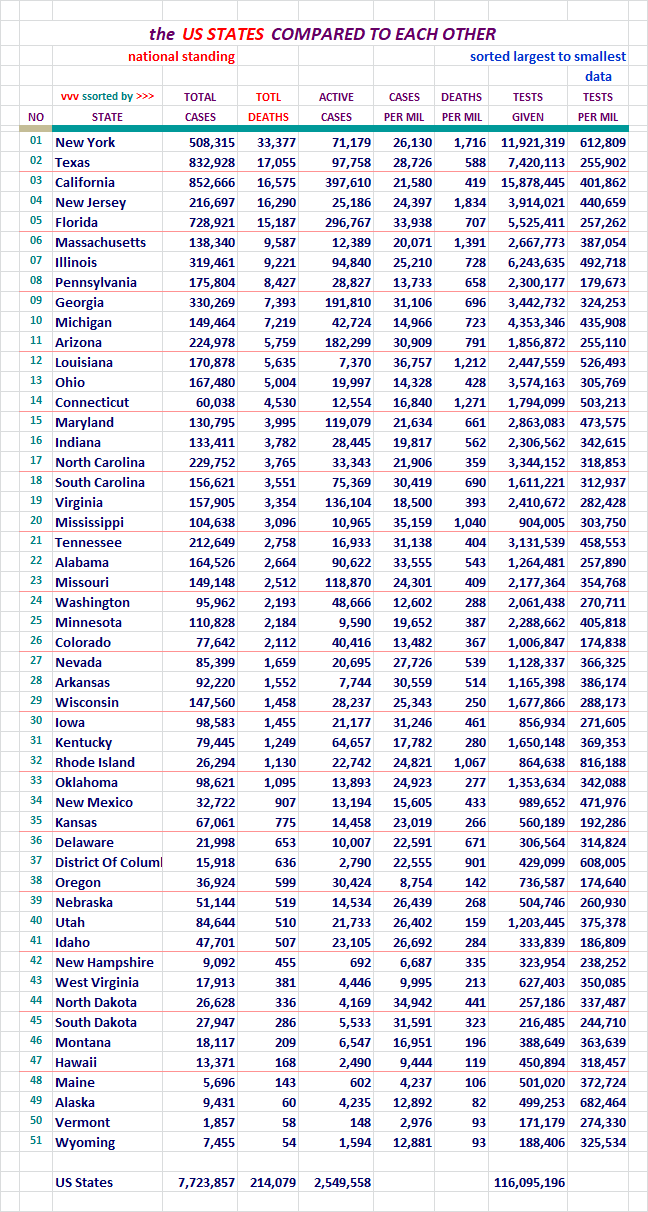
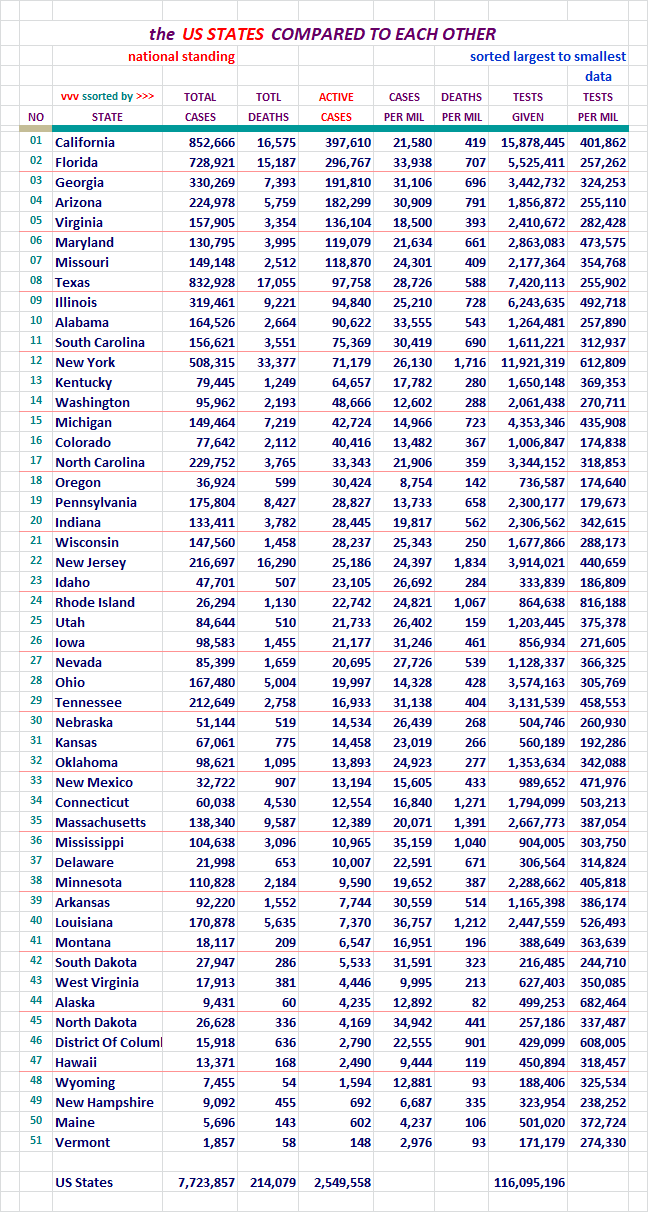
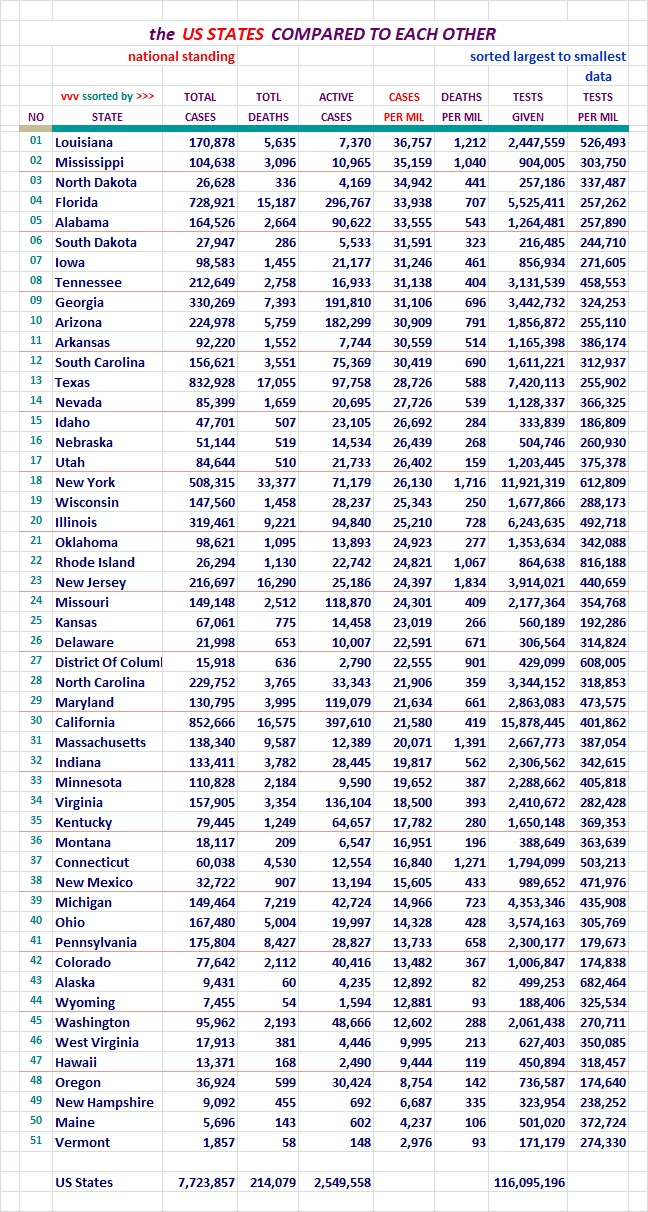
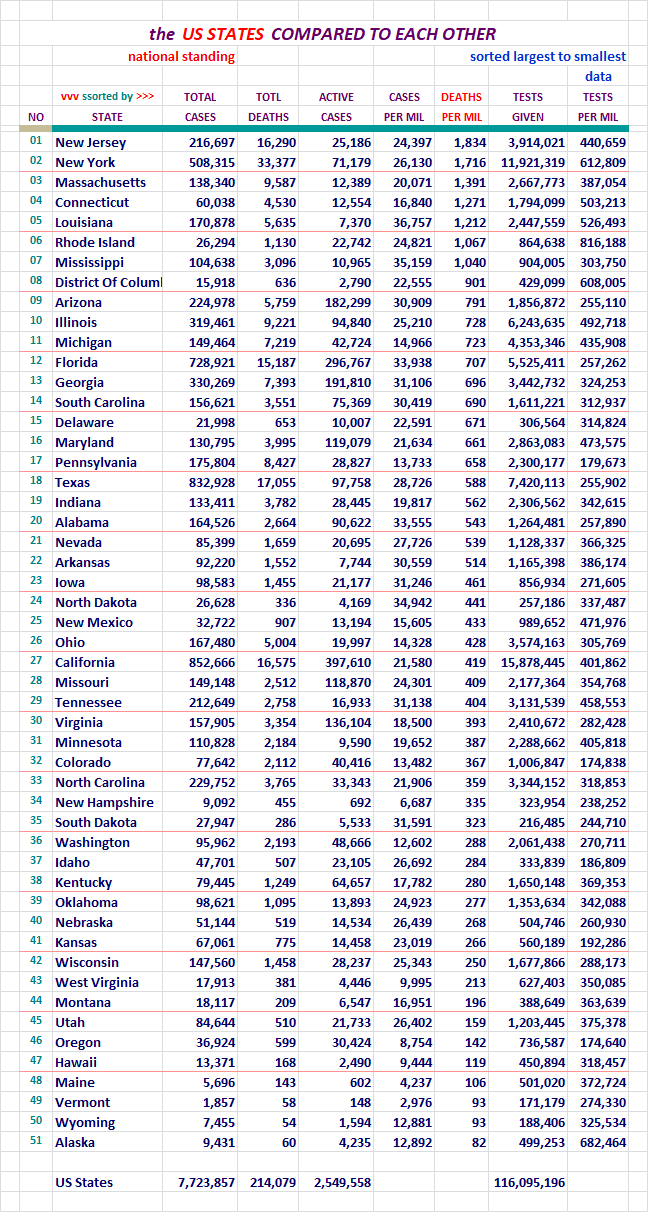
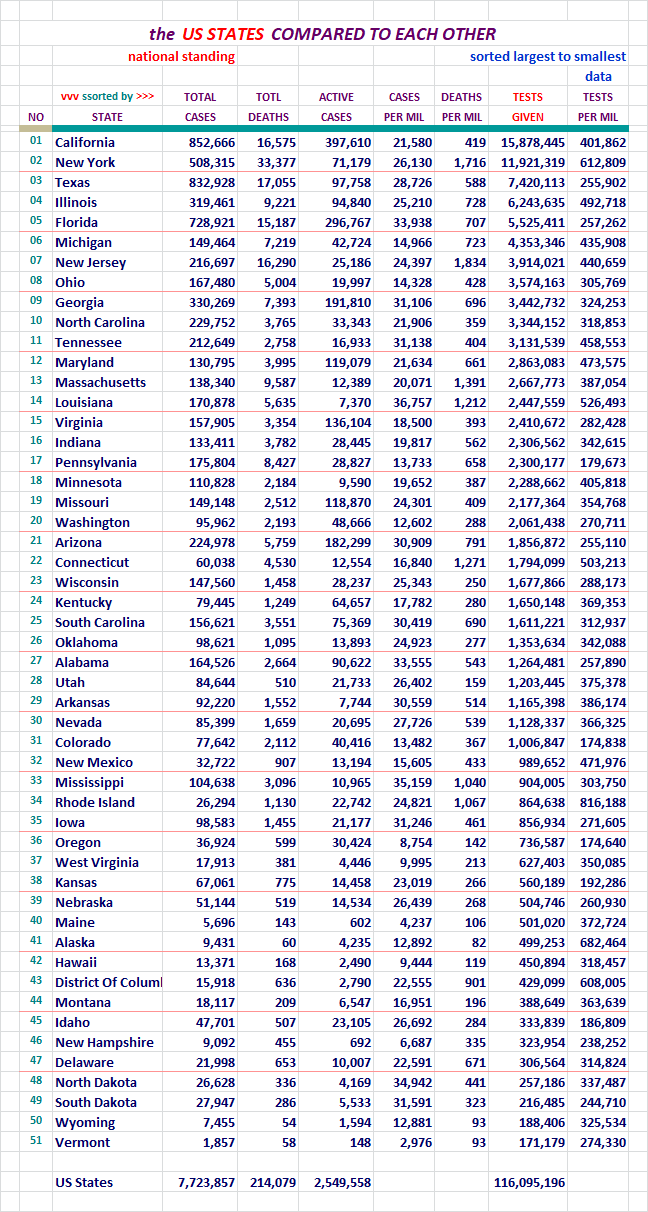
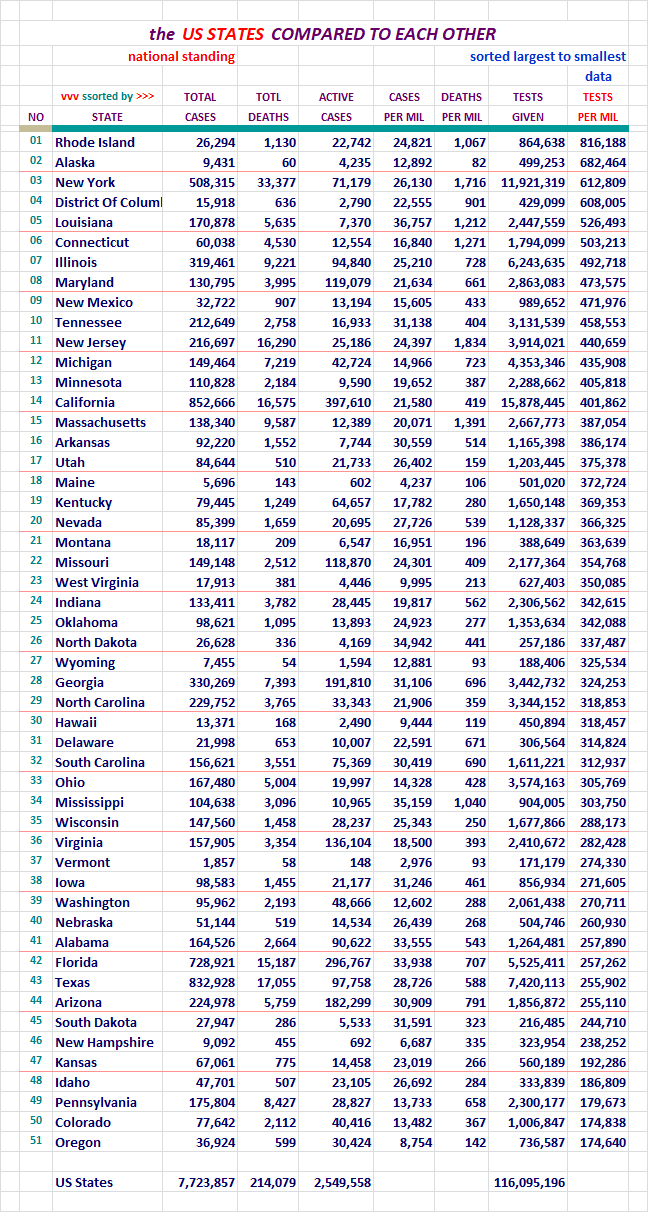
Section: 08
States of the Union and the District of Columbia, Compared to Each Other
Each of these pages is sorted differently. Look at the red header above
the columns to see which column was used for the sort on any given page.
For your review...
For your review...
For your review...
For your review...
For your review...
For your review...
For your review...
For your review...
For your review...
If this area interests you, please use this LINK to the source, and review
the lengthy description and explanation of it's development process.
There are two reports. The presentation above comes from the second one,
and the detailed segmented information below it, may interest you.
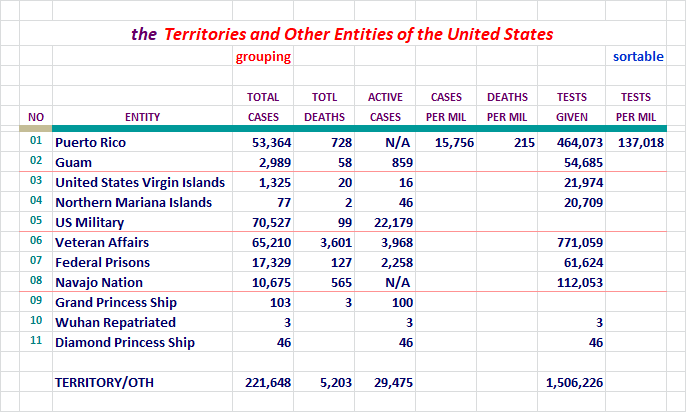
These can now also be found under the states on the Alphabetical list. The
states and these entity's numbers should be combined to match that of the
U. S. figures each day.
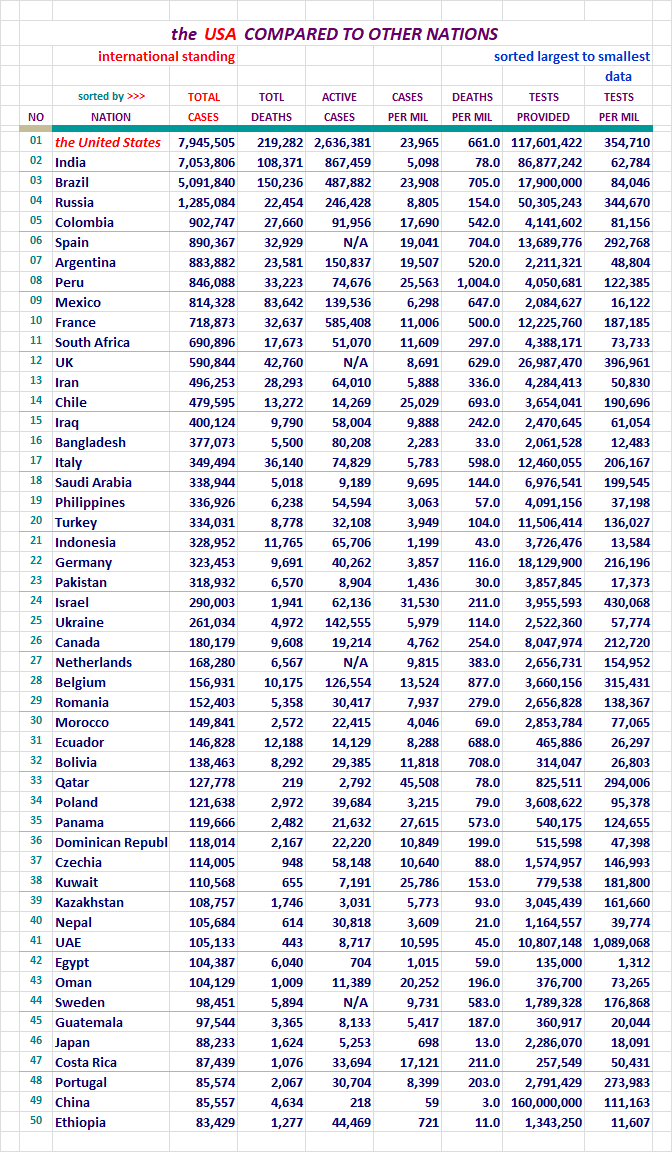
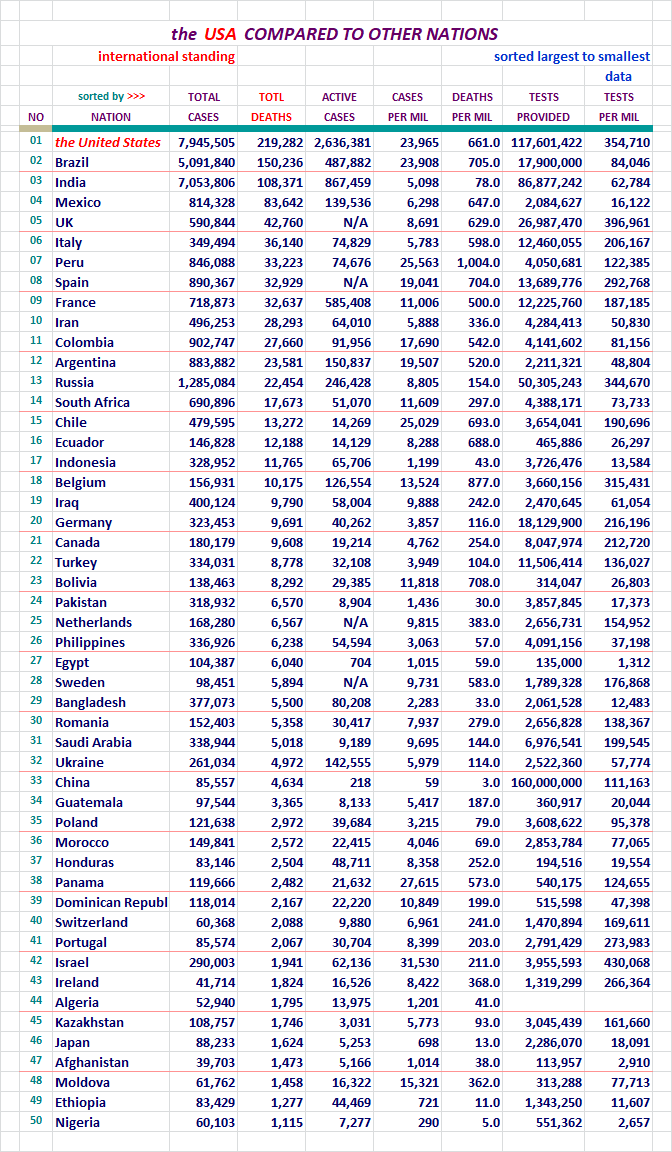
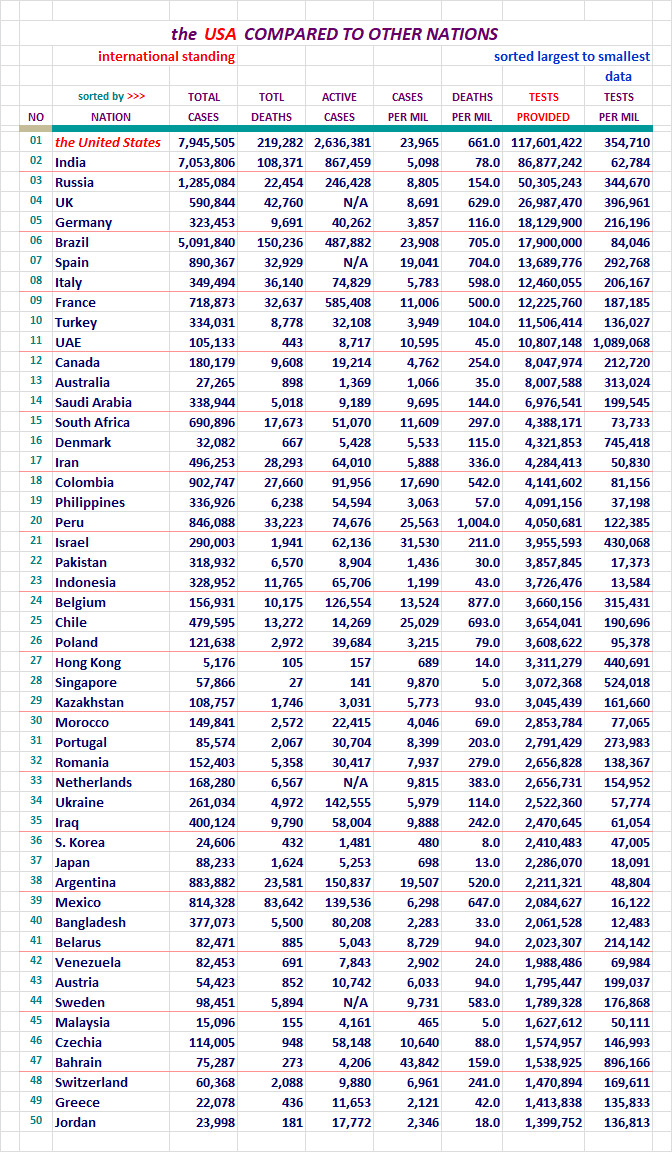
Section: 09
The United States, Where it Ranks With Other Nations?
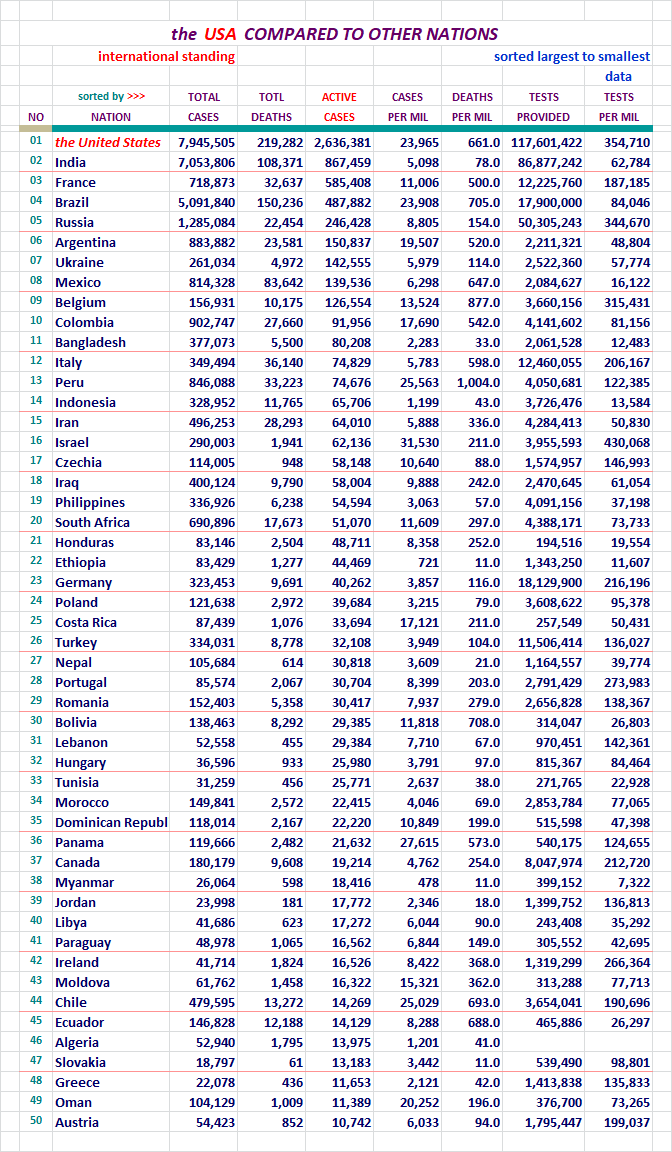
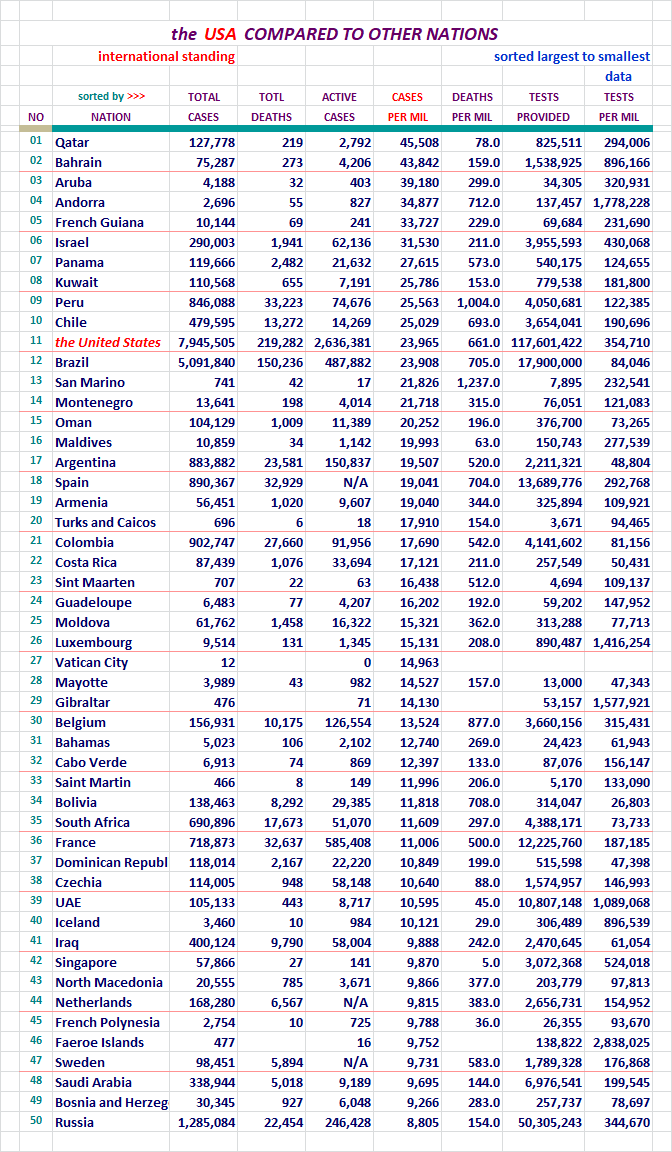
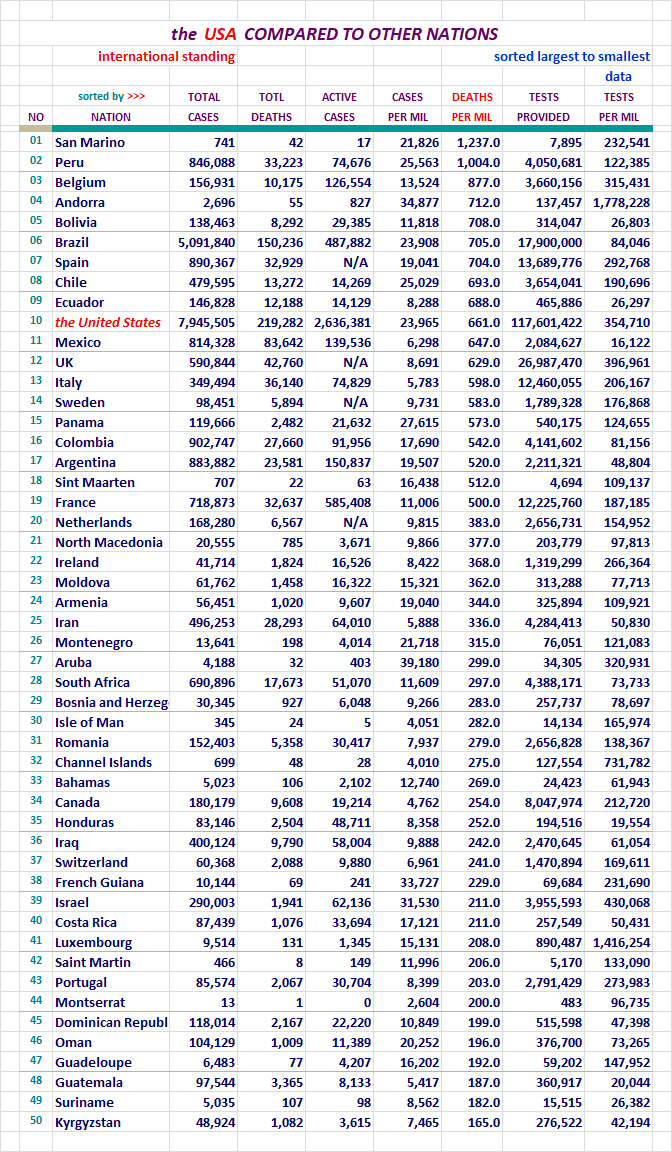
Each of these pages is sorted differently. Look at the red header above
the columns to see which column was used for the sort on any given page.
The U. S. will be highlighted red here so we can find it easily in the list.
There was 215 nations on this list last night now. I didn't want to post
seven lists with 215 nations on it, so I picked the top 50. Coincidentally,
one report category had the U. S. at 41st, so it wasn't showing up on the
list with the 31 top nations on it. That wasn't the reason why I extended the
list length, but it did work out well.
I work on the nations right next to the states on my spreadsheet. The
states with the District of Columbia come in at a total of 51 lines.
I decided to keep the international reports near that length, and 50
was good enough.
Here we go... for your review.
For your review...
For your review...
For your review...
For your review...
For your review...
Around 06/23, China started putting out it's testing numbers. I thought
they were suspect. The number they put out was 90,410,000. Ours and most
everyone else's numbers are specific. For instance on 06/28, our number of
of tests at the ned of the day was 32,592,368. That specificity separates it
from the number China put out. It was rounded to the 10 thousandth place. In
addition, China did not update that number until 09/02/20. On that date they
raised the number to 160,000,000. As of October 3rd, 2020, they haven't updeded
it again. So I do not inlude China in the Nation's Comparison Sort regarding
Testing, and any place that reports out global testing numbers for a top level
comparison.
Please note that global testing on the Dashboard was only deducting China's
90,410,000 figure from 09/02 through 10/02/2020. I should have been
deducting the 160,000,000 figure, and all global figures during that period
were 69,590,000 tests too high.
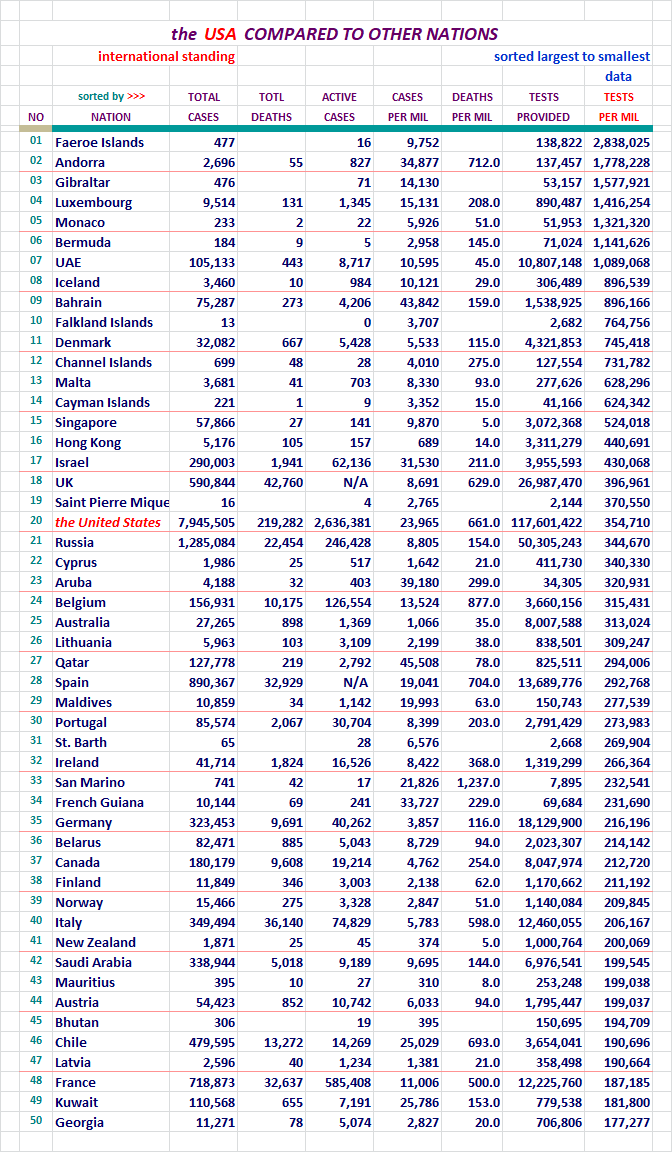
We're been back in 20th again.
Section: 10
Here is what it is all about. From January 20th to the present.
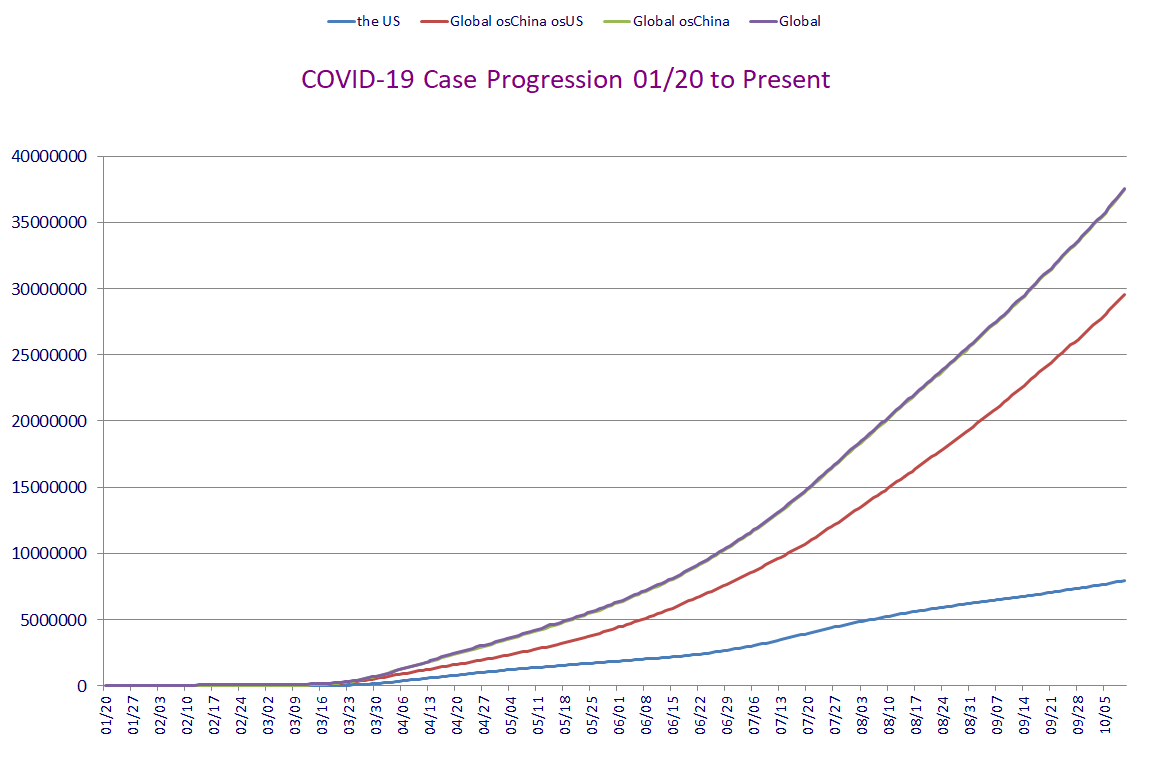
This concludes our look back at yesterday's data. Take care...

Section: 11
Data for this Report Sourced From:
LINK WorldoMeters
LINK Johns Hopkins University
The Center for Systems Science and Engineering (CSSE)
LINK United States Center for Disease Control - Provisional Numbers
Listed in the order of current utilization...
LINK You are Invited to Review My COVID-19 Spreadsheet (XLSX)
There is not an XLS version available for distribution at this time.
Section: 12
Other Features:
LINK US Counties200, States & DC51, Territories & Other Entities11, Nations219,
and the CDC Provisional Counts53
Five Excel Spreadsheet datasets you can sort for your own studies...
Section: 13
Links to other resources:
I cannot vouch for these sites. Please use your own judgement.
LINK Adventist Health Coronavirus Resource Hub - Scroll down for useful info
LINK Antibiotic Vitamin, the (Vitamin D)
Good article on Vitamin D's likely role in prevention of infection. Thanks Blam.
LINK CDC Data for Download - Scroll down - Excel required. Includes death stats.
LINK CDC National Center for Health Services
Provisional deaths as determined by review of vital documents. Much lower...
LINK CDC Secondary Data and Statistics - Portal Entry / Look around
LINK Coronavirus (COVID-19) Map
LINK Coronavirus infection risk may be reduced by Vitamin D
by Former CDC Chief Dr. Tom Frieden
LINK Coronavirus Spread Quickly Around the World in Late 2019, Study Shows
the University College London Genetics Institute
LINK COVID-19 Deaths Broken Out by Thirds, 05/07/20 Map of US Counties
Very revealing display of Concentrated Death Zones - thanks hoosiermama
LINK COVID-19 First U.S. Case, Treatment, features Remdesivir
New England Journal of Medicine article
LINK Cytokine Storm, med Actemra, Physician near death saved
LINK Diamond Princess Review at 634 Case Point of Eventual 712
LINK Hydroxychloroquine Article: International Poll
Daily Mail Reports, Most Effective Treatment According to 6,000 Physicians
LINK Hydroxychloroquine Has about 90 Percent Chance of Helping COVID-19 Patients
the Association of American Physicians and Surgeons, reports 91.6% of patients improved clinically
LINK IHME - Institute for Health Matrix and Evaluation
LINK National Institutes of Health - Cornavirus (COVID-19)
LINK Nasal Irrigation is the Key, COVID-19 Related
LINK New York City - interesting breakdown, borough, age, sex
LINK On the Origin of CCP Virus, A Documentary Movie (turn up the sound)
Epoch Times: I highly recommend this very well documented report.
LINK Rt COVID-19
Calculates and displays the Rt Factor for each state. Thanks FreedomPoster.
LINK World Health Organization

Increased finding of cases is good.
It means cases are found and treated earlier- leading to better outcomes for the patient and the public.
Need ICU and hospitalization numbers.
No PA Department of Health press release today, so no LTC death update. Maybe tomorrow, certainly Tuesday.
Wolf’s playing with the numbers.
Bingo.
One of the reasons why I post them every day. Too many days when LTC new deaths exceed the “total” new deaths.
And they seem to alternate with days with extremely low (even zero) new LTC deaths.
Of course when your Secretary of Health doesn’t know which restroom to use confusion is inevitable.
Thanks for pointing out that angle on it.
The positive testing does remain below 5%, but I’m not seeing
a further move down.
Although what you say does make some sense, globally finding
50% more positive cases now than we did 5-6 weeks ago,
does not encourage me.
It’s beginning to look like another run up developing.
Thank you. Look forward to your report tomorrow.
They were botching the deaths up before....so it’s not surprising they’re late and or playing around with the numbers.
” another run up developing.”
In what? Deaths?
I don’t see that, I’m looking to treatment and early discovery.
Seems a reasonable position to me.
The first couple of weeks of June, there was a flattening.
New Cases picked up after that. Then around two - three
weeks after that our fatalities spiked up to 1,500-1,800,
and for weeks after that we had 1,000 plus days some in
the mid 1,500s range.
Now that our cases are starting to grow again, I’m very
leery of what is going to be taking place two to three
weeks from now. Serious/Critical cases are growing right
now. They had fallen off pretty good.
Our Active Cases are right now at their highest levels
after about 4-5 weeks of dropping down about 50-60
thousand.
We’ll see how it goes.
What is going on with Netherlands?
Won’t even try to fault anyone who thinks what happened before will happen again.
We’ll see.
Appreciate your efforts. Would like to see more on metrics that are more current. Don’t know that it can be done.
Well...my 94+ MIL went to ER Fri with a lowering blood oxygen level, breathing issues (Congestive heart issues) and lethargy.... ..Sat diagnosed with covid, transferred to another hospital today (bigger city, better for her)...but she seems to be doing pretty good ...we’ll see. Steroids tonight, maybe remsvider (sp) if they can get her kidneys better. ..her Asst Living place will now be scrutinized...but we consider it very good. All there were tested 2 weeks ago...staff tested regularly, etc. Will be interesting.
I’m tied up for the next two hours, prepping for then
working on data collection.
If I’m still coherent at that time, I’ll try to respond to
you all. If not, I will in the morning.
Thanks for the comments.
In raw numbers it doesn’t look good.
If you look at the cases per million, it’s a lot better
positioned.
At this point I prefer to judge nations by their own prior
figures. If a nation goes for five months, then in the
next two months triples it’s numbers, that’s not good no
matter how you slice it.
The Netherlands isn’t the only nation showing a propensity
to add new case way beyond what they were. Both charts
show two or three that are in danger of doing what the
Netherlands is.
It is good to keep the CPM in mind too though.
Yeah, the Netherlands doesn’t look too good right now.
I don’t know why, but some folks have suggested the
winder months are coming, colder temperatures, and such.
Of course the Netherlands has been growing new cases
several months back by now. That wasn’t winter.
Beats me...
Explain what you’d like to see, but my bar is pretty high
now about what I add in. I’m pretty maxed out.
Best wishes for you. Sorry to hear about that.
I’m not sure who MIL is to you, but I don’t like the idea
of someone special to you having this at that age.
Sounds like your doctors are on top of it. Glad to hear
that. Prayers up...
Take care of yourself too...
“
Yeah, the Netherlands doesn’t look too good right now.
I don’t know why, but some folks have suggested the
winder months are coming, colder temperatures, and such.
Of course the Netherlands has been growing new cases
several months back by now. That wasn’t winter.
Beats me...”
/////////
Do you have an update on the number of
cases of death due to things like cancer
over the past few years and can you compare those numbers?
Seems like death by Cancer is on the decline.
I do not.
I’m pretty sure I know why you ask.
It would be my guess that you want to make the case that a
lot of other diagnosis related deaths expected, were
misdiagnosed as COVID-19 for payment’s sake. Maybe some
were.
Let me ask you this.
IF a person has bee diagnosed with Cancer and has six months
to live, should they be considered a death from Cancer if
they die in two moths from COVID-19?
I could look up the numbers for you, but would it prove
anything? If COVID-19 took that cancer patient before their
time, even if time was short, isn’t it still a death from
COVID-19? Is that wrong?
I could have COPD and be expected to die in two years.
If I die of COVID-19 this year, is that legit?
Where do we draw the line?
If it’s within six months of a diagnosed death due to cancer,
do we consider it a death from cancer if they die of COVID-19 in say four months?
How about three months, or two?
Where do we draw the line? At what point is it reasoned
to state that it is legit for the cancer deaths to be
lower one year because something else took those patients
first?
What if a cancer patient has two more months to live, but
dies an an auto accident? Was the diagnosis of death from
blunt force trauma in an auto accident incorrect?
Disclaimer: Opinions posted on Free Republic are those of the individual posters and do not necessarily represent the opinion of Free Republic or its management. All materials posted herein are protected by copyright law and the exemption for fair use of copyrighted works.