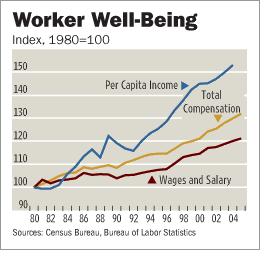
See my chart and then tell us why employers covering the rapidly increasing cost of benefits for their workers should not be included in the equation?

See my chart and then tell us why employers covering the rapidly increasing cost of benefits for their workers should not be included in the equation?

Do you have a source for that chart? I'd be interested in seeing the numbers on which it is based. In any case, the indices in the chart are evidently not corrected for inflation. That would explain why the red line labelled "Wages and Salary" appears to be going up while every measure of real wages that I've seen shows them to have stagnated or gone down the past few years. For example, the following graph shows median and mean (average) wages for full-time, year-round workers:

The actual numbers and sources are at http://home.att.net/~rdavis2/ftyrinc.html. As can be seen, the median and mean wages of full-time, year-round working men are down over the past several years and the median wages of working women is stagnant or slightly down. Only the mean wage of working women is slightly up. In any case, the graph shows that neither the median nor the mean gives the whole story. The steep increase in the mean male wage from 1992 to 2000 was accompanied by a much smaller increase in the median male wage. In fact, one of the more interesting items that I noticed in the chart is that the median wages of working men has been pretty much stagnant since 1973 despite a 21 percent increase in the mean wage.
Of course, your chart also shows total compensation and per capita income (evidently not corrected for inflation). I assume that total compensation includes wages, payments made to the government for Social Security and unemployment insurance, medical and pension benefits, options and other forms of compensation. While these are all valid items to look at, they do not apply equally to all workers. Few workers, especially low-wage workers, receive options and many low-wage workers do not receive medical insurance. Social Security contributions have not gone up and I'm not aware of any other mandatory payments that have. Hence, it's valid to look at total compensation but one must look at pure wages to get an idea of how those who receive only wages (and mandatory government benefits) are doing.
This point applies even more to per capita income. I assume that a major component of this is investment income. Few low-wage workers are receiving much of anything in investment income. In any case, it's not the topic of this thread ("Wages of Stagnation"). Hence, I'd appreciate it if you could provide a source for your chart so that I can check the numbers and see what they include.