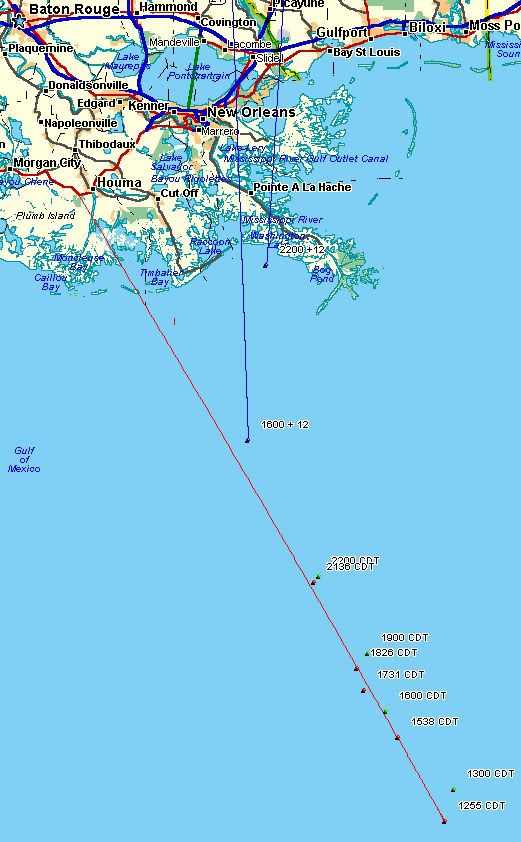
This map covers the position plots since 1255 (CDT) today. The red dots and line represent Vortex plots, the green dots are Forecast Discussion plots, and the blue lines and dots represent the +12 hour and +24 hour positions indicated in the respective Forecast Discussions from 1600 and 2200.
http://i4.photobucket.com/albums/y138/jeffers_mz/Katrina/10pmplots.jpg
Wow, she's chugging right along, isn't she?
She "got the memo."
well done! Nice map--thanks!
Looks to me like there's almost no way New Orleans misses the eyewall. Worst possible outcome for the city.
See this post, 754!