

Posted on 11/24/2013 10:04:06 AM PST by whitedog57
The recent confusion from The Fed over the future of quantitative easing (or money printing) can be addressed with a few charts.
Here is a chart of real GDP growth PER CAPITA since 1960. Real, of course, indicates that it is Gross Domestic Product adjusted for inflation. Note that Q1 1984 was the peak of real GDP growth … and it has been a steady decline since then.
realgdppercap
I added the S&P 500 index to the real GDP per capita chart and you can see that the S&P 500 index spikes when real GDP growth is higher than average … at least until recently.
realgdpsp500fed
The prognosis for quantitative easing under a declining real GDP environment is … more money printing. So unless something unusual happens, I agree with Chicago Fed’s Charles Evans that QE will last until 2015.
The above charts are historic real GDP. What about forecasts of real GDP? Since 2011, the forecast of real GDP has consistently missed to the downside (prompting MORE quantitative easing from The Fed). However, the S&P 500 index has consistently risen … despite consistently declining forecasts of real GDP growth.
We know that The Fed’s quantitative easing has really juiced the stock market, particularly since early 2009.
fedbalsp500in
And house prices are really soaring … again since 2012 with the advent of QE3.
fedbalcaseshiller20
So, will The Fed actually start the taper? Not unless real GDP growth starts to rise AND the fear of bursting the stock market and house price bubbles subsides.
In other words, are Janet Yellen and The Fed caught in a bear (liquidity) trap?
cherokee-clothing-bear-trap-small-50930
Yes.
It is the same trap all Keynesian economics leads to...so far none have escaped it.
We are playing a game of screw thy neighbor.
Devaluing the dollar props up Wall Street as US products are
less costly abroad. However, US fixed incomes, middle class,
and entitlement class are paying for the Wall Street subsidy.
What charts? Where?
Are they stolen like the other ones?
Many of the elderly were frugal and planned their retirement years based on historic 5-7% return on CD's and Bonds. Bungling Ben's QE circus has dealt hardship to millions of seniors who never dreamed their next eggs would draw and underwhelming 0-1.5%
The USA increased oil production by more than 1 million barrels@ day in the last 12 months. Further the USA is on track to increase oil production by 1 million barrels@ day for each of the next two years.
Increased oil production plus low natural gas prices plus increased hydrocarbon related investments have resulted in real GDP growth of about 2% in the last three years.
That in turn has increased revenues to government coffers to the tune of about 100 billion annually.
95% of the FED’s QE’s have remained on the books the remainder has gone into the stock markets to make the rich richer and increase federal revenues by 100 billion plus annually for the last couple of years.
Inflation remains low because the velocity of money M2V continues to fall sharply.(this is a broad measure of borrowing and reinvestment. The big run up in the 90’s was related to the .com boom and stock issuance.)
http://col.stb.s-msn.com/i/47/C222433E7510FFF130CE2B98405E79.JPG
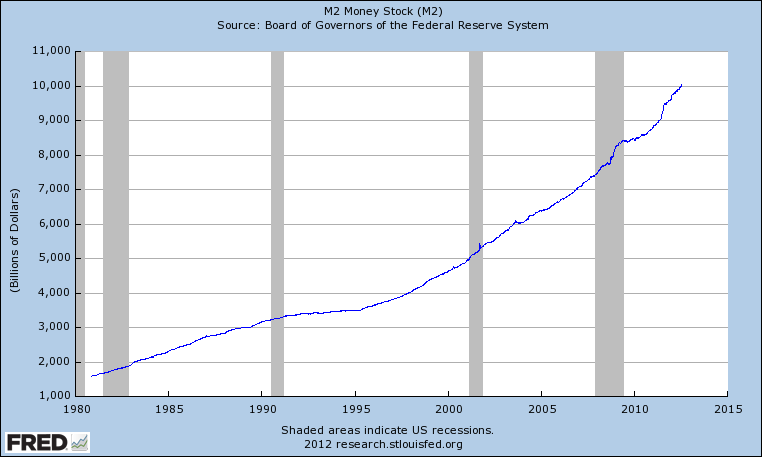
even while M2 continues to rise. (which is the total stock of money—ie fed printing.)http://static.cdn-seekingalpha.com/uploads/2012/7/31/saupload_FRED_graph_M2.png
All that means is that corporations have about 2 trillion dollars in bank accounts that they’re not investing because of the hopeless confusion caused by obamacare and dodd frank.
The exception is the oil patch where investment in the USA is taking on world changing proportions and under girding the US economy.
Whenever obamacare and dodd frank and the Sarbanes–Oxley Act of 2002 are repealed—inflation will heat up greatly. However, the fed will have numerous tools on hand to fight inflation.
For a more conservative/Austrian view on the the liquidty trap: http://mises.org/daily/5881/
It's a mathematical principle. The longer the natural ebb and flow of events is manipulated, the worse the results are going to be. It happened with the mortgage meltdown.
The cgarts bad graphs are at the article link.
Yes, because pimpy wants the hits.
Also because he has stolen the charts and dares not display them here.
Make that: The charts and graphs....
“”Many of the elderly were frugal and planned their retirement years based on historic 5-7% return on CD’s and Bonds. Bungling Ben’s QE circus has dealt hardship to millions of seniors who never dreamed their next eggs would draw and underwhelming 0-1.5% “”
Yep! We received a letter from our banker yesterday that has had my husband upset about rising interest rates and what is expected to happen to the bond market in that case. He just got out of the hospital and that wasn’t news he wanted to meet head on just yet. Unfortunately, he’s been the one to handle all the investments and understands them and I’m not ready to get educated in what it all means but looks as if I’ll have to learn!
The law of unintended consequences in this case will be to teach the American people to save even less than they do now.
If the value of your money is going to be stolen, you might as well enjoy it or put it into better stores of value.
If the central banks of countries like Argentina and Zimbabwe had been printing money at the extraordinary rate our Federal Reserve has been cranking out dollars during QEs one through three, economists all over the world — including probably Ben Benanke and Janet Yellen — would have been warning of dire collapses to those countries’ currencies, until the collapses inevitably occurred.
Yet here we are living under the same universal rules of economics that govern the supply and demand of currencies all over the world and we’re acting like we’re somehow immune from those rules — as if because Ben Bernanke and Janet Yellen received advanced economic degrees from MIT and Yale, nothing bad will ever happen to the American currency no matter how much they mangle and abuse it under their Fed chairmanships.
Even the blithe belief of our Fed Chairpersons, current and future, that the Fed can control interest rates is delusional, since when investors begin waking up to the reality that too many dollars are flooding the world and our $17-trillion-dollar debt is unmanageable, those investors will demand higher rates on our Treasury Bonds and off we’ll be going into the interest-rate clouds and all the recessionary horrors that portends.
I seem to remember Peter Schiff, writing about this or something very similar on his blog.
The Japanese tried inflating their way out of bad times in the 1990s. That ended up as the "Lost Decade." If printing money would make a nation rich, Zimbabwe would be the world's wealthiest nation. Argentina ruined its economy through inflation. And we mustn't forget the Weimar Republic, which inflated away the savings of the German people in the 1920s. When I was growing up, I collected stamps. One of the stamps I still remember was a German postage stamp costing (I've forgotten just how many) million German marks. Imagine someone who had saved all their life, and whose life savings were no longer sufficient to buy a single postage stamp. We know how that ended up: Adolf Hitler promised to solve the problems, and all to many Germans believed him.
Add suspension of Davis-Bacon until budget is balanced as well.
The greenbacks are now purple and look like money that comes with a Barbie doll package or a Monopoly game.
i can see the day coming when they change the script and you'll have X# of days to turn in all your old paper, kinda like they did with the MPC in Nam...
Disclaimer: Opinions posted on Free Republic are those of the individual posters and do not necessarily represent the opinion of Free Republic or its management. All materials posted herein are protected by copyright law and the exemption for fair use of copyrighted works.