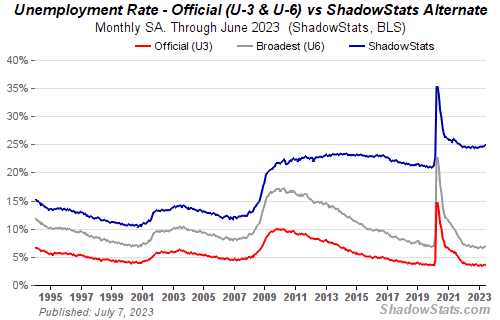

Why do they agree in trend up to 2010?
Is there a change in the U.3 and U.6 calcs at this time that explains the divergence?

I believe the blue line in the chart you posted.
There was no net 155,000 jobs counted anywhere.
The Establishment Survey raw count was -243,000 jobs.
http://www.bls.gov/news.release/empsit.t17.htm
The raw data = the actual counts of net jobs and the actual count of number employed.
The raw data is run through various statistical tools to ‘smooth the data out’. To be kind the tools have a strong bias toward a growing economy. To be realistic, the statistical tools are wide open to political manipulation.
-243,000 + the Birth and Death Model + seasonal adjustment ==> +155,000
The Household Survey raw count was -489,000 people employed.
http://www.bls.gov/news.release/empsit.t01.htm